
In today’s fast-paced business environment, ccorporate compliance dashboard isn’t optional — it’s essential. Regulations evolve constantly, and failing to stay on top of compliance risks, overdue cases, and high-risk issues can cost organizations time, money, and reputation. That’s where the latest digital dashboards from NextGenTemplates.com shine — bringing clarity, control, and analytics to compliance tracking.corporate compliance dashboard
Whether you prefer a powerful spreadsheet in Microsoft Excel or a collaborative, cloud-ready version in Google Sheets, these two dashboards give you the tools you need to monitor compliance performance like a pro.corporate compliance dashboard
In this article, we’ll break down what makes the Excel and Google Sheets Corporate Compliance Dashboards indispensable, how they help you assess risk, and which one might be a better fit for your team.corporate compliance dashboard
📊 1. Total Compliance Tracking — At a Glance
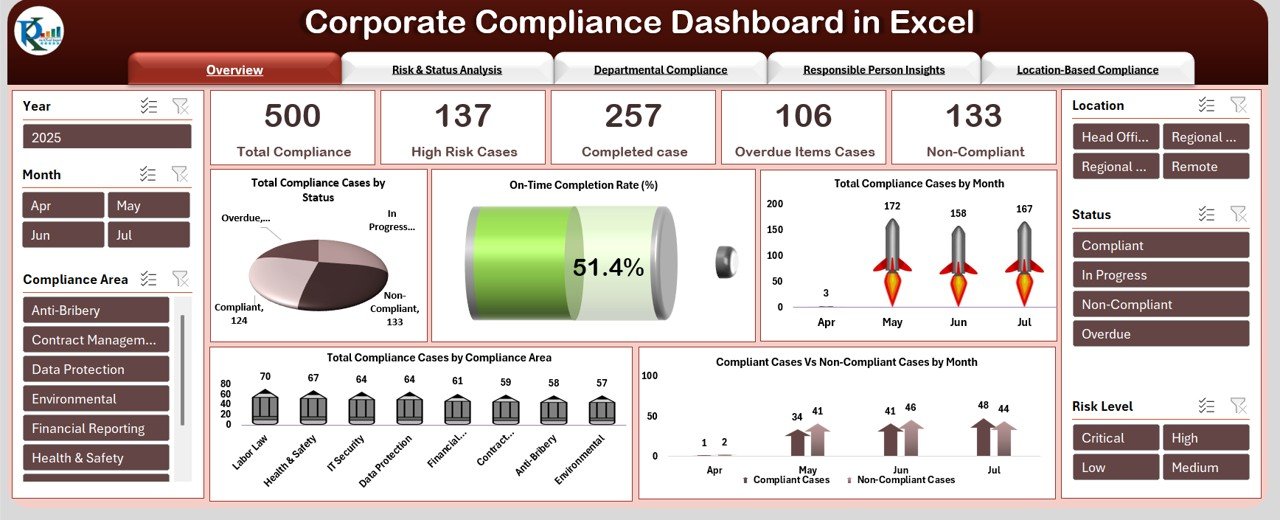
Both dashboards give you a high-level view of your organization’s compliance health. You can see:
-
The total number of compliance tasks being tracked
-
Breakdown of compliance status (e.g., Completed vs. Delayed)
-
On-time completion percentages
-
Performance trends over time
The Excel version focuses on automated visualizations and drill-downs that are ideal for reporting, while the Google Sheets version displays KPI cards and visuals that update instantly as you add data.corporate compliance dashboard
👉 Explore the Excel dashboard here: Corporate Compliance Dashboard in Excel
👉 Explore the Google Sheets dashboard here: Corporate Compliance Dashboard in Google Sheets
⚙️ 2. Built-In Visual Analytics for Strategic Insights
Visual charts and analytics are at the heart of both dashboards — but they differ slightly in focus:
Excel Dashboard
-
Risk and Status Analysis
-
Department-wise performance visuals
-
Location-based compliance trends
-
Monthly status charts
These make it ideal for reporting to leadership or preparing quarterly compliance reviews.
Google Sheets Dashboard
-
Compliance Score KPIs
-
Priority analysis (High/Medium/Low)
-
Monthly trend visuals
-
Smart search capabilities
The Google Sheets version emphasizes quick insights and collaboration, especially useful for teams working remotely or across departments.
👥 3. Department & Person Level Accountability
Compliance isn’t just about tasks — it’s about ownership and accountability.
Both dashboards include tools to analyze performance at the:
-
Department level – see which teams are excelling or falling behind
-
Individual level – know who’s overdue or high-performing
-
Location level – compare compliance across regions
This helps in performance discussions, audit meetings, and planning improvement strategies.
🧠 4. Smart Filters & Search for Faster Decision-Making
The Google Sheets dashboard includes a built-in Search Tab — a powerful feature that lets you quickly filter records by department, compliance category, or keyword without scrolling through a long list.
Excel users benefit from slicers and filters that allow for faster navigation and view customization — especially useful in large compliance databases.
🌐 5. Collaboration & Accessibility
Here’s where one choice may matter more depending on your workflow:
Google Sheets Version
-
Cloud-based — multiple users can edit and view in real time
-
Works great for teams that don’t share a common server
-
Auto-updates as data changes
This makes it a perfect choice for distributed teams or cross-functional compliance groups.
Excel Version
-
Works beautifully on desktop and integrates well with email attachments
-
Ideal for offline environments or teams that rely on desktop applications
Both options are fully customizable to fit your company’s structure and reporting style.
📥 6. Easy Data Input — No Coding Required
You don’t need to be a developer or analyst to use either tool:
-
Pre-built data entry sheets capture compliance case details such as priority, status, risk level, department, and owner.
-
As you input data, visuals and charts update automatically.
-
Dropdown menus guide consistent input and eliminate errors.
This makes these dashboards accessible for compliance officers, auditors, and team leaders alike — regardless of technical expertise.
🚀 7. Who Should Use These Dashboards?
These dashboards provide value for:
✅ Compliance Officers & Legal Teams
✅ Internal Auditors
✅ Risk Management Teams
✅ Department Heads
✅ Corporate Governance Committees
✅ Remote or Distributed Teams
Whether you’re handling a few compliance tasks or thousands annually, both dashboards scale effectively and support smarter compliance management.
Which Should You Choose?
| Feature | Excel Compliance Dashboard | Google Sheets Compliance Dashboard |
|---|---|---|
| Platform | Excel | Cloud-based |
| Collaboration | Best for internal teams with shared files | Excellent for remote teams |
| Real-Time Updates | Manual refresh or shared workbook | Instant auto-update |
| Ease of Use | Familiar Excel interface | Lightweight and accessible online |
| Deep Reporting | Strong department & location analysis | Strong priority & KPI visual analysis |
If your team uses Excel daily and prefers desktop analysis, the Excel version is unmatched. If your priority is collaborative tracking and remote access, the Sheets version is a strong choice.
📌 Final Thoughts
Efficient compliance tracking doesn’t have to be manual or time-consuming. With these professionally designed dashboards, you get:
✔️ Automated visuals
✔️ Real-time performance insights
✔️ Departmental and individual accountability
✔️ Customizable compliance reporting
✔️ No coding or complex setup
Visit our YouTube channel to learn step-by-step video tutorials