Managing events, sponsorships, and community engagement across multiple platforms can quickly become overwhelming. But what if you could monitor everything in one beautifully designed, easy-to-use dashboard?
👉 Introducing the Women in Tech Communities Dashboard in Excel — a powerful and ready-to-use tool designed to help you track community performance, event success, sponsorship impact, and engagement metrics in one place.
Whether you are a community organizer, sponsor, or program manager, this dashboard transforms raw data into meaningful insights—helping you make smarter, data-driven decisions that drive growth and impact.
With just a simple data update and refresh, you can instantly visualize attendance trends, sponsorship performance, mentorship contributions, and satisfaction scores. No complex formulas, no manual reporting—just clear, actionable insights.
🔑 Key Features of Women in Tech Communities Dashboard in Excel
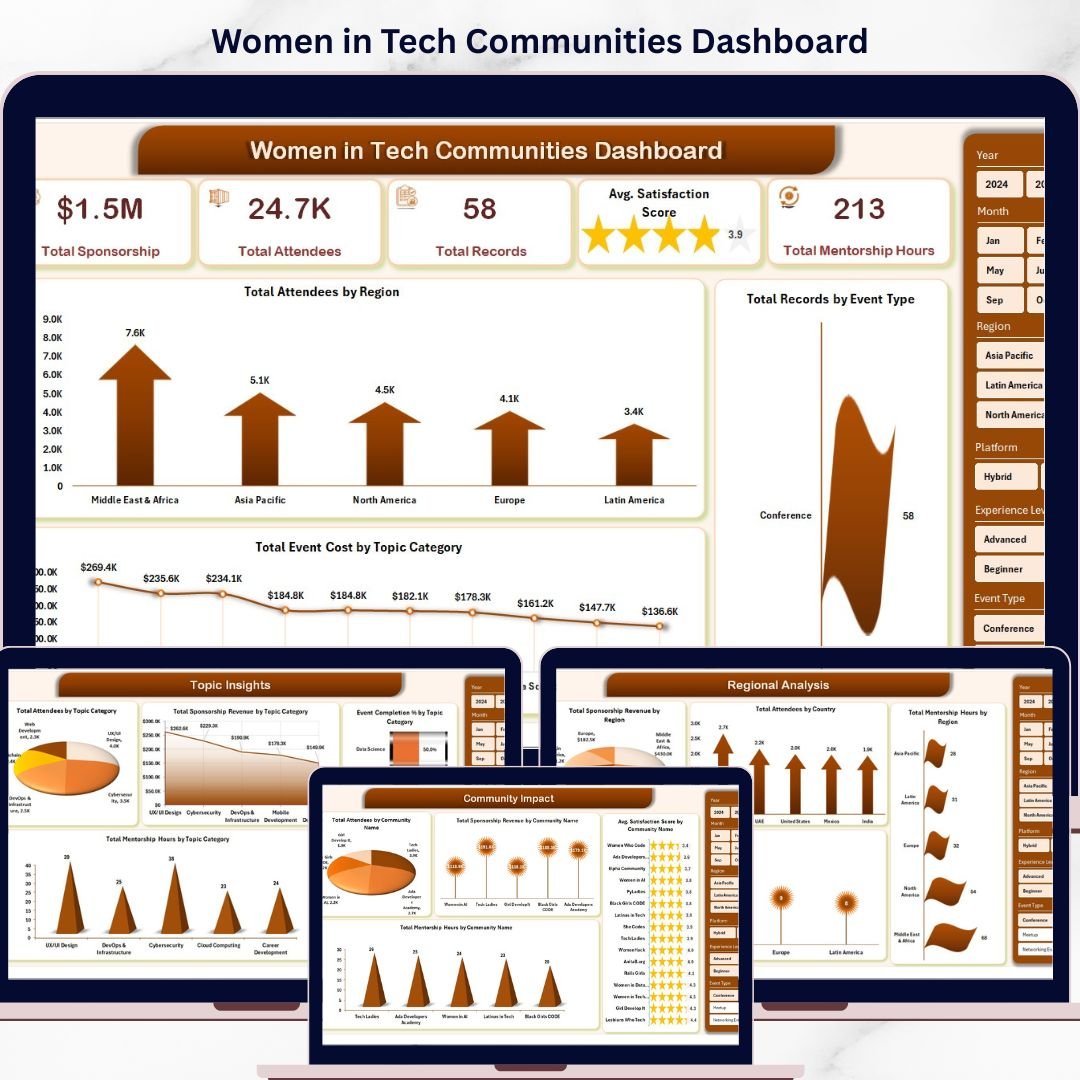
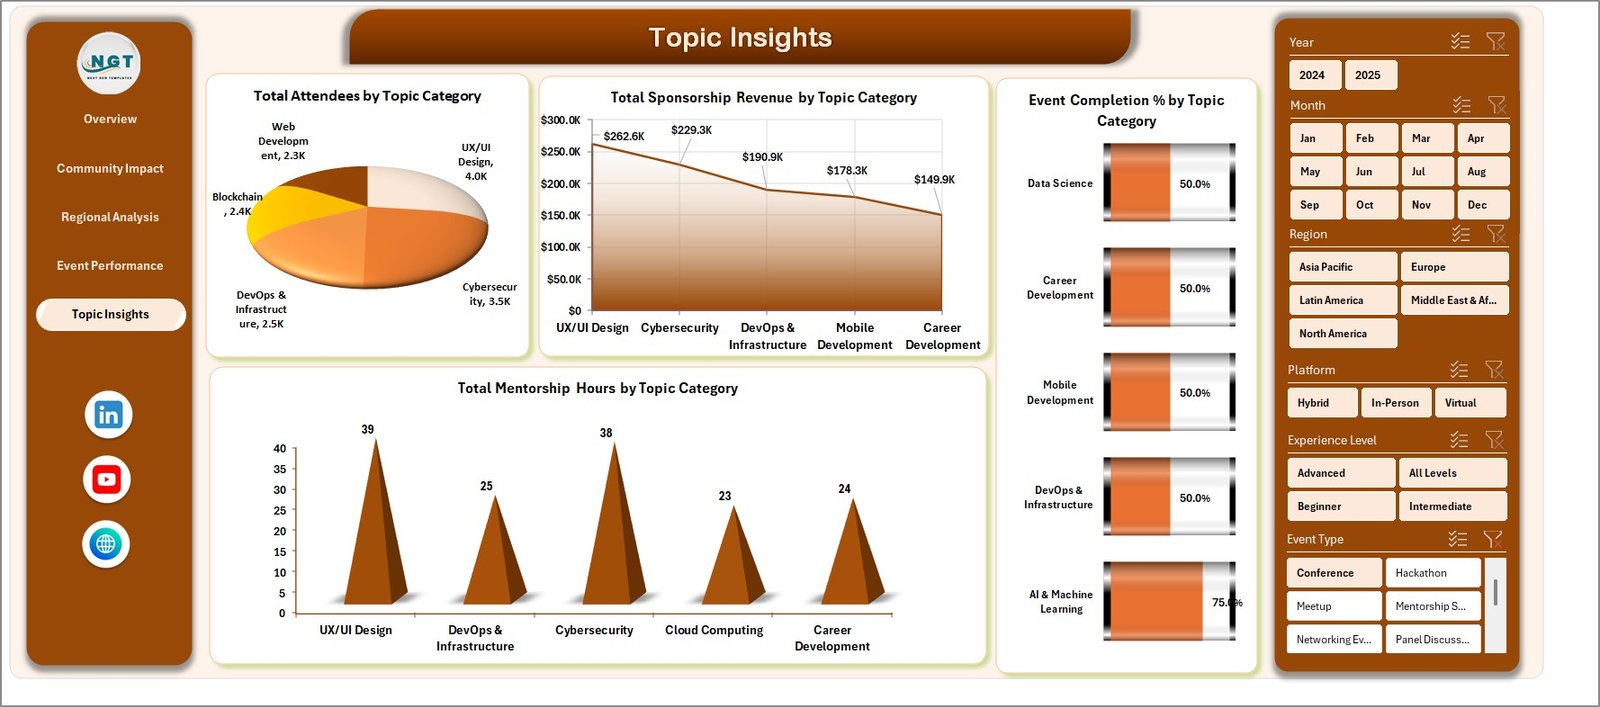
✨ Interactive Multi-Page Dashboard – Analyze data across Overview, Community Impact, Regional Analysis, Event Performance, and Topic Insights.
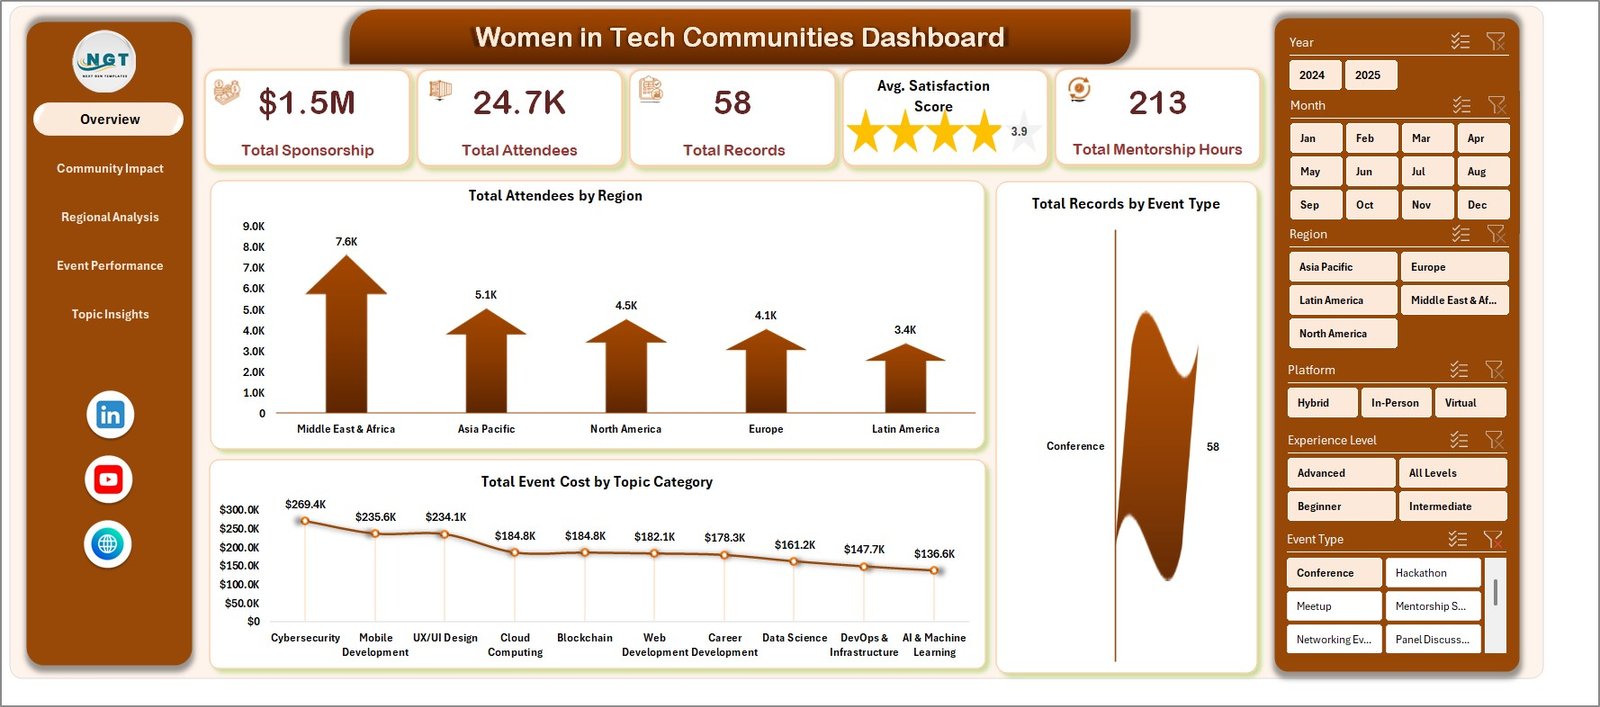
📊 Powerful KPI Cards – Track Total Sponsorship, Total Attendees, Avg. Satisfaction Score, and Mentorship Hours instantly.
🎯 Smart Slicers & Filters – Quickly filter data by region, event type, and community for targeted analysis.
📈 Dynamic Pivot Charts – Visualize trends and patterns with interactive charts powered by pivot tables.
⚡ Easy Data Refresh – Update your data and refresh all visuals instantly with one click.
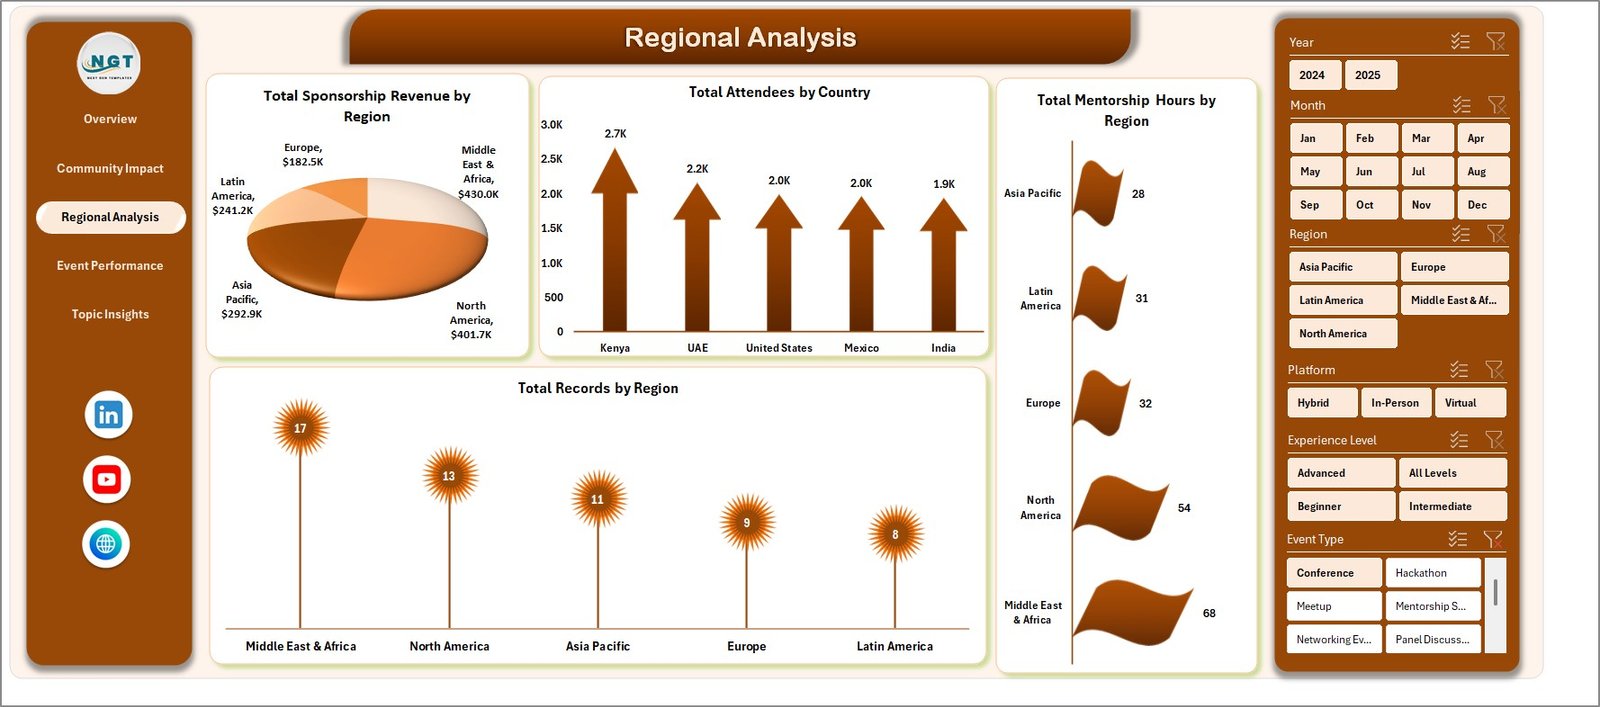
🌍 Regional Insights – Understand performance across regions and identify growth opportunities.
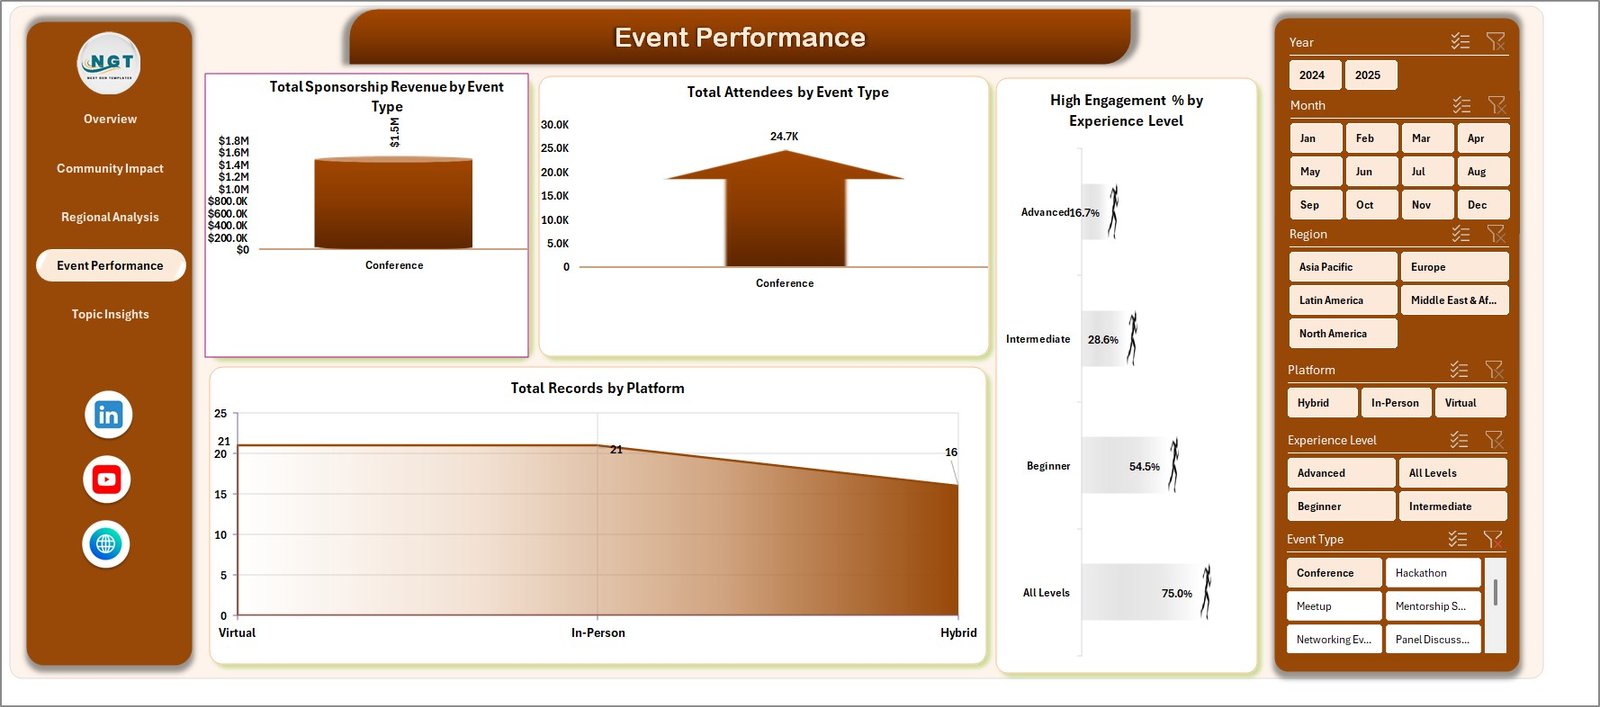
🎤 Event Performance Tracking – Measure engagement and success rates of different event types.
🧠 Topic-Based Insights – Analyze which topics drive the most sponsorship, engagement, and mentorship.
📦 What’s Inside the Women in Tech Communities Dashboard in Excel
📁 6 Structured Dashboard Components
- Overview Dashboard
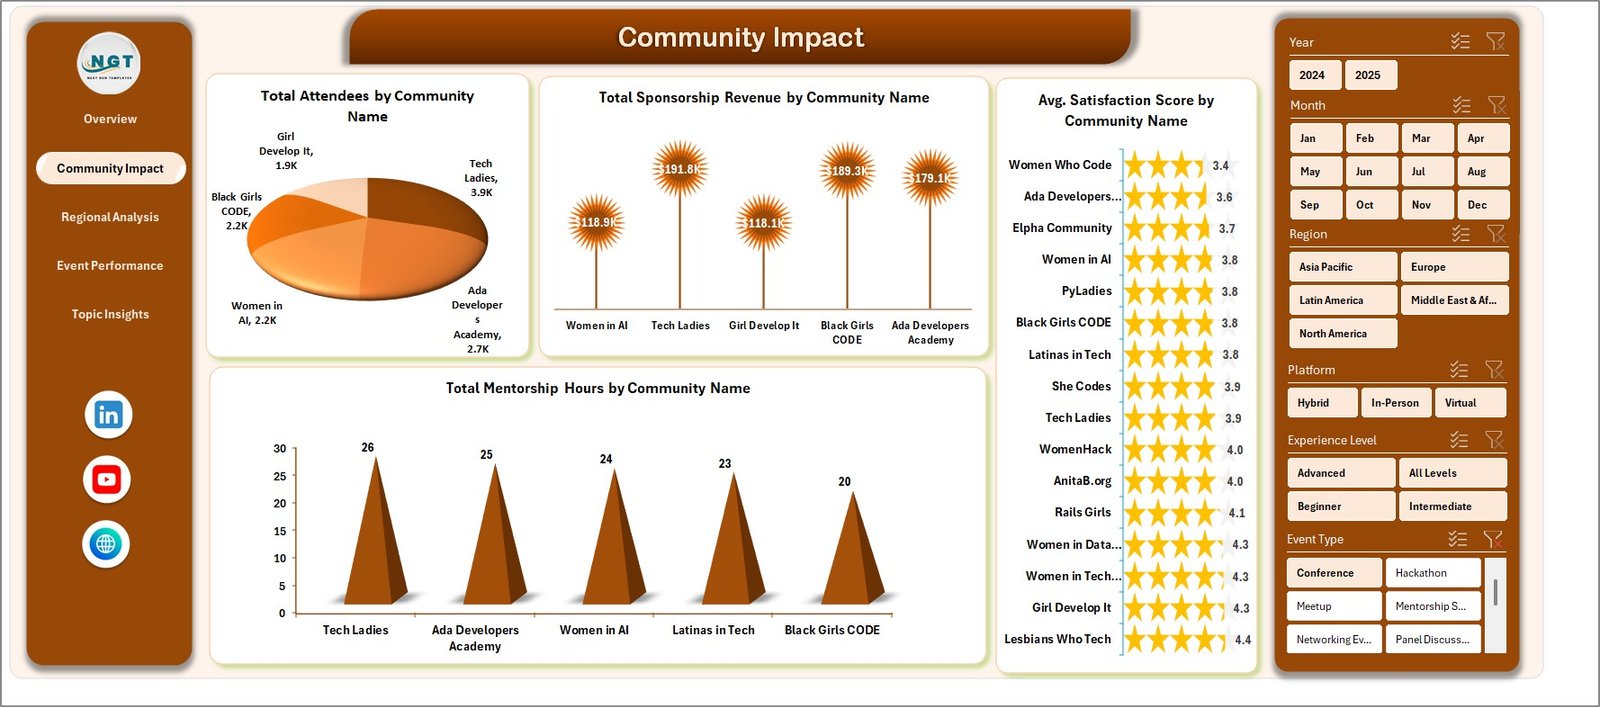
- Community Impact Analysis
- Regional Analysis
- Event Performance Analysis
- Topic Insights Analysis
- Data Sheet Tab
📊 Pre-Built KPI Metrics & Charts
- Total Sponsorship Revenue
- Total Attendees & Records
- Avg. Satisfaction Score
- Total Mentorship Hours
- Event Engagement Metrics
🎛️ Interactive Slicers & Filters
- Filter by Region
- Filter by Event Type
- Filter by Community Name
📂 Support Sheet with Pivot Tables
- Automated calculations
- Backend data processing
- Seamless dashboard updates
⚙️ How to Use the Women in Tech Communities Dashboard in Excel
1️⃣ Open the Excel dashboard file after download
2️⃣ Enter or update your data in the Data Sheet tab
3️⃣ Go to the Data tab and click Refresh All
4️⃣ Use slicers to filter and explore specific insights
5️⃣ Analyze KPIs and charts to make better decisions
💡 No advanced Excel skills required—this dashboard is built for ease and efficiency.
👥 Who Can Benefit from This Women in Tech Communities Dashboard in Excel
👩💻 Community Managers – Track engagement and improve community impact
🎤 Event Organizers – Analyze event success and attendee participation
💼 Sponsors & Partners – Monitor sponsorship ROI and contributions
📊 Data Analysts – Gain deep insights into community performance
🌍 Non-Profit Organizations – Measure impact and optimize outreach programs
This dashboard empowers you to turn community data into actionable insights. As a result, you can improve engagement, optimize events, and maximize sponsorship impact.
Instead of struggling with scattered data, you can now manage everything in one place—clearly, efficiently, and professionally.
📖 Click here to read the Detailed blog post
🎥 Visit our YouTube channel to learn step-by-step video tutorials
👉 https://youtube.com/@PKAnExcelExpert


