In today’s digital-first business environment, website performance plays a crucial role in marketing success, customer engagement, and revenue growth. Organizations invest heavily in SEO, advertising campaigns, and content marketing strategies. However, many teams struggle to interpret website performance effectively because analytics data often remains scattered across multiple tools and reports.
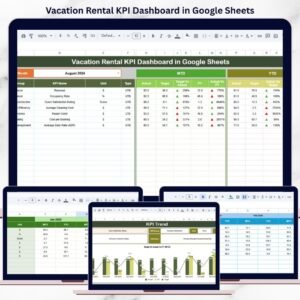
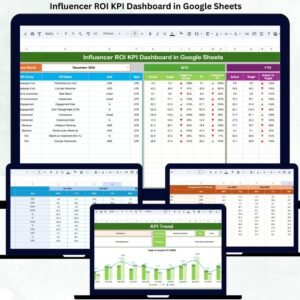
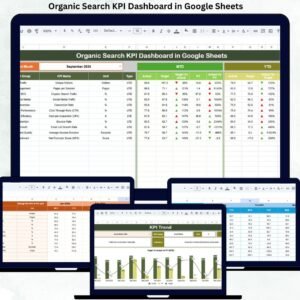
The Website Traffic KPI Dashboard in Google Sheets is a powerful, ready-to-use analytics solution designed to simplify website performance monitoring using structured Key Performance Indicators (KPIs). Built entirely in Google Sheets, this interactive dashboard transforms raw website data into clear visual insights, enabling teams to track performance, compare results, and make data-driven decisions faster.
Instead of switching between analytics platforms, users can monitor all important website KPIs from one centralized dashboard. Because Google Sheets is cloud-based, teams collaborate in real time, ensuring accurate reporting and shared visibility across marketing and management teams. 🌐📊
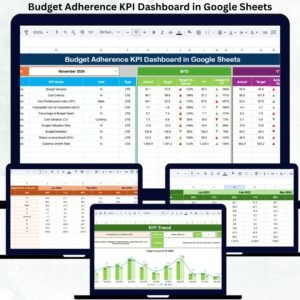
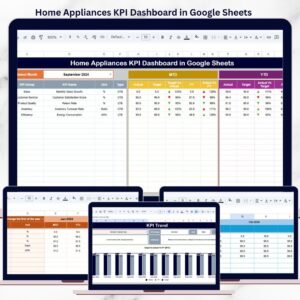
The dashboard combines automated calculations, performance comparisons, and trend analysis to deliver both short-term and long-term insights. With built-in Month-to-Date (MTD) and Year-to-Date (YTD) analysis, organizations can evaluate campaign effectiveness while tracking overall growth trends.
Whether managing SEO performance, marketing campaigns, or website engagement metrics, this dashboard helps businesses convert complex analytics into actionable strategies that improve online performance.
## Key Features of Website Traffic KPI Dashboard in Google Sheets
📊 Centralized Website KPI Dashboard – Monitor traffic, engagement, and performance metrics from one interface.
📅 Dynamic Month Selection – Change reporting month instantly using dropdown controls.
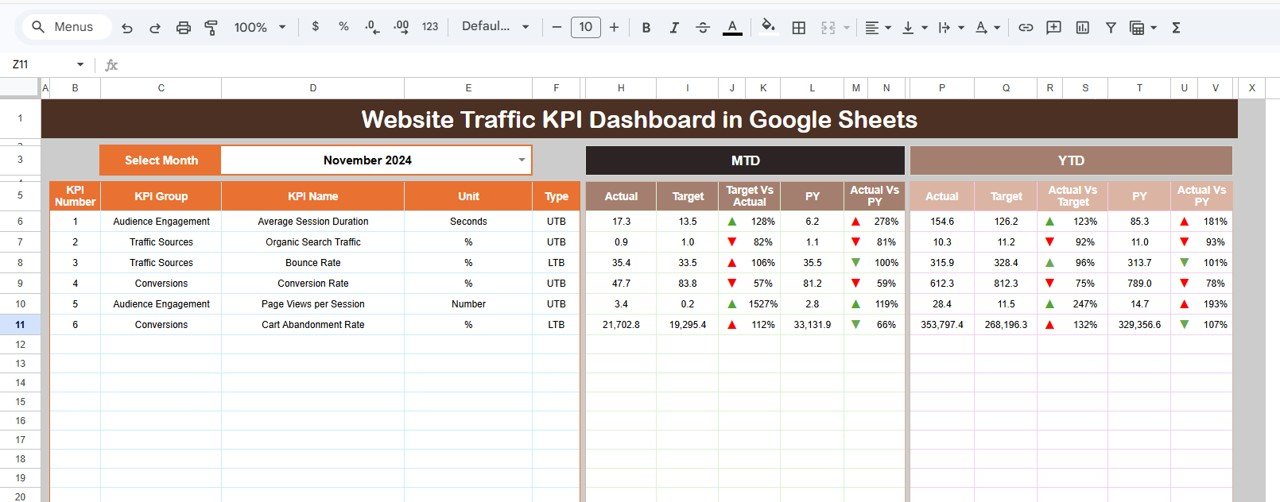
🎯 Actual vs Target Analysis – Evaluate marketing performance against predefined goals.
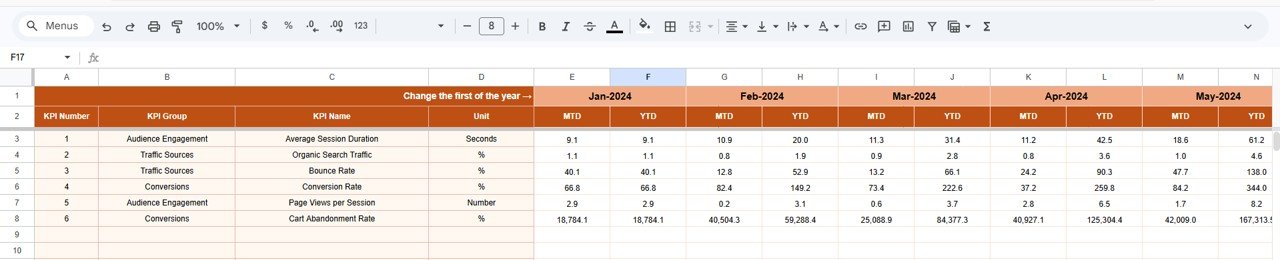
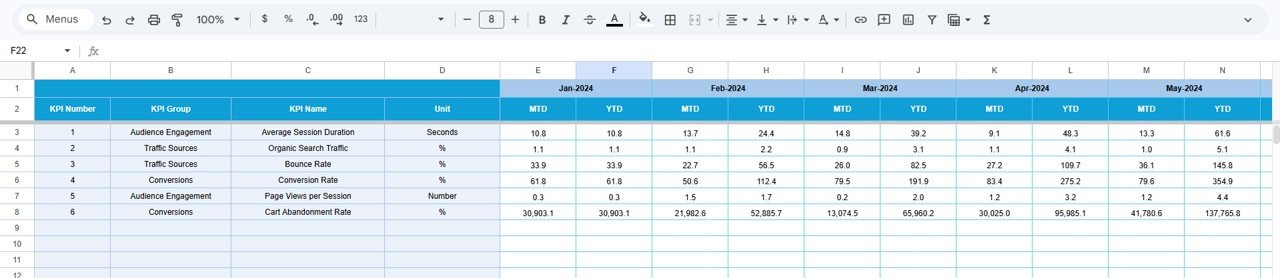
📈 MTD & YTD Performance Tracking – Compare monthly and yearly analytics automatically.
🔄 Previous Year Comparison – Measure growth using historical performance data.
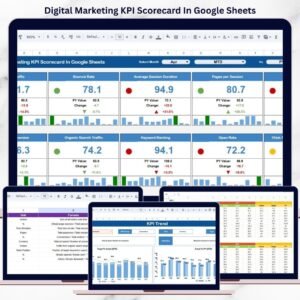
🔺 Visual Performance Indicators – Up/down arrows highlight performance trends instantly.
📉 Detailed KPI Trend Analysis – Analyze performance patterns over time.
☁️ Cloud-Based Collaboration – Teams update and access dashboards simultaneously.
These features transform Google Sheets into a professional website analytics platform.
## What’s Inside the Website Traffic KPI Dashboard in Google Sheets
This ready-to-use template includes six structured worksheets:
✅ Dashboard Sheet – Main performance interface showing KPI comparisons and indicators.
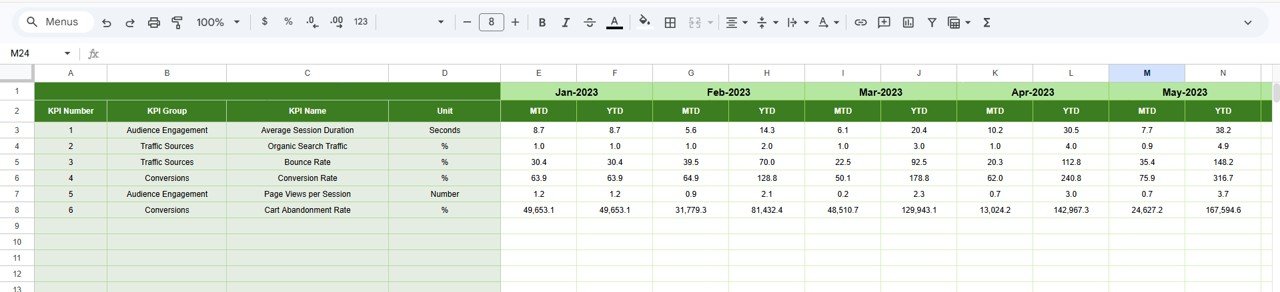
✅ KPI Trend Sheet – Detailed KPI analysis with formulas, definitions, and performance trends.
✅ Actual Number Sheet – Data entry area for current year website performance.
✅ Target Sheet – Centralized performance goals and benchmarks.
✅ Previous Year Number Sheet – Historical KPI data for year-over-year comparison.
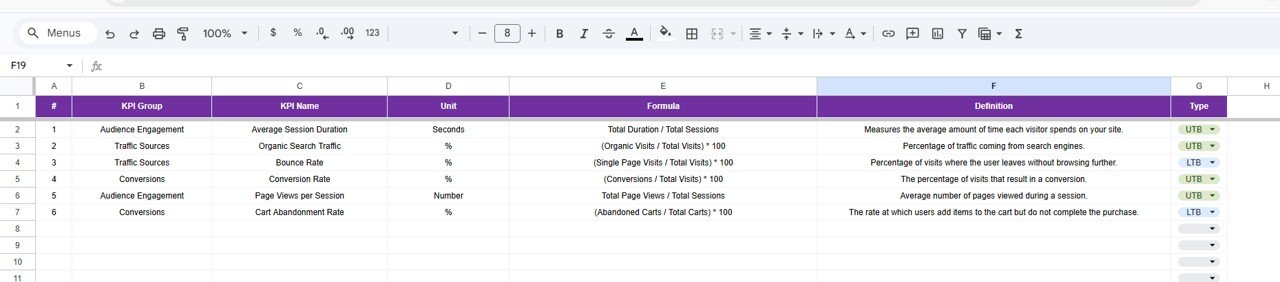
✅ KPI Definition Sheet – Documentation hub defining KPI formulas, units, and logic.
Together, these sheets provide a complete website performance monitoring system.
## How to Use the Website Traffic KPI Dashboard in Google Sheets
Using the dashboard is simple and beginner-friendly:
1️⃣ Enter website performance data in the Actual Number Sheet.
2️⃣ Define targets in the Target Sheet.
3️⃣ Add previous year data for benchmarking.
4️⃣ Select the reporting month from the dashboard dropdown.
5️⃣ Review KPI indicators and comparisons.
6️⃣ Analyze trends using the KPI Trend Sheet.
Within minutes, teams can start monitoring website performance professionally.
## Who Can Benefit from This Website Traffic KPI Dashboard in Google Sheets
This template is ideal for:
🌐 Digital marketing teams
📈 SEO specialists and analysts
🧑💻 Website managers
📊 Business analysts
🚀 Marketing agencies
🏢 Online businesses and startups
From small websites to enterprise-level digital platforms, any organization tracking website performance can benefit from this dashboard.
A structured KPI monitoring system transforms website analytics into strategic insights. By combining automated comparisons, centralized reporting, and visual analytics, the Website Traffic KPI Dashboard in Google Sheets helps organizations understand performance clearly and optimize marketing strategies effectively.
Instead of reacting to data after campaigns end, teams gain continuous insights that drive smarter decisions and sustainable digital growth. ✅
### Click here to read the Detailed blog post
Watch the step-by-step video tutorial:
Visit our YouTube channel to learn step-by-step video tutorials:
👉 YouTube.com/@NeotechNavigators