Water utilities operate under constant pressure to deliver safe, reliable, and sustainable water services. They must monitor water demand, distribution efficiency, contamination risks, treatment performance, and consumer usage—often across multiple regions and systems. However, when data sits in scattered spreadsheets and static reports, visibility reduces, response time increases, and risks go unnoticed. This is exactly why the Water Utilities Dashboard in Power BI becomes a critical operational and decision-support tool.
This ready-to-use Power BI dashboard transforms raw water utility data into interactive visuals, KPI cards, and trend-based insights. It enables utility managers, operations teams, compliance officers, and leadership to monitor performance in real time, identify risks early, and allocate resources more effectively. By combining Excel-based data sources with powerful Power BI analytics, this dashboard delivers clarity, control, and confidence.
💧 Key Features of the Water Utilities Dashboard in Power BI
This dashboard is designed with a five-page analytical structure, ensuring every aspect of water utility operations is monitored clearly and efficiently.
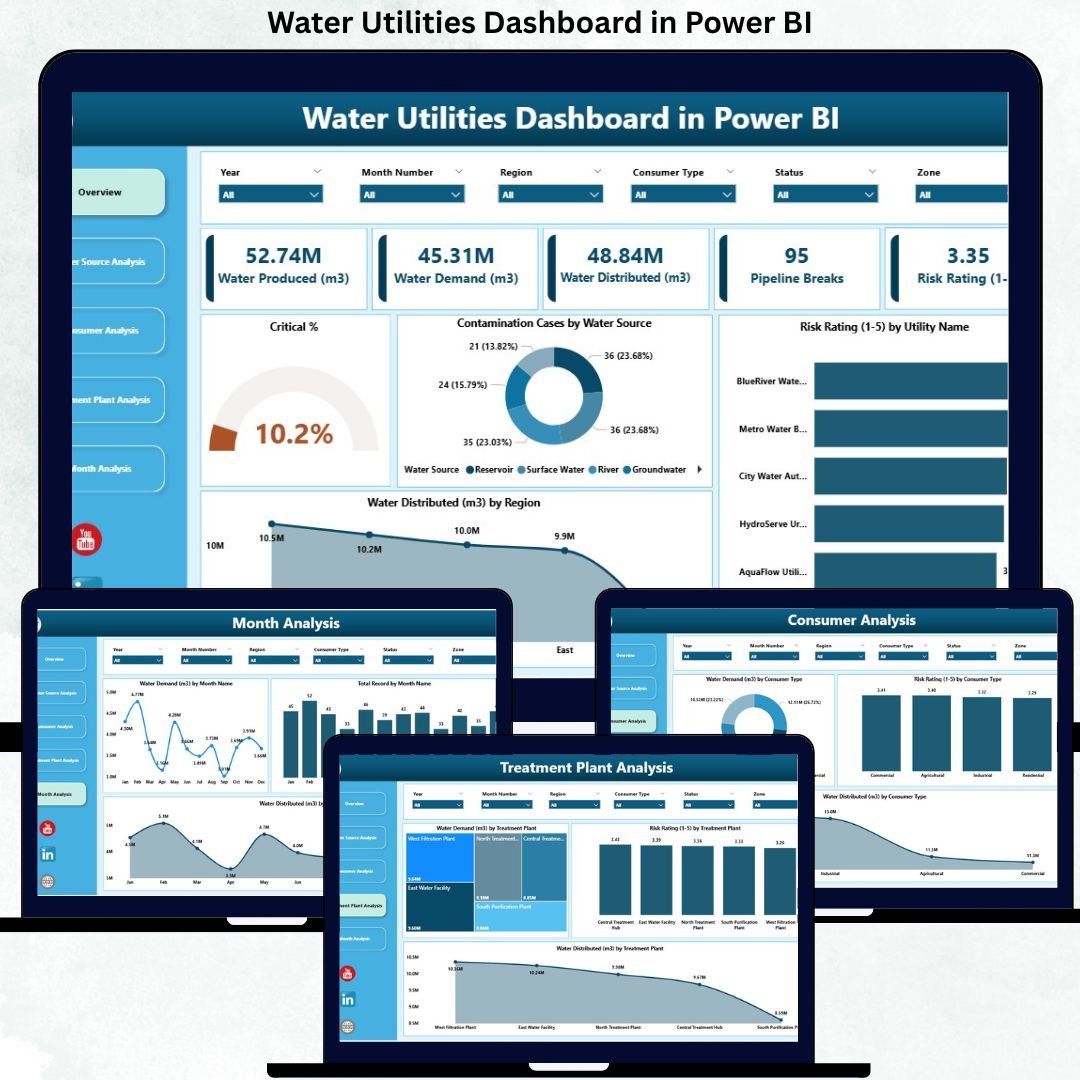
📊 Overview Page – Complete Water Utility Performance Snapshot
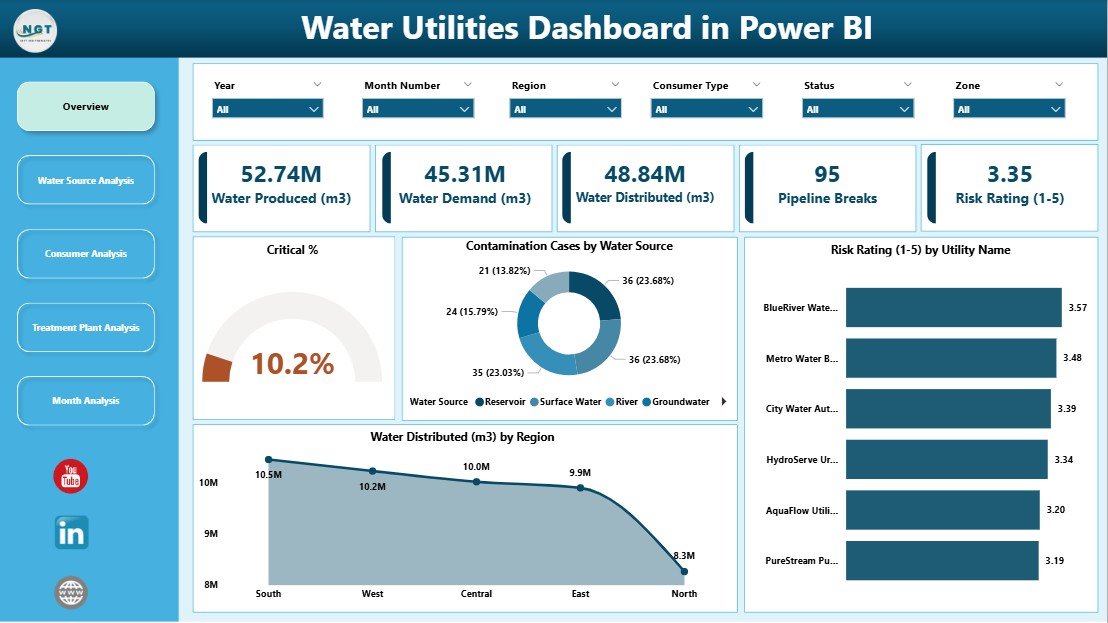
The Overview Page acts as the command center of the dashboard.
Key elements include:
-
🎛 Interactive slicers to filter by time, region, or utility
-
🧮 KPI Cards showing:
-
Critical %
-
Total Records
-
-
📈 Core charts, such as:
-
Critical % overview
-
Contamination Cases by Water Source
-
Risk Rating by Utility Name
-
Water Distributed by Region
-
This page gives leadership an instant understanding of system health, risk severity, and supply distribution.
📦 What’s Inside the Water Utilities Dashboard in Power BI
The dashboard includes five powerful analytical pages, each focusing on a specific operational area:
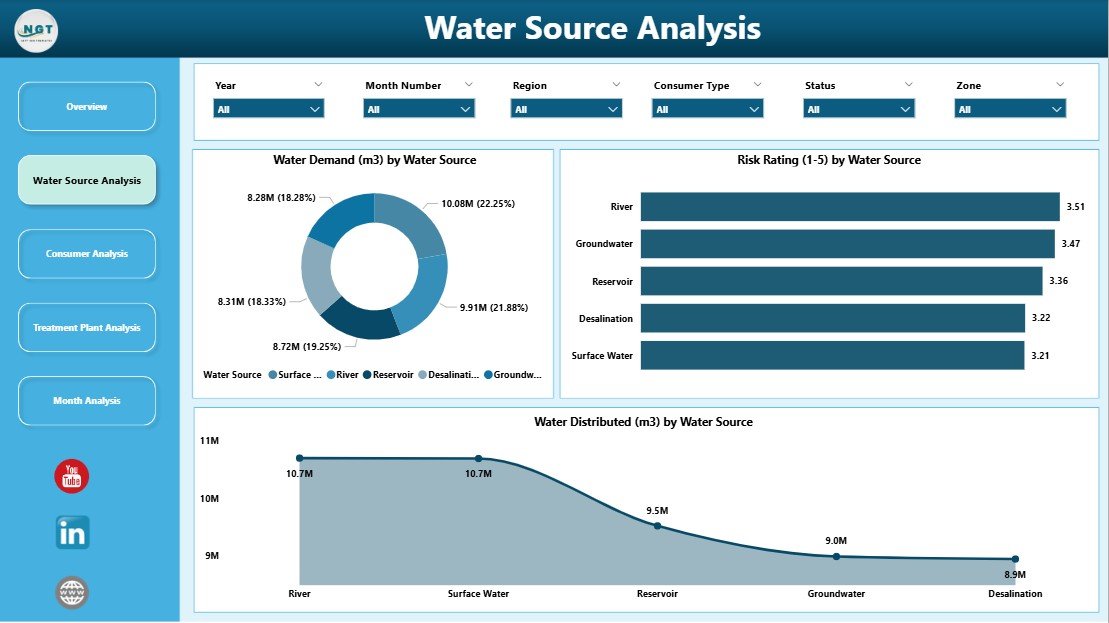
🌊 Water Source Analysis Page
This page analyzes performance and risks across different water sources such as rivers, groundwater, reservoirs, and desalination plants.
Charts include:
-
Water Demand by Water Source
-
Risk Rating by Water Source
-
Water Distributed by Water Source
This analysis helps utilities optimize sourcing strategies and reduce dependency risks.
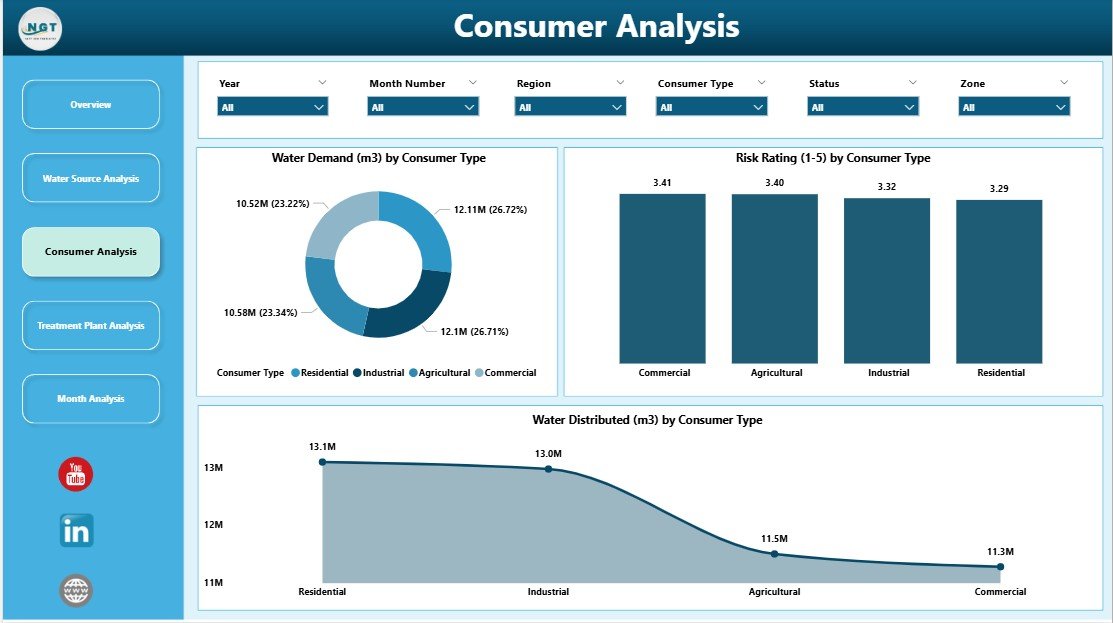
👥 Consumer Analysis Page
The Consumer Analysis Page highlights usage patterns and risks across consumer categories.
Charts include:
-
Water Demand by Consumer Type
-
Risk Rating by Consumer Type
-
Water Distributed by Consumer Type
Utilities use this page to manage residential, commercial, industrial, and agricultural demand effectively.
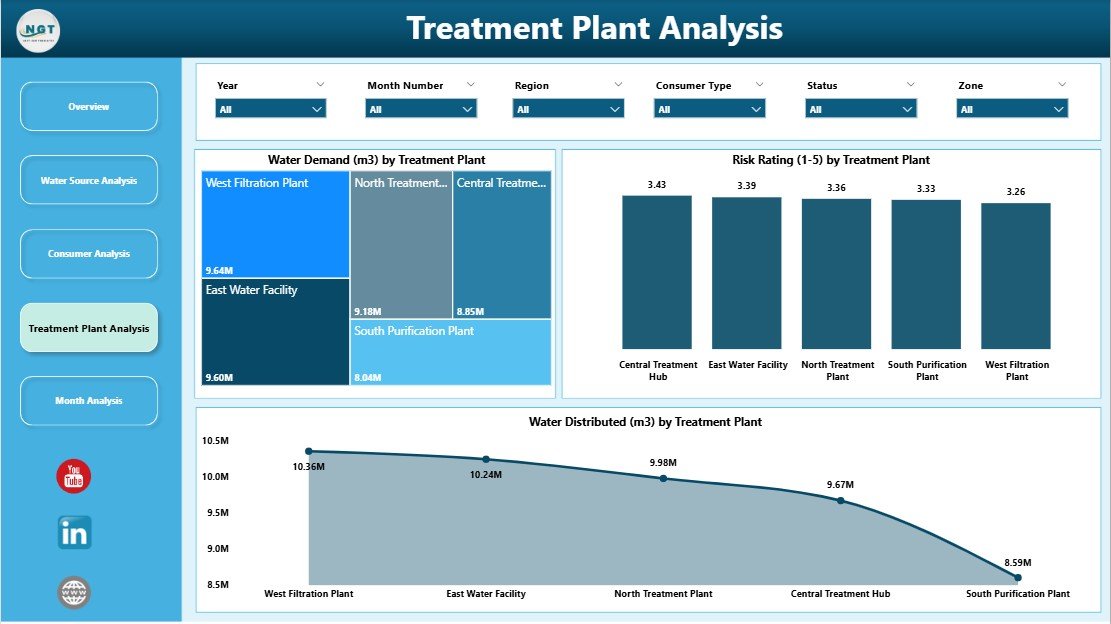
🏭 Treatment Plant Analysis Page
This page focuses on treatment efficiency and operational risks.
Charts include:
-
Water Demand by Treatment Type
-
Risk Rating by Treatment Type
-
Water Distributed by Treatment Type
It helps identify underperforming treatment processes and supports maintenance and upgrade planning.
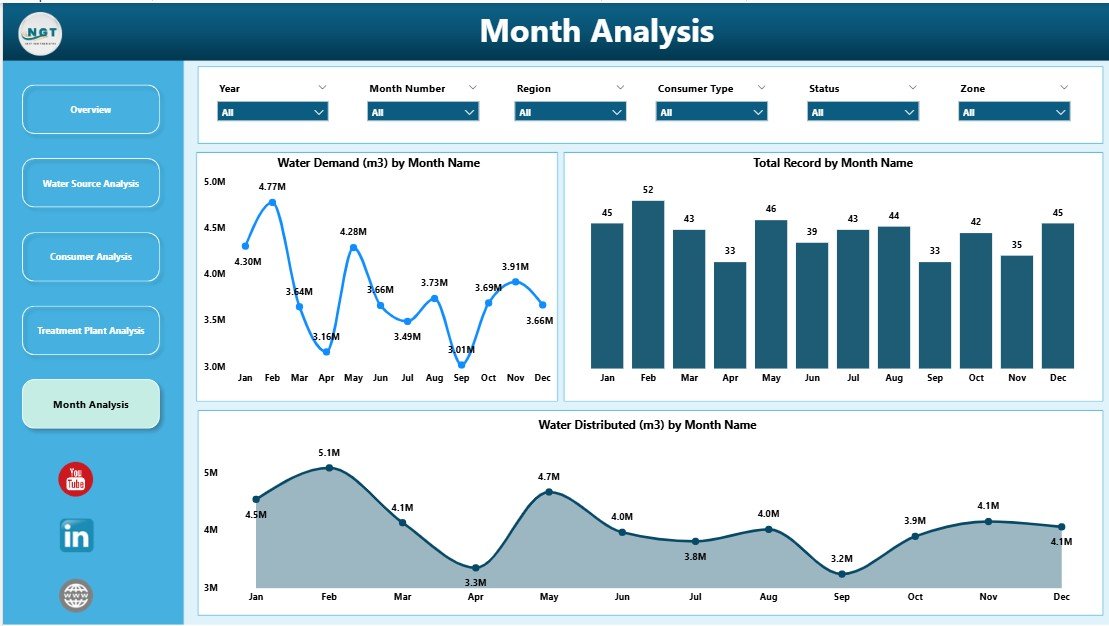
📅 Monthly Trends Page
Time-based analysis is critical for forecasting and sustainability planning.
Charts include:
-
Water Demand by Month
-
Total Records by Month
-
Water Distributed by Month
This page helps utilities identify seasonal demand patterns and prepare infrastructure capacity in advance.
⚙️ How to Use the Water Utilities Dashboard in Power BI
1️⃣ Update water utility data in the connected Excel or database source
2️⃣ Refresh the Power BI dataset
3️⃣ Use slicers to filter by region, utility, source, or consumer type
4️⃣ Review the Overview page for instant risk visibility
5️⃣ Drill into source, consumer, or treatment pages for deeper insights
6️⃣ Analyze monthly trends for planning and forecasting
No complex coding. No manual reporting.
👥 Who Can Benefit from This Dashboard?
This dashboard is ideal for:
-
💧 Water Utility Managers
-
🛠 Operations & Maintenance Teams
-
⚠ Risk & Compliance Officers
-
🌱 Sustainability & ESG Teams
-
🧪 Environmental Analysts
-
🏛 Government & Regulatory Authorities
Any organization managing water distribution and treatment gains immediate value.
### Click here to read the Detailed blog post
Visit our YouTube channel to learn step-by-step video tutorials
👉 Youtube.com/@PKAnExcelExpert


Reviews
There are no reviews yet.