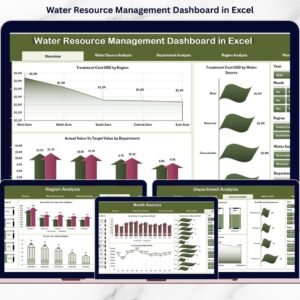
Water Resource Management Dashboard organizations struggle to monitor reservoir levels, rainfall, treatment cost, and actual vs target consumption in one structured system. As a result, leaders miss trends. Departments overspend. Strategic planning becomes reactive instead of proactive.
Now imagine tracking Reservoir Level %, Treatment Cost (USD), Rainfall (mm), Region Performance, Department Efficiency, and Monthly Trends — all inside one powerful Excel dashboard.
That is exactly what the Water Resource Management Dashboard in Excel delivers.
This ready-to-use Excel dashboard transforms scattered data into clear visuals, KPI cards, and interactive analysis pages. As a result, decision-makers gain clarity, control, and confidence.
Stop managing water blindly. Start managing with insight.
🚀 Key Features of Water Resource Management Dashboard in Excel
📊 5 Fully Designed Analytical Pages
🧭 Page Navigator for Easy Navigation
🔎 Right-Side Slicers for Dynamic Filtering
🎯 KPI Cards for Instant Summary
📈 Actual vs Target Comparison
📅 Month-Wise & Previous Year Analysis
🌍 Region & Department-Level Insights
💰 Treatment Cost Monitoring
🛠 Easy Customization in Excel
Because it runs entirely in Excel, you do not need expensive software or advanced technical skills.
📦 What’s Inside the Water Resource Management Dashboard in Excel
This dashboard includes five structured analysis pages, each focused on a specific business area:
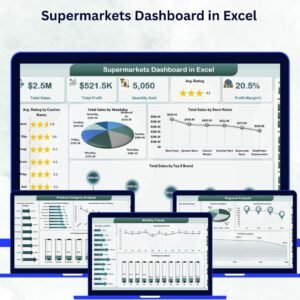
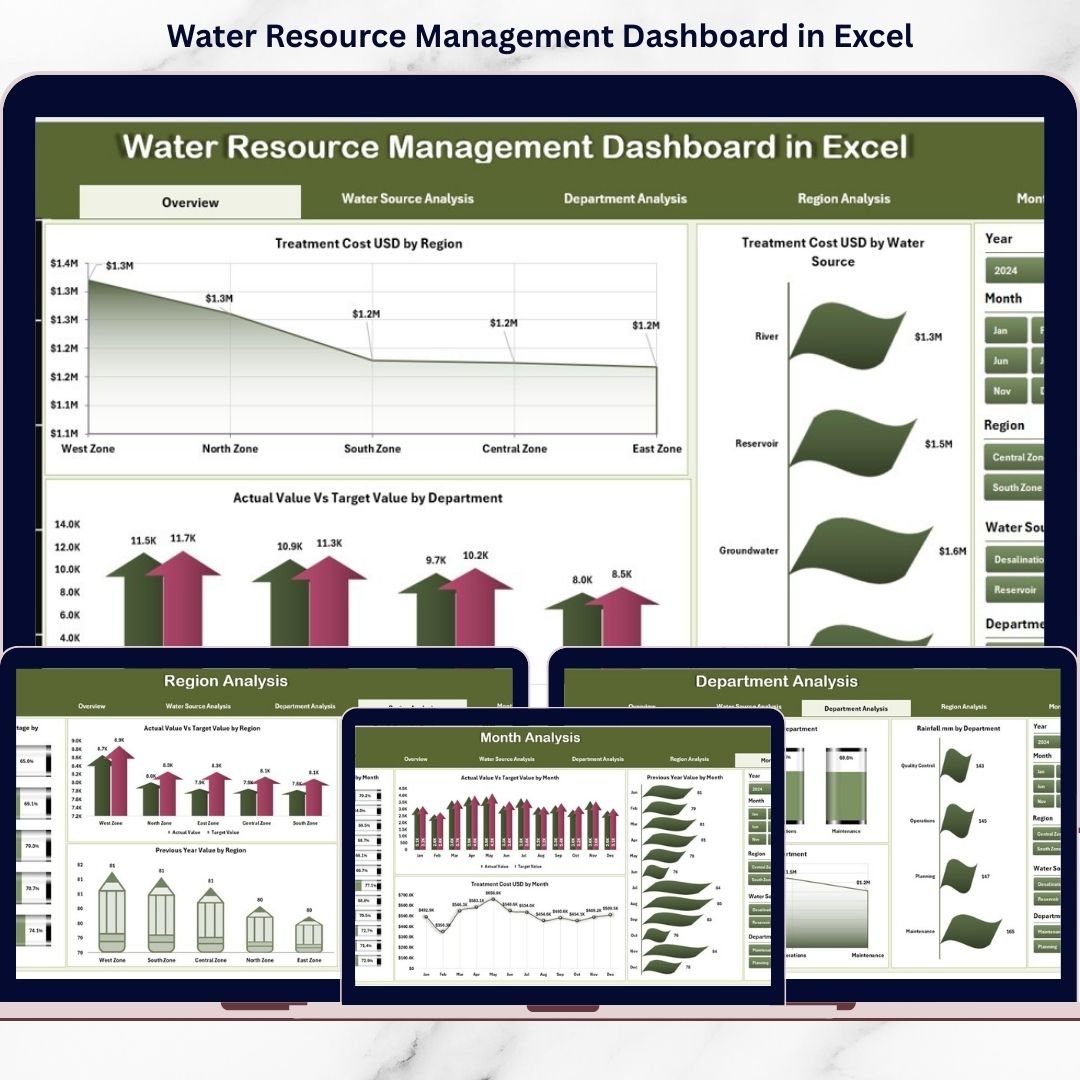
1️⃣ Overview Page – Strategic Snapshot
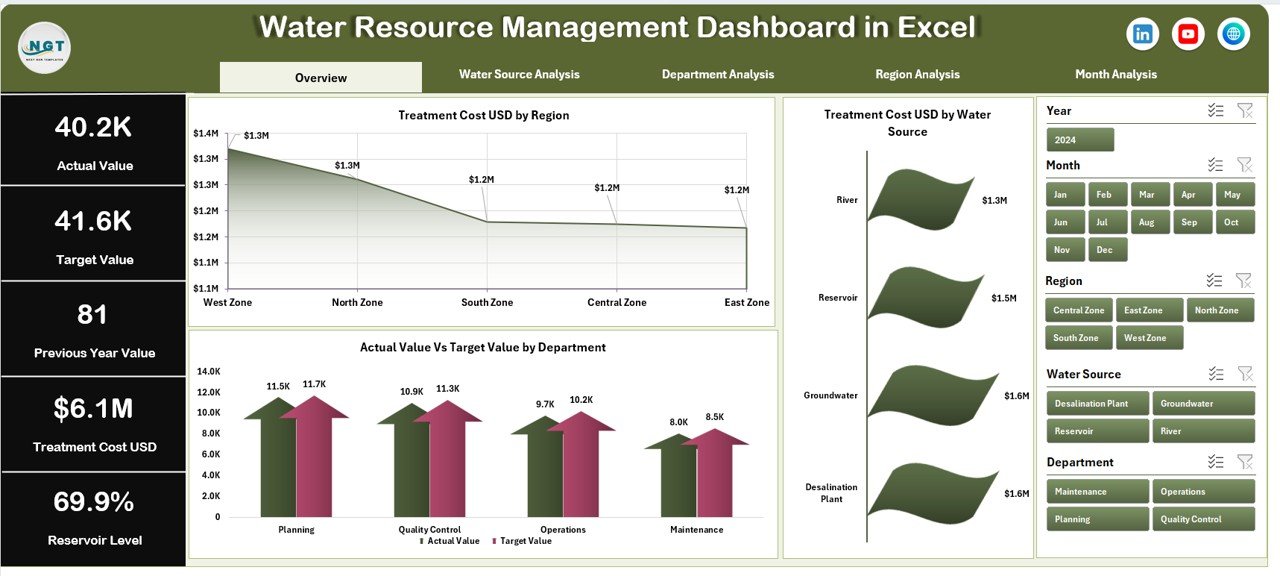
The Overview page acts as the control center.
It displays KPI cards such as:
-
Total Treatment Cost (USD)
-
Average Reservoir Level (%)
-
Total Rainfall (mm)
-
Actual vs Target Performance (%)
It also includes charts:
-
Treatment Cost USD by Region
-
Treatment Cost USD by Water Source
-
Actual vs Target by Department
This page helps leadership quickly detect cost spikes or performance gaps.
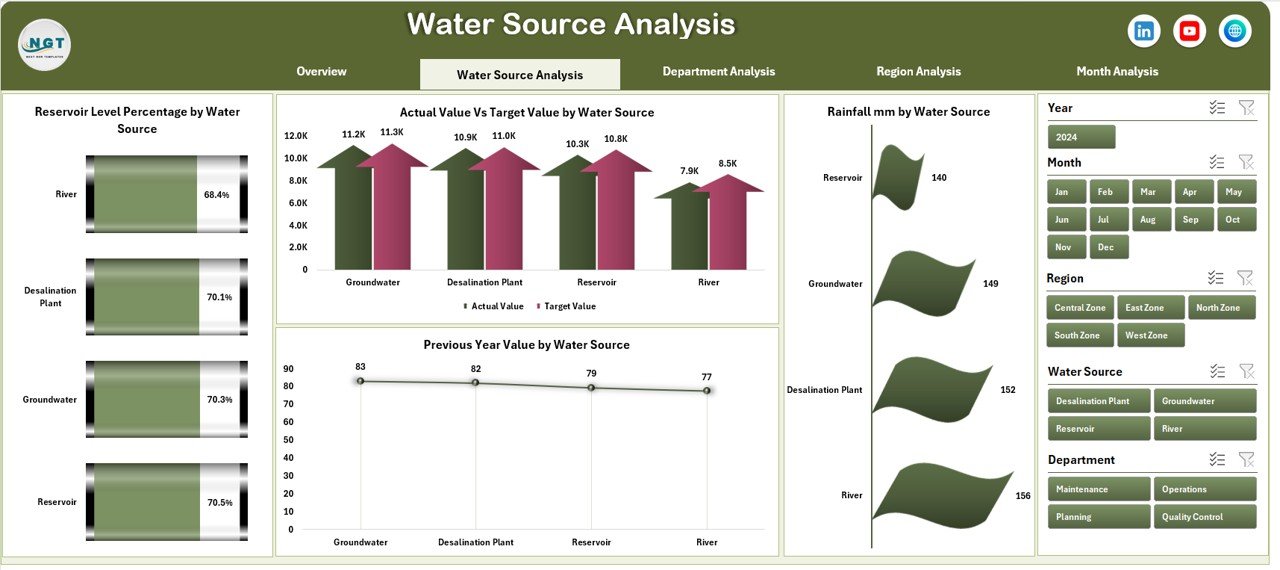
2️⃣ Water Source Analysis – Source-Level Insights
Analyze performance across water sources like:
-
Reservoirs
-
Groundwater
-
Rivers
-
Rainwater Harvesting
-
Recycled Water
Charts include:
-
Reservoir Level % by Water Source
-
Actual vs Target by Water Source
-
Rainfall (mm) by Water Source
-
Previous Year Value by Water Source
Optimize supply strategy and monitor sustainability.
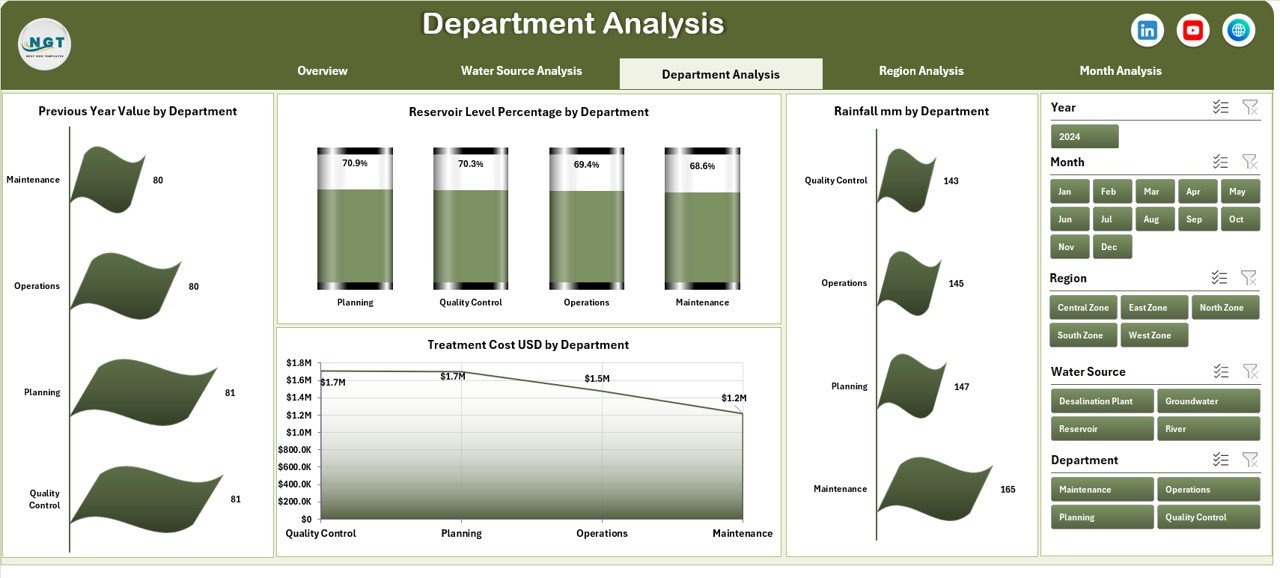
3️⃣ Department Analysis – Accountability & Efficiency
This page compares departments side by side.
Track:
-
Reservoir Level % by Department
-
Actual vs Target by Department
-
Rainfall Impact
-
Previous Year Performance
Identify departments that exceed or miss sustainability targets.
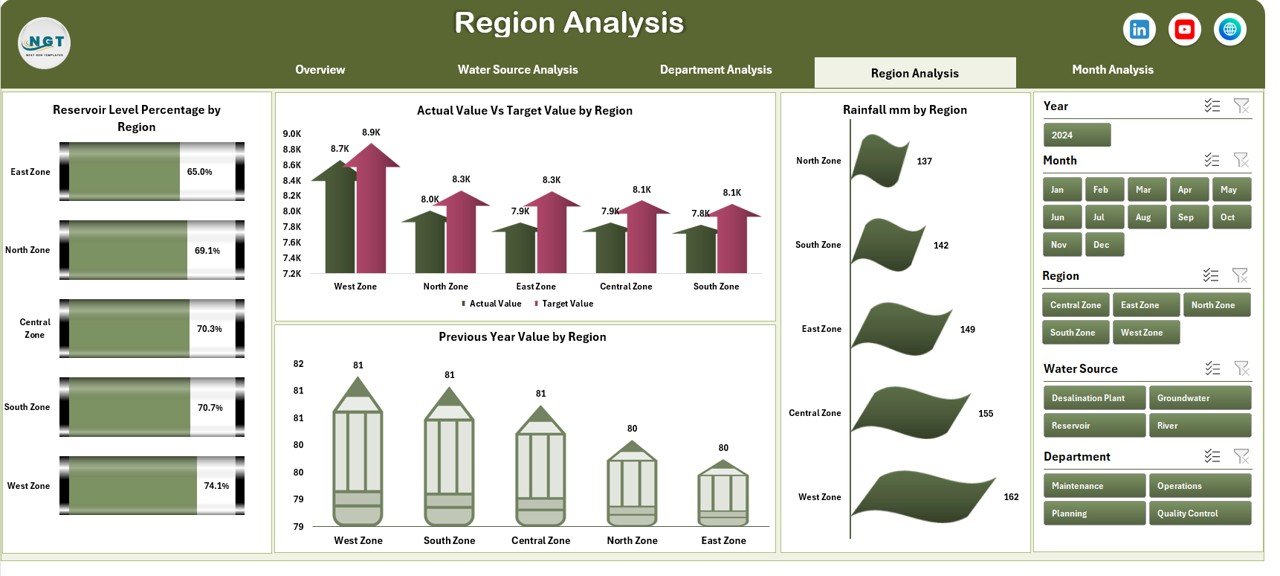
4️⃣ Region Analysis – Geographic Comparison
Water performance varies by location.
Analyze:
-
Reservoir Level % by Region
-
Treatment Cost by Region
-
Actual vs Target Comparison
-
Previous Year Comparison
Allocate budgets and resources strategically.
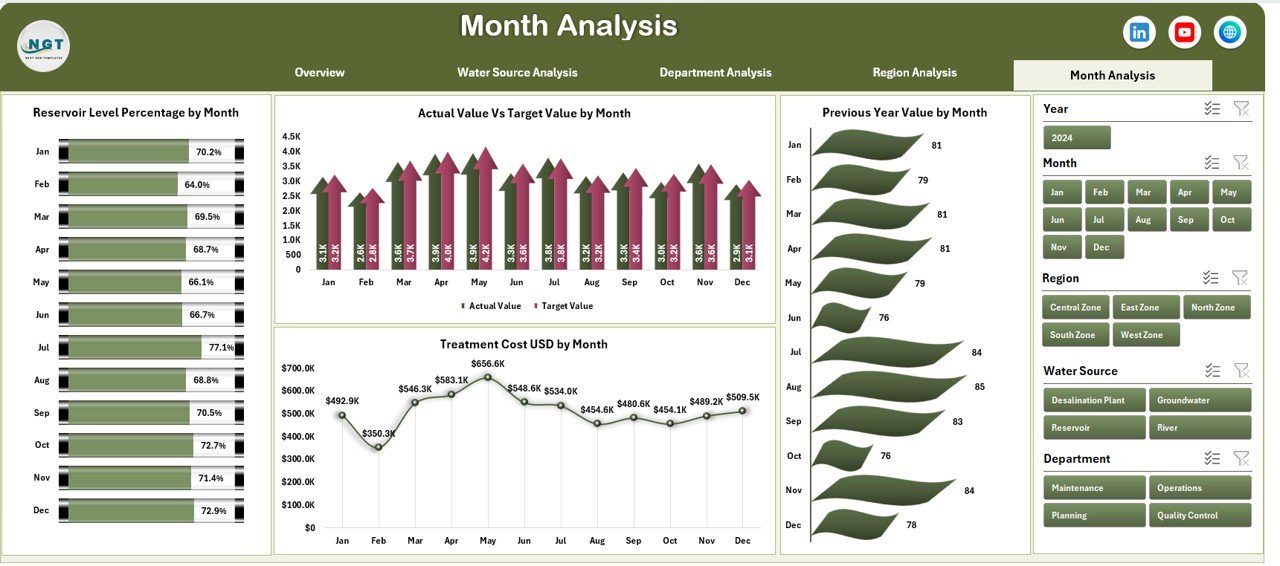
5️⃣ Month Analysis – Seasonal Trends
Seasonality impacts water availability.
Monitor:
-
Reservoir Level % by Month
-
Rainfall (mm) by Month
-
Treatment Cost Trends
-
Actual vs Target Monthly
Forecast shortages and plan storage efficiently.
🛠 How to Use the Water Resource Management Dashboard in Excel
Using this dashboard is simple:
1️⃣ Enter raw data in the Data Sheet
2️⃣ Maintain master lists in the Support Sheet
3️⃣ Refresh pivot tables
4️⃣ Use slicers to filter analysis
No advanced Excel skills required. The structure is ready — you only update data.
👥 Who Can Benefit from This Water Resource Management Dashboard in Excel
🏛 Municipal Corporations
🏭 Manufacturing Plants
🌾 Agriculture Authorities
🌿 Environmental Agencies
🚰 Water Utilities
📊 Sustainability Managers
If your organization manages water consumption, cost, or conservation targets — this dashboard is designed for you.
By using this dashboard, you:
✔ Monitor water performance in real time
✔ Track treatment costs efficiently
✔ Compare regions and departments easily
✔ Identify target achievement gaps
✔ Detect seasonal trends early
✔ Improve sustainability planning
✔ Strengthen compliance monitoring
Instead of relying on manual reports, you gain a centralized, visual, and structured system.
This is not just an Excel file. It is a complete water governance performance solution.
If you want better control, improved cost management, and smarter sustainability decisions — this dashboard gives you the structure you need.