Running a vocational school comes with unique challenges—managing tuition fees, scholarships, academic scores, attendance, satisfaction levels, placement success, campus-wise output, and month-wise trends. When this data stays scattered across many Excel files or manual logs, decision-making becomes slow and unclear.
That’s why we created the Vocational Schools Dashboard in Power BI, a fully interactive, ready-to-use analytics solution that transforms complex vocational school data into simple, visual, and actionable insights. Whether you manage multiple programs, multiple campuses, or multiple regions—this dashboard helps you monitor everything in one place with unmatched clarity.
Built using powerful Power BI visuals, slicers, filters, and automated summaries, this dashboard becomes your school’s central control system for academic excellence, financial performance, and student success.
✨ Key Features of the Vocational Schools Dashboard in Power BI
This dashboard delivers all essential analytics in a clean, interactive, and easy-to-use design.
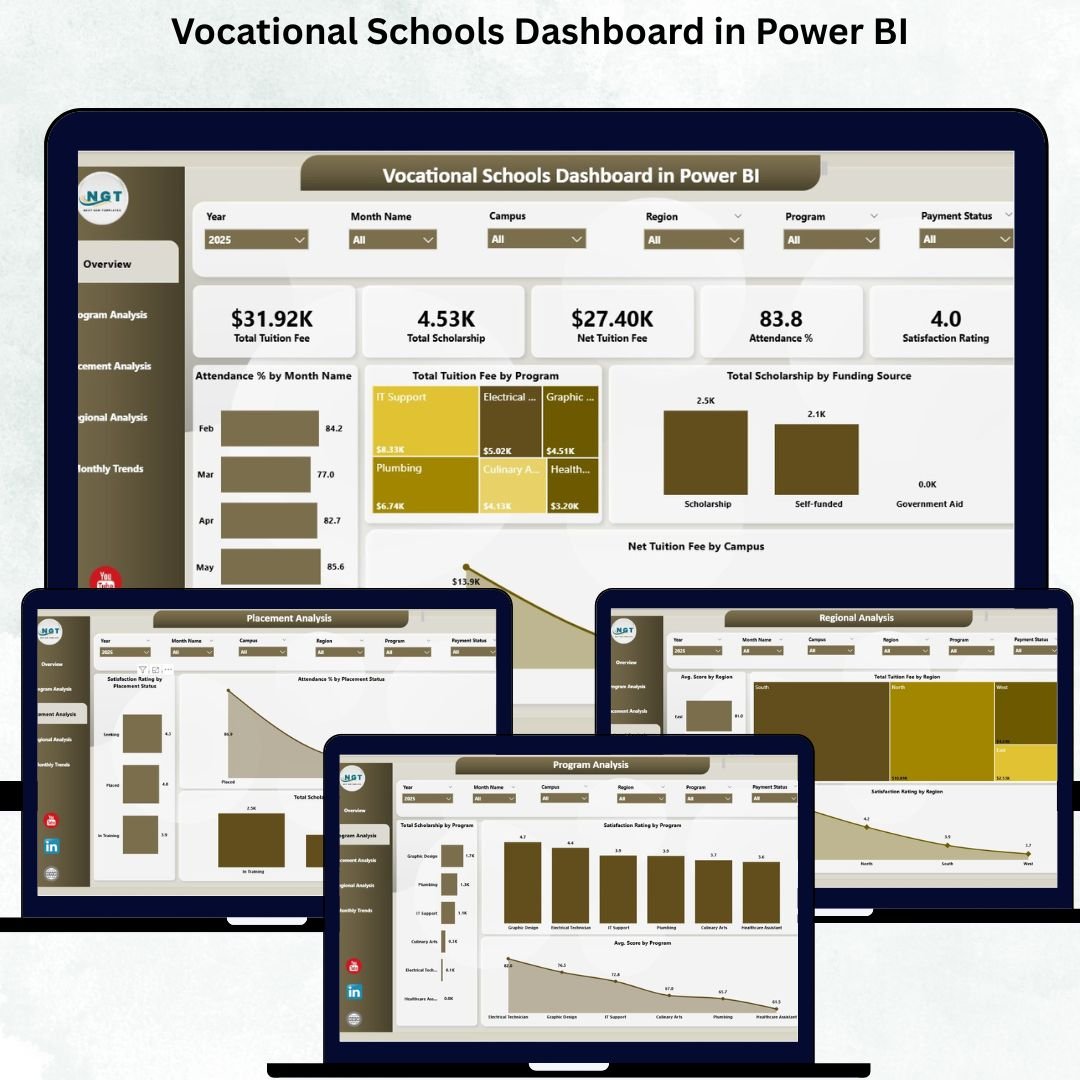
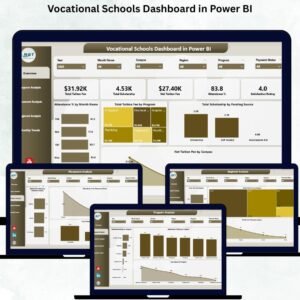
📌 1. Complete Overview Page
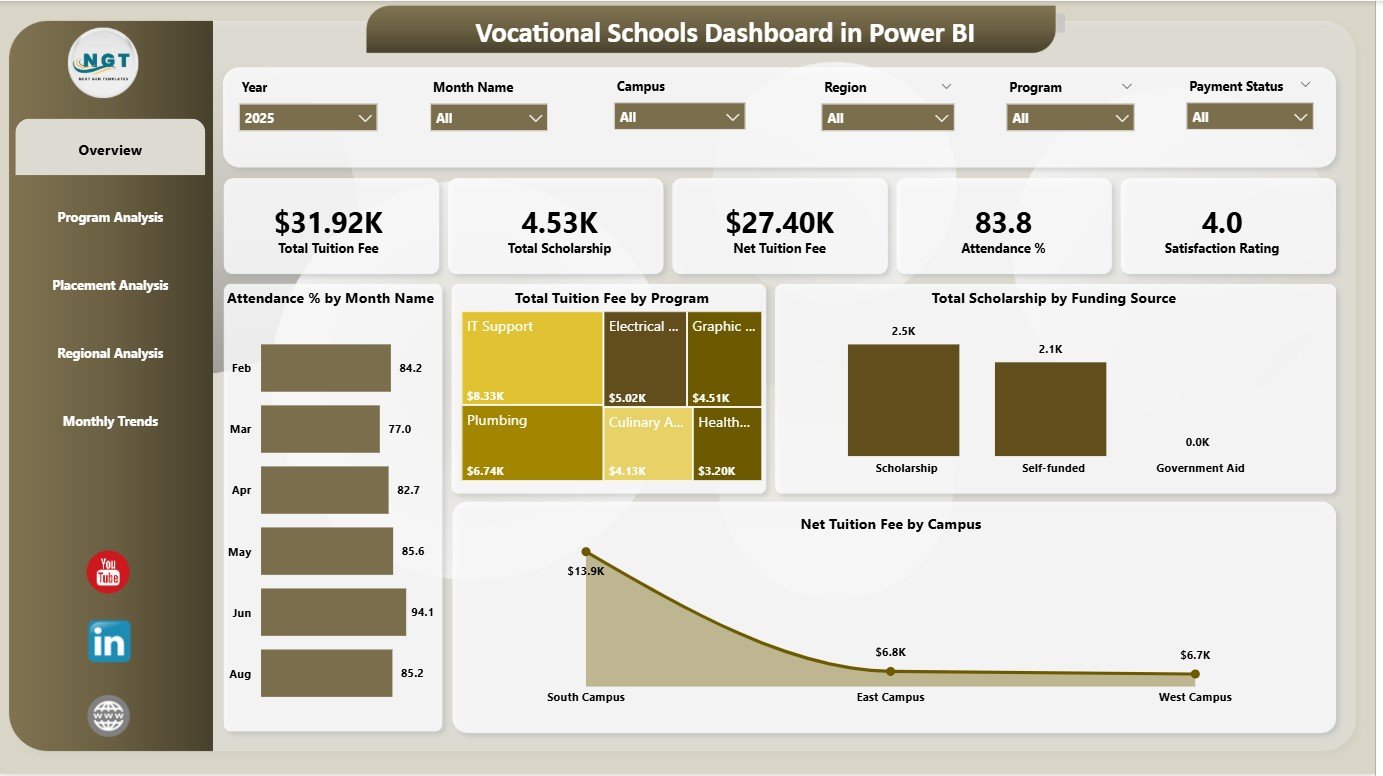
• Six critical KPI cards show Total Tuition Fee, Total Scholarship, Net Tuition Fee, Average Score, Attendance %, and Student Satisfaction.
• Four dynamic charts visualize program-wise tuition, scholarship distribution, campus income, and attendance by month.
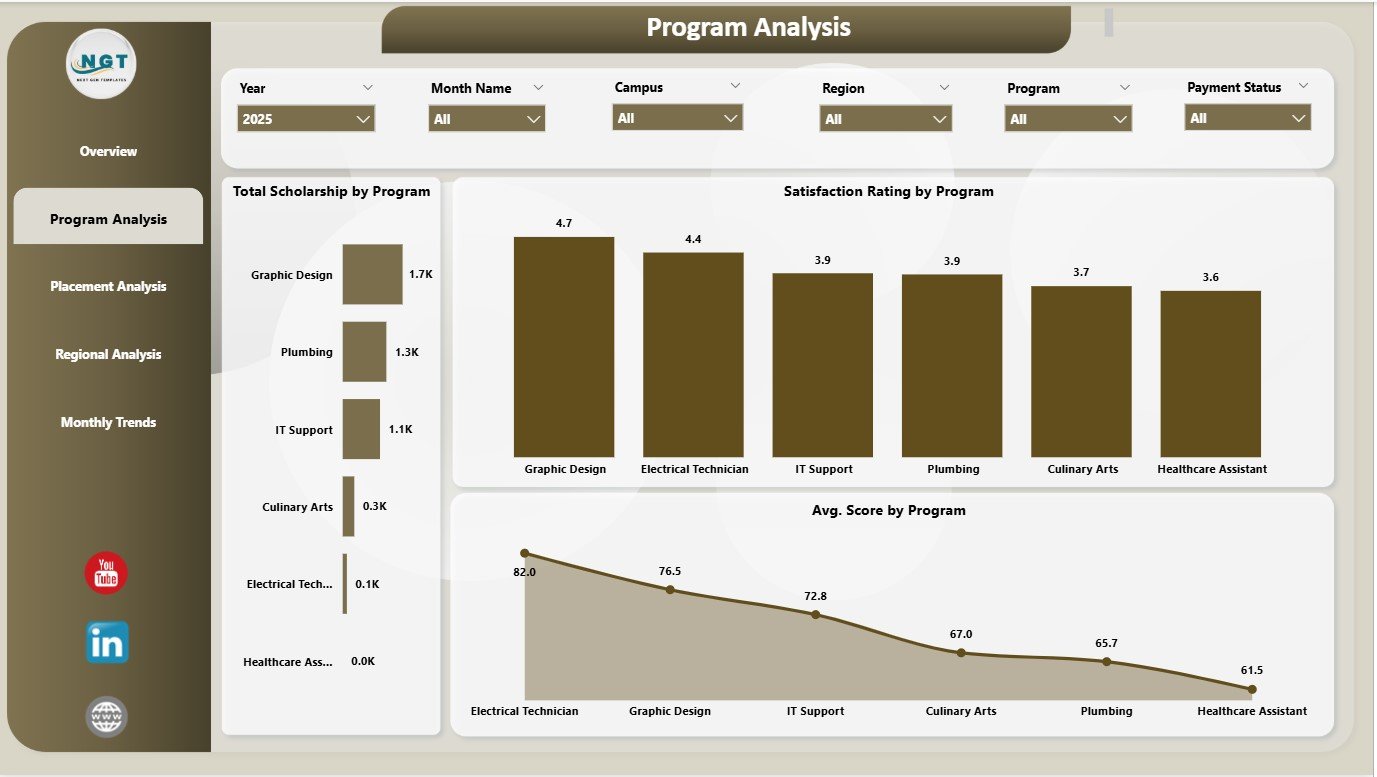
📌 2. Program Analysis Page
• Check satisfaction, scholarships, and average scores by program.
• Identify your strongest and weakest training programs instantly.
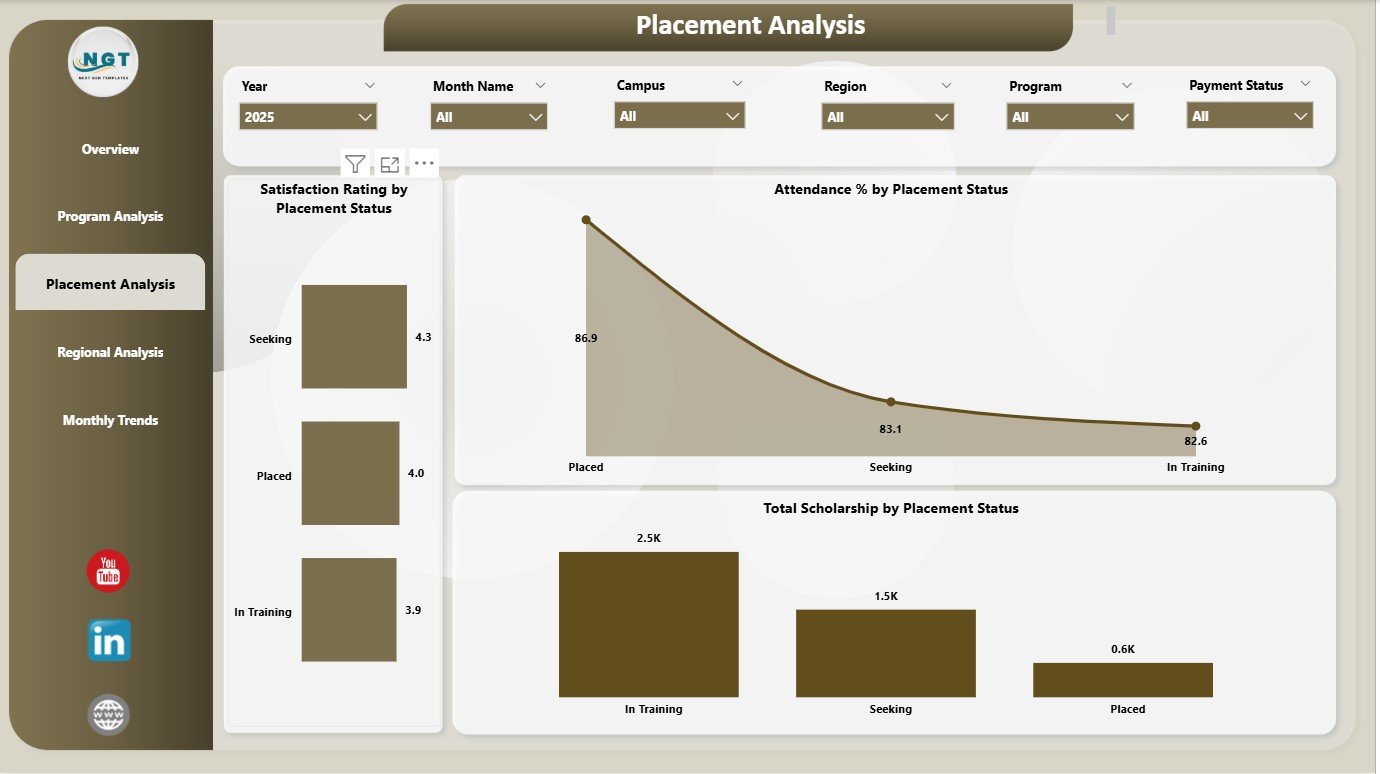
📌 3. Placement Analysis Page
• Study placement success and compare it with attendance, satisfaction, and scholarship data.
• Understand what drives employability and academic outcomes.
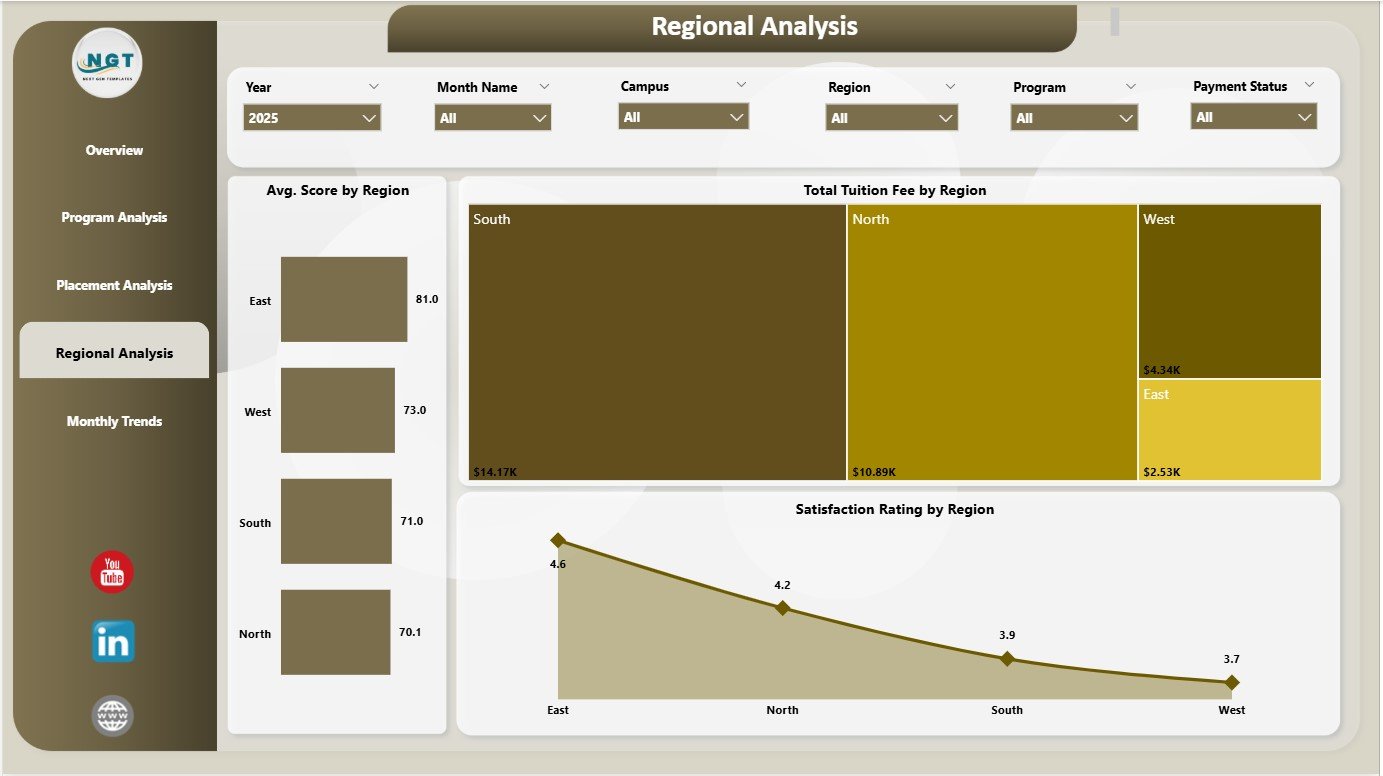
📌 4. Regional Analysis Page
• Compare tuition, scores, and satisfaction across regions and campuses.
• Perfect for multi-campus institutions.
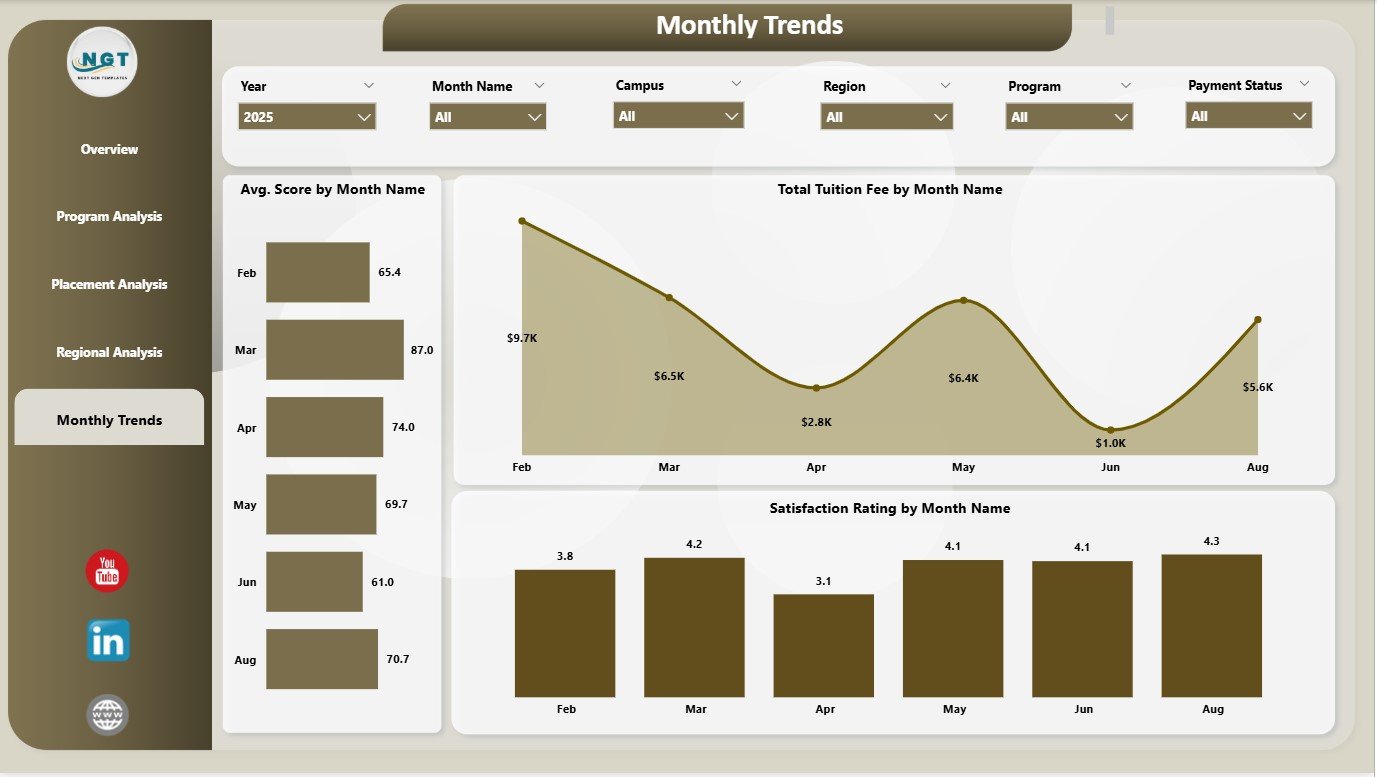
📌 5. Monthly Trends Page
• Track tuition fee trends, academic performance, and satisfaction across months.
• Ideal for admissions planning, exams, and performance reviews.
📦 What’s Inside the Vocational Schools Dashboard in Power BI
When you download this digital product, you receive:
✔ Fully Designed Power BI Dashboard (.PBIX file)
With all visuals, slicers, trend charts, and filters ready to use.
✔ Linked Excel Data Source Template
Includes structured sheets for tuition, scholarships, placement, satisfaction, and attendance.
✔ Pre-built Measures & Calculations
All DAX calculations, formulas, and logic are already configured.
✔ Clean, Professional Layout
Ideal for presentations, board meetings, and internal reviews.
✔ Editable and Customizable Structure
Add new KPIs, change visuals, extend programs, or integrate new datasets easily.
Everything is plug-and-play — simply update the Excel file and refresh Power BI.
🛠️ How to Use the Vocational Schools Dashboard in Power BI
Using this dashboard is extremely simple — even for non-technical users.
🔹 Step 1: Open the Excel Data File
Enter your monthly values such as tuition fee, attendance, scores, scholarship data, and placement numbers.
🔹 Step 2: Refresh Power BI
Open the PBIX file and click Refresh — all visuals update instantly.
🔹 Step 3: Use Slicers & Filters
Filter by program, month, region, category, or campus to get deep insights.
🔹 Step 4: Present Insights
Use the dashboard in meetings, presentations, and academic reviews.
🔹 Step 5: Customize as You Grow
Add more KPIs, new programs, new campuses, or new metrics anytime.
🎯 Who Can Benefit from This Vocational Schools Dashboard in Power BI
This dashboard is designed for all types of vocational and skill-development institutions:
👩🏫 Academic Heads & Principals
Monitor academic performance and improve learning outcomes.
📊 Directors & Administrators
Review tuition income, scholarships, and financial health.
🎓 Placement Officers
Track employability, placement success, and influencing factors.
👨🏫 Program Coordinators
Improve program quality using data-driven insights.
🏫 Multi-Campus Institutions
Compare performance across regions and campuses.
📉 Operations & Strategy Teams
Identify weak areas and plan improvements proactively.


Reviews
There are no reviews yet.