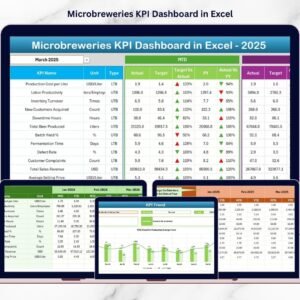
Video production has become one of the most powerful communication tools in today’s digital world. Businesses, marketing teams, content creators, and media companies produce videos for YouTube, social media marketing, online learning, advertising campaigns, and corporate communication. Video Production KPI Scorecard in Excel However, managing video production efficiently requires structured planning, performance monitoring, and KPI tracking.
Video production involves multiple stages such as script writing, filming, editing, publishing, and distribution. When teams work on multiple projects simultaneously, tracking productivity and measuring performance becomes challenging. Without a proper KPI monitoring system, managers struggle to evaluate production timelines, monitor quality, and compare performance against targets.
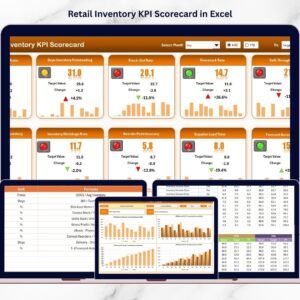
Video Production KPI Scorecard in Excel the Video Production KPI Scorecard in Excel provides a powerful and ready-to-use solution that helps video production teams track important performance metrics in one centralized dashboard. This Excel-based scorecard converts production data into structured KPI tables, visual indicators, and performance trends, enabling managers to monitor results and make data-driven decisions.
Because this scorecard includes dynamic KPI tracking, automated comparisons, and visual performance indicators, teams can easily identify production bottlenecks, monitor progress, and improve productivity. As a result, organizations can maintain consistent content quality and deliver projects more efficiently.
🚀 Key Features of Video Production KPI Scorecard in Excel
📊 Centralized KPI Monitoring Dashboard
Track all video production KPIs in one structured scorecard that provides a complete performance overview.
📅 Dynamic Month Selection
Select any month from the dropdown menu and instantly analyze performance for that specific period.
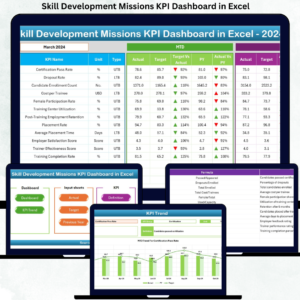
📈 MTD and YTD Performance Tracking
Monitor Month-to-Date (MTD) and Year-to-Date (YTD) KPI performance to evaluate production efficiency.
🎯 Target vs Actual Performance Comparison
Compare actual production results with defined targets to measure productivity and goal achievement.
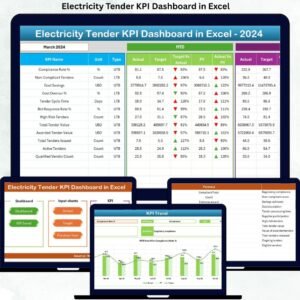
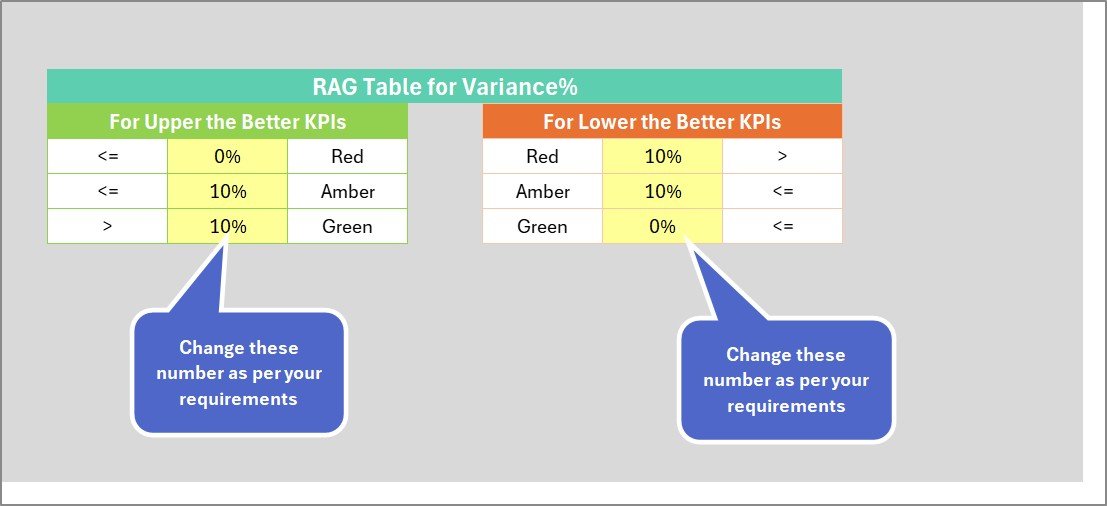
📉 Performance Status Indicators
Color-coded visual indicators highlight KPI performance status using conditional formatting.
📊 KPI Trend Analysis Charts
Trend charts display KPI performance over time, helping teams analyze productivity patterns.
🧾 Structured KPI Information Management
Store KPI details such as KPI name, group, unit, formula, and definition in a centralized database.
⚡ Automated Scorecard Calculations
Once data is entered, the dashboard automatically updates all KPI calculations and visual indicators.
📂 Easy Data Entry System
A dedicated data input sheet allows users to quickly enter and update KPI values.
📊 Professional Excel Scorecard Design
Clean layouts and clear visual indicators make performance monitoring simple and effective.
📦 What’s Inside the Video Production KPI Scorecard
The template contains four structured worksheets designed to manage KPI data and analyze video production performance efficiently.
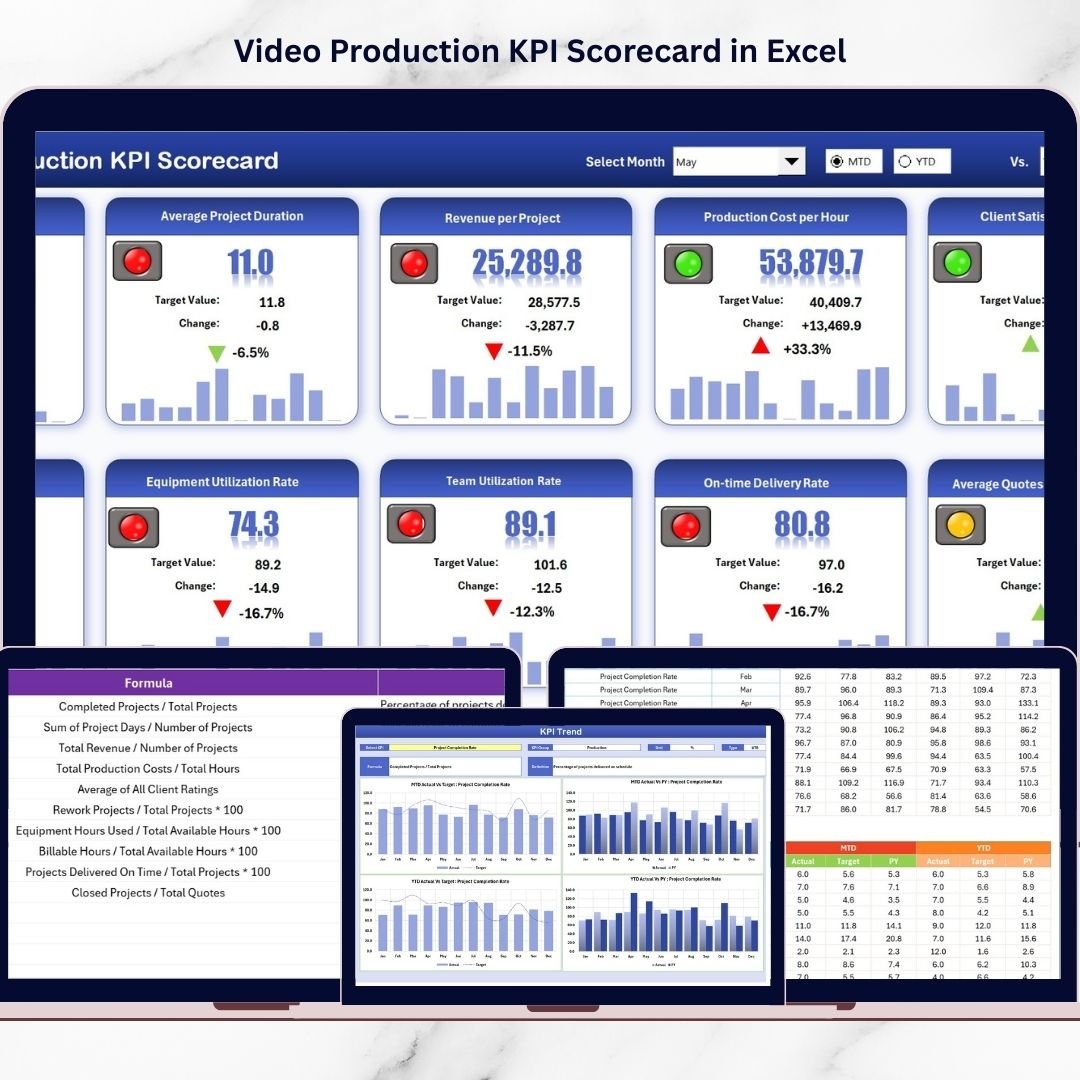
1️⃣ Scorecard Sheet – Main KPI Dashboard
The Scorecard Sheet serves as the primary dashboard where users monitor KPI performance.
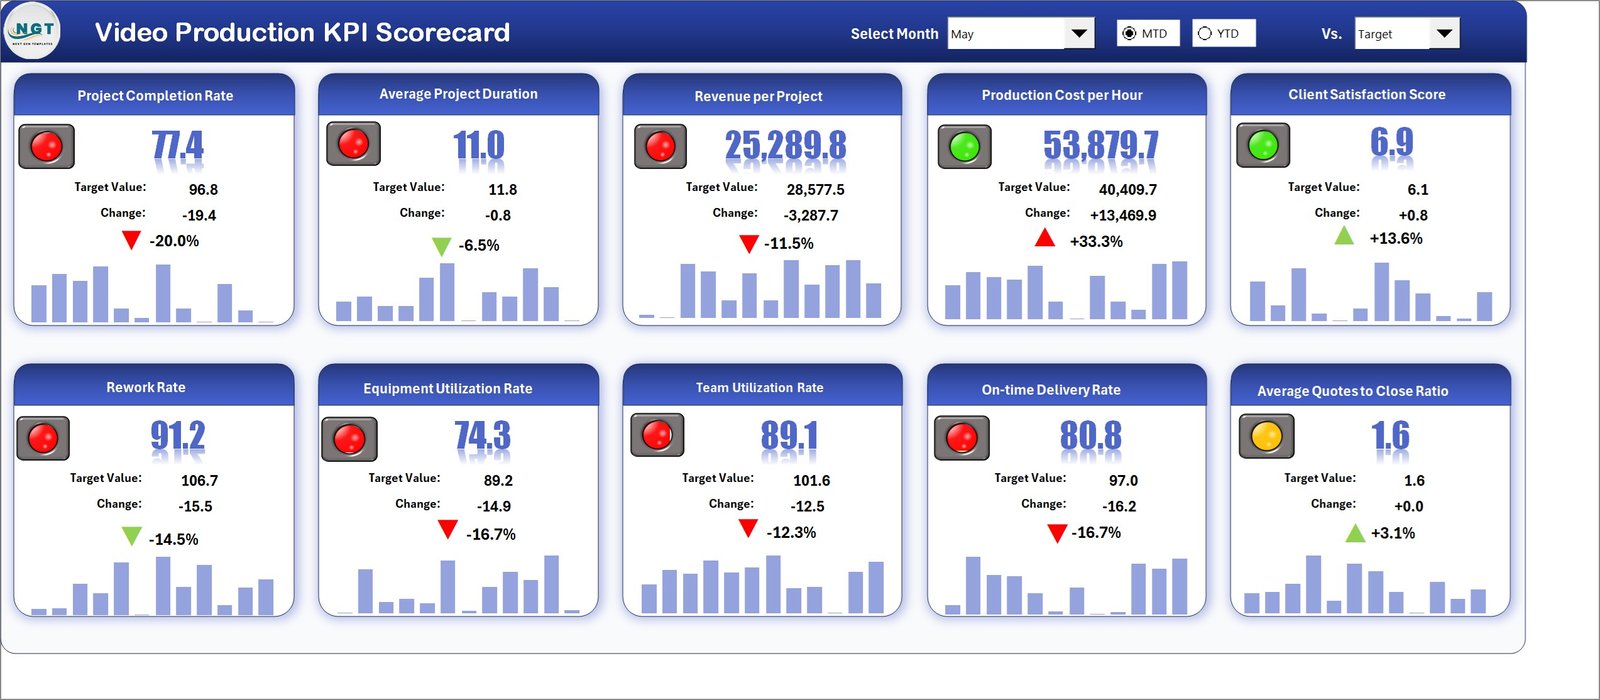
This sheet provides a comprehensive overview of production KPIs.
Users can customize performance analysis using dropdown selections such as:
-
Month
-
MTD (Month-to-Date)
-
YTD (Year-to-Date)
Once a selection is made, the scorecard automatically updates KPI values.
Displayed KPI information includes:
-
Actual KPI values
-
Target KPI values
-
Performance comparison results
-
Visual status indicators
These insights allow managers to quickly evaluate whether production targets are being achieved.
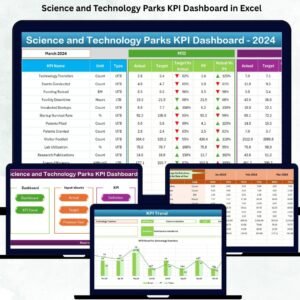
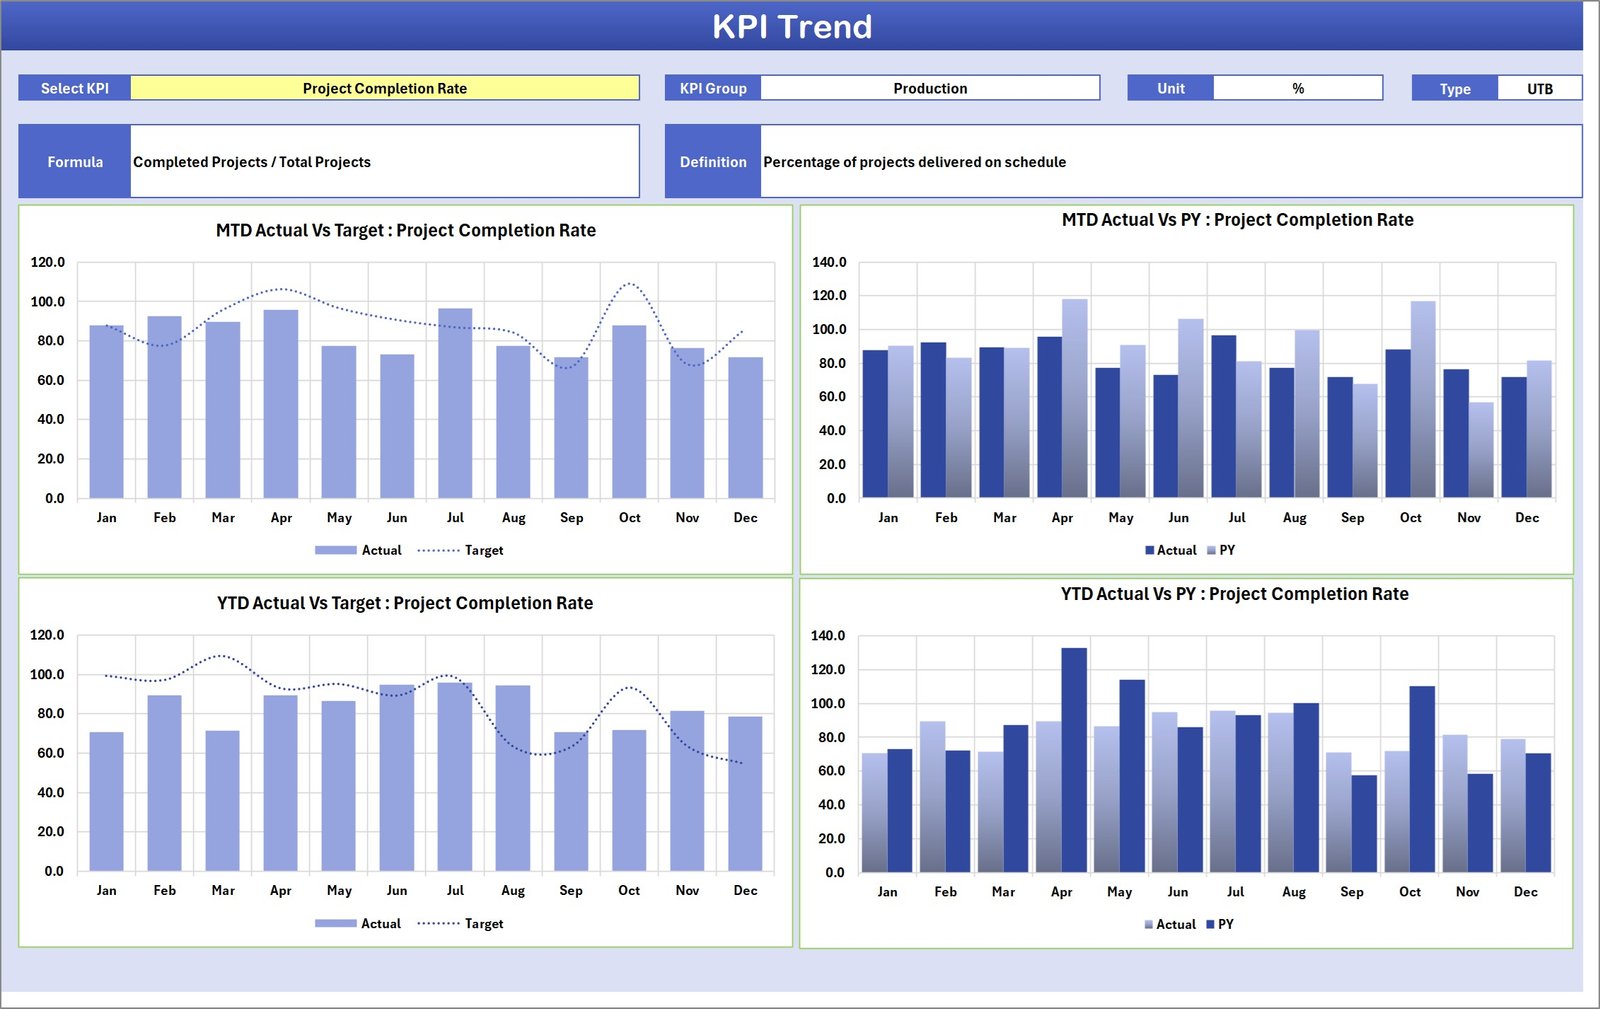
2️⃣ KPI Trend Sheet – KPI Performance Trends
The KPI Trend Sheet provides detailed analysis for individual KPIs.
Users can select a KPI from the dropdown menu in cell C3.
The sheet displays detailed KPI information including:
-
KPI Group
-
KPI Unit
-
KPI Type
-
KPI Formula
-
KPI Definition
Additionally, the sheet contains MTD and YTD trend charts that display:
-
Actual performance values
-
Target values
-
Previous year performance
These visualizations help managers analyze productivity trends and performance changes over time.
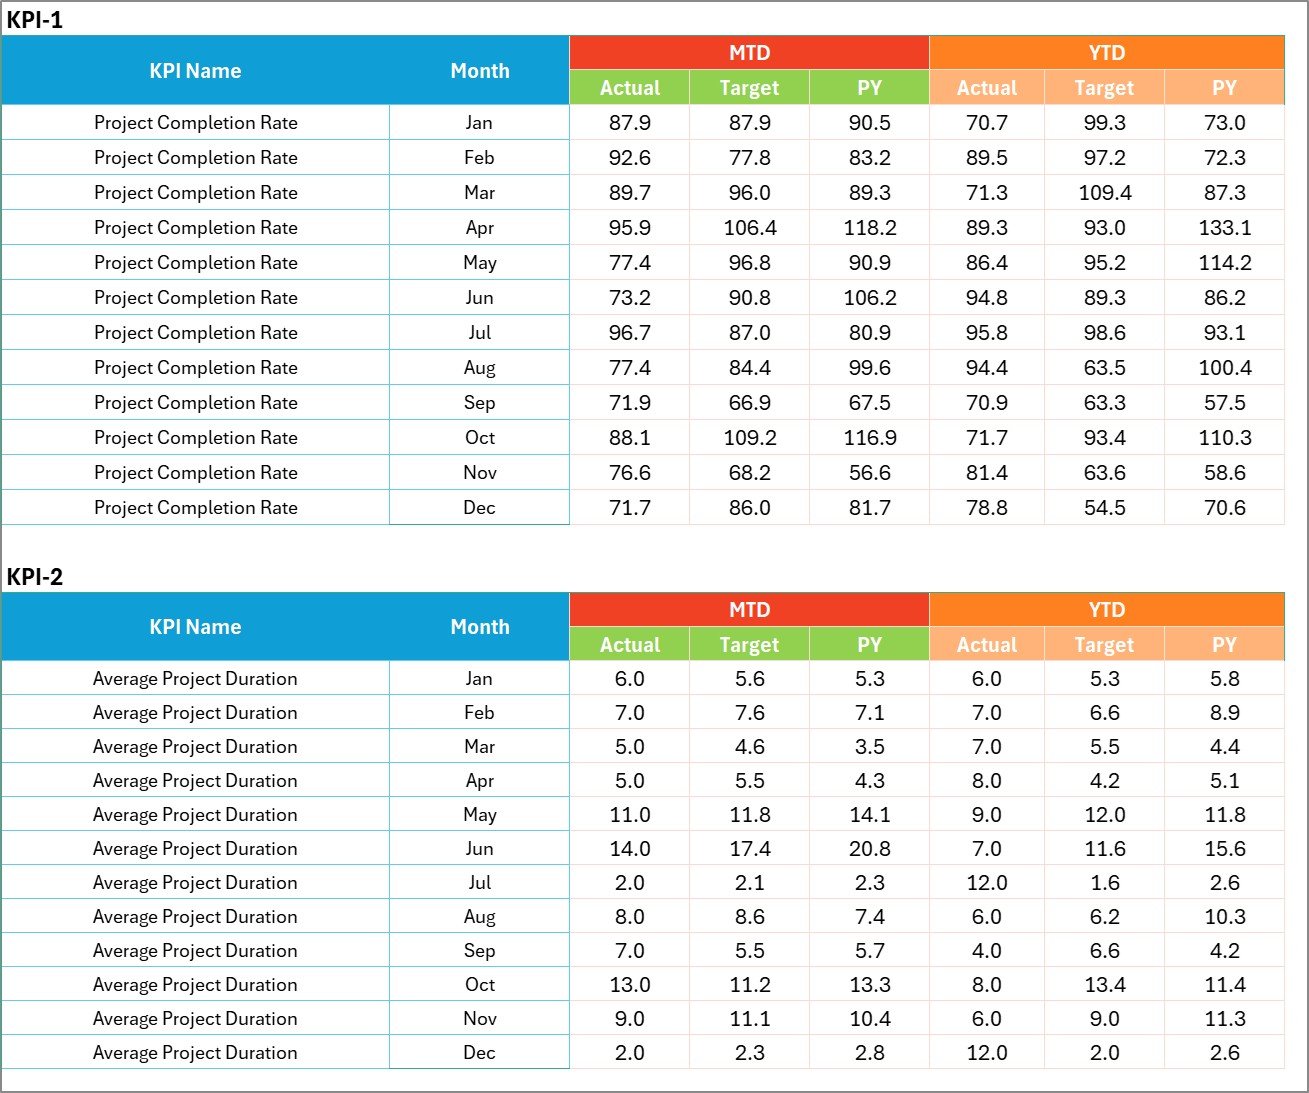
3️⃣ Input Data Sheet – Data Entry Section
The Input Data Sheet is used for entering KPI performance data.
Users can input:
-
Actual KPI values
-
Target values
-
Additional performance metrics
Once the data is entered, the scorecard automatically updates all charts and KPI indicators.
This automation ensures that the dashboard always reflects the latest production performance.
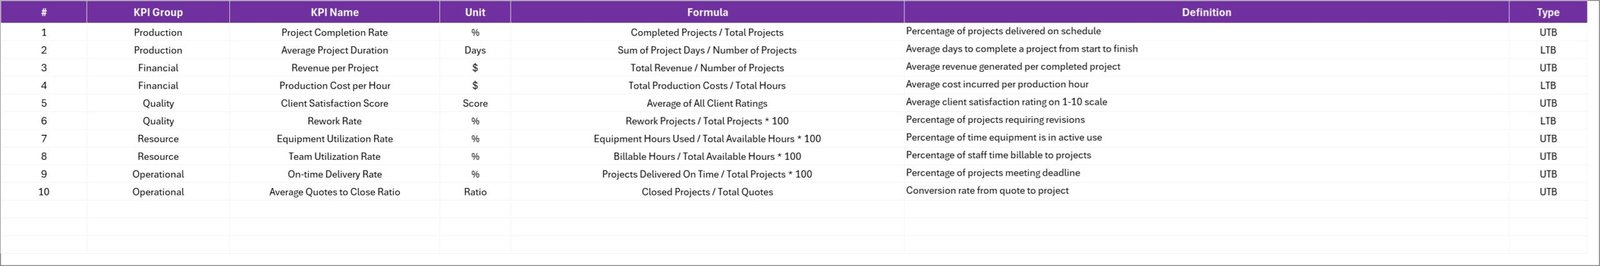
4️⃣ KPI Definition Sheet – KPI Information Database
The KPI Definition Sheet stores detailed information about each KPI.
Users can define:
-
KPI Name
-
KPI Group
-
Unit of Measurement
-
KPI Formula
-
KPI Definition
This structured system ensures consistent KPI tracking across the organization.
🛠 How to Use the Video Production KPI Scorecard
Using this Excel template is simple and requires minimal setup.
1️⃣ Define important video production KPIs such as production time, completion rate, and publishing frequency.
2️⃣ Enter KPI definitions in the KPI Definition Sheet.
3️⃣ Enter KPI values and targets in the Input Data Sheet.
4️⃣ Select the month and view MTD or YTD performance on the Scorecard Dashboard.
5️⃣ Analyze KPI trends using the KPI Trend Sheet.
With this system, video production teams can monitor productivity and improve workflows efficiently.
👨💻 Who Can Benefit from This Video Production KPI Scorecard?
This scorecard is useful for professionals involved in content creation and media production.
🎬 Video Production Managers – Monitor production efficiency and team productivity.
📊 Marketing Teams – Track content production metrics and campaign performance.
🎥 Content Creators and YouTubers – Analyze video production performance and workflow efficiency.
🏢 Media Production Companies – Monitor production KPIs and optimize project timelines.
📈 Digital Marketing Agencies – Track video production output and content performance.
🚀 Online Course Creators – Monitor video content creation and publishing schedules.
Click here to read the Detailed blog post
Visit our YouTube channel to learn step-by-step video tutorials
👉 YouTube Channel: https://youtube.com/@PKAnExcelExpert