


Vendor Management KPI Dashboard in Excel Every business depends on its vendors. When suppliers deliver on time, maintain quality, follow compliance standards, and communicate effectively, the entire procurement cycle becomes smooth and efficient. Vendor Management KPI Dashboard in Excel but when delays, defects, price changes, or communication issues appear, business operations suffer. That’s why procurement teams need a structured, clear, and reliable way to monitor vendor performance every month.
The Vendor Management KPI Dashboard in Excel is the perfect solution.
It transforms raw vendor data into meaningful insights, helping procurement teams make faster and smarter decisions. With built-in MTD & YTD performance tracking, trend charts, KPI definitions, and clean visuals, this dashboard becomes an essential tool for evaluating supplier capabilities. You simply update the data sheets, and Excel automatically refreshes all insights—no formulas, no complex setup, and no technical skills required.
This dashboard is ideal for procurement teams, supply chain departments, vendor coordinators, quality managers, and finance leaders who want real-time clarity, accurate reporting, and transparent supplier evaluation.
⭐ Key Features of Vendor Management KPI Dashboard in Excel
💼 A Complete Performance Monitoring System
Track KPIs like on-time delivery, quality score, cost variance, compliance, responsiveness, PO fulfillment, and issue resolution.
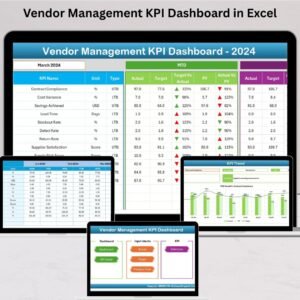
📊 Dashboard Page for MTD & YTD Insights
View:
-
Actual
-
Target
-
Previous Year
-
Target vs Actual (%)
-
CY vs PY (%)
All in one screen with green ▲ and red ▼ arrows for instant evaluation.
⏳ Automatic Monthly & Yearly Calculations
No manual formulas needed—Excel updates everything as soon as data is entered.
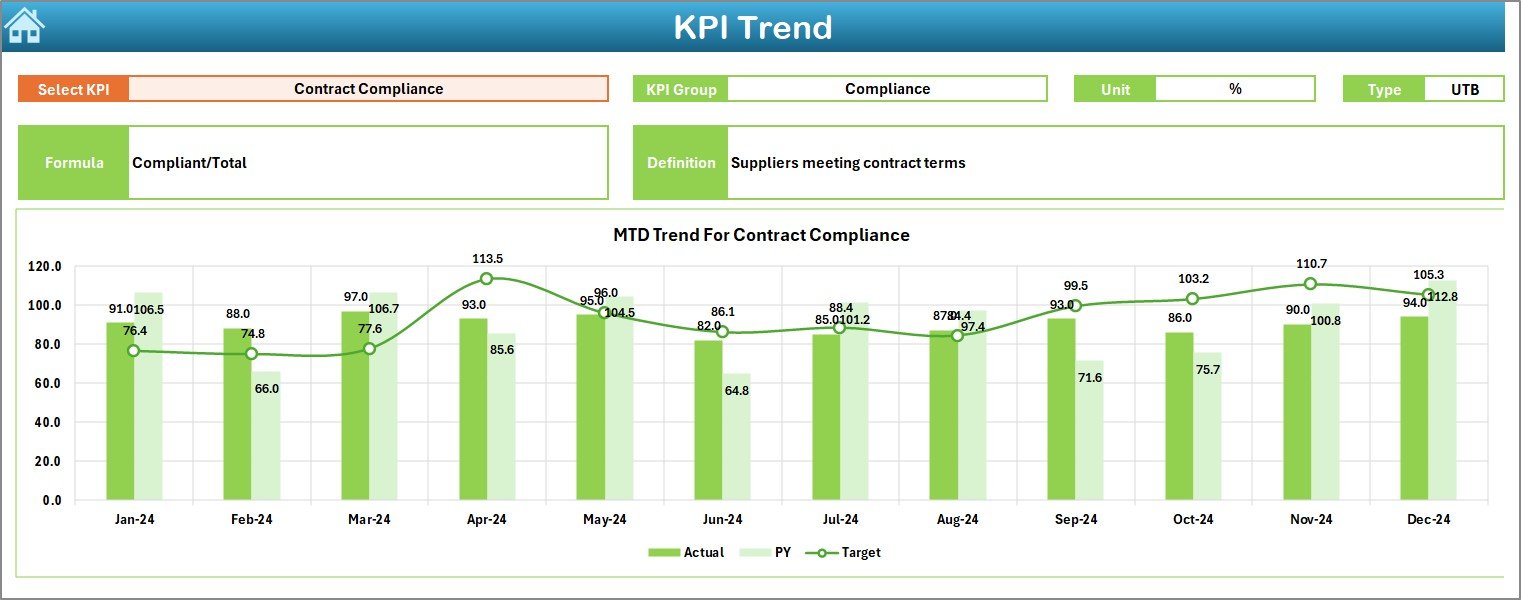
📈 KPI Trend Page
Study MTD and YTD performance patterns using combo charts showing Actual, Target, and Previous Year trends.
🧾 KPI Definition Sheet
Understand how each KPI is calculated with clear definitions and formulas.
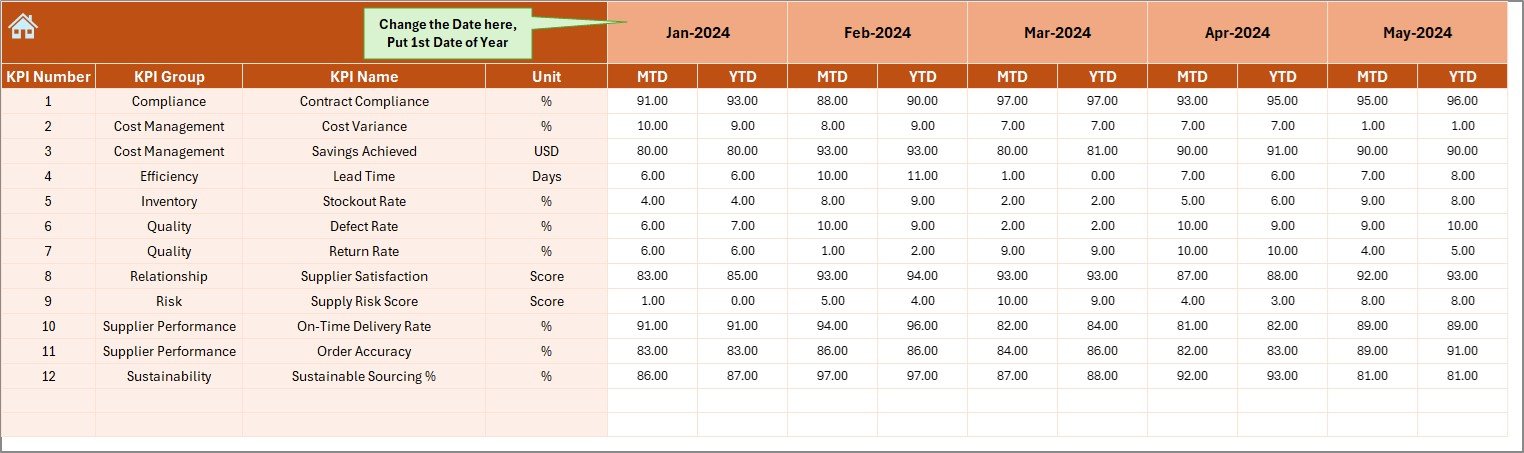
📁 Structured Input Sheets
Separate sheets for Actuals, Targets, and Previous Year ensure clean and organized data entry.
🏠 Easy Home Navigation Panel
Move across sheets using simple buttons—perfect for beginners and non-technical users.
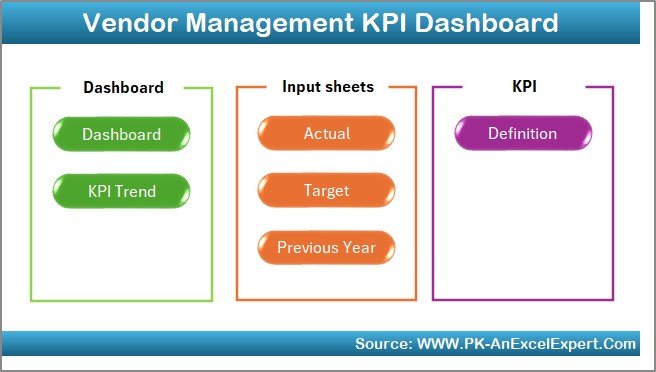
📦 What’s Inside the Vendor Management KPI Dashboard
💡 1. Interactive Dashboard Sheet
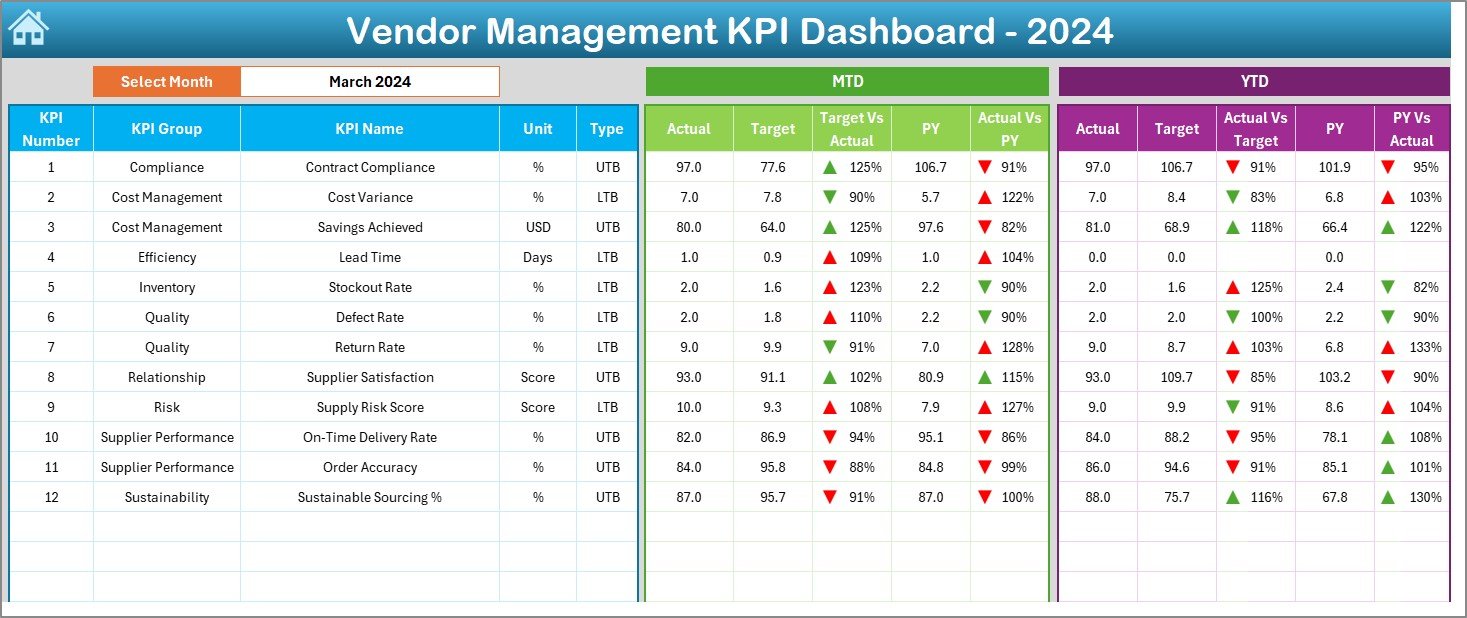
Displays all MTD/YTD KPIs with performance indicators and comparisons in one place.
📈 2. KPI Trend Sheet
View long-term patterns and analyze vendor improvement or decline.
📘 3. Actual Numbers Input Sheet
Enter current-year actual performance values easily.
🎯 4. Target Sheet
Record monthly and yearly target values for accurate performance comparison.
📊 5. Previous Year Data Sheet
Track YoY performance improvement using previous-year MTD and YTD numbers.
🧾 6. KPI Definition Sheet
Includes KPI names, formulas, units, and types (UTB/LTB) for clear understanding.
🏠 7. Home Navigation Menu
A clean dashboard-style menu for quick access to all worksheets.
🧭 How to Use the Vendor Management KPI Dashboard
✅ Step 1: Enter KPI Definitions
Update KPI names, units, formulas, and types in the KPI Definition Sheet.
✅ Step 2: Add Previous Year Numbers
Enter last year’s actual performance for each vendor KPI.
✅ Step 3: Fill Actual Values
Update the Actual Numbers Input Sheet with MTD and YTD values every month.
✅ Step 4: Enter Targets
Add MTD and YTD targets for each KPI in the Target Sheet.
✅ Step 5: View Dashboard Insights
The Dashboard updates automatically with:
-
KPI percentages
-
Target achievements
-
YoY comparisons
-
Up/down performance icons
✅ Step 6: Analyze KPI Trends
Use the KPI Trend Sheet to study MTD/YTD patterns across months.
✅ Step 7: Share and Review
Use the dashboard for:
-
Supplier evaluation
-
Monthly procurement reviews
-
Vendor negotiations
-
Internal performance reporting
👥 Who Can Benefit from This Vendor Management Dashboard
🛒 Procurement Teams
Track supplier reliability and cost performance with ease.
🔧 Supply Chain Departments
Improve vendor coordination and reduce delays.
🏢 Business Leaders
Make strategic decisions based on accurate vendor insights.
📦 Vendor Relationship Managers
Improve communication and track performance consistently.
🧪 Quality Control Teams
Monitor defect rates, compliance levels, and quality KPIs.
📊 Analysts & Data Reviewers
Use visuals to present vendor performance clearly.
📘 Click here to read the detailed blog post
▶ Visit our YouTube channel to learn step-by-step video tutorials
Watch the step-by-step video tutorial:


Reviews
There are no reviews yet.