


Managing vendors efficiently is no longer optional for growing organizations. As businesses expand, they work with multiple vendors across regions, categories, contracts, and account managers. However, when vendor data remains scattered across Excel files, ERP systems, and emails, vendor risks increase, costs go out of control, and decision-making slows down. That is exactly where the Vendor Management Dashboard in Power BI becomes a game-changing solution.
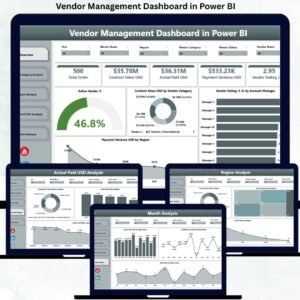
The Vendor Management Dashboard in Power BI is a ready-to-use, interactive analytics solution designed to monitor vendor performance, contracts, payments, and risks from one centralized dashboard. Instead of manually reviewing spreadsheets or static reports, this dashboard transforms complex vendor data into clear KPIs, visual trends, and actionable insights.
Built on Microsoft Power BI, this dashboard allows procurement, finance, and leadership teams to track active vendors, contract values, payment variance, vendor ratings, and monthly trends in real time. With dynamic slicers and page-wise analysis, users can easily compare vendors by category, region, and account manager.
Most importantly, this dashboard helps organizations move from reactive vendor handling to proactive vendor governance. Teams can identify underperforming vendors early, control payment leakage, reduce regional risks, and strengthen vendor negotiations using data—not assumptions.
Whether you manage a few vendors or hundreds across geographies, this dashboard delivers clarity, control, and confidence in vendor management.
⭐ Key Features of Vendor Management Dashboard in Power BI
📊 Centralized Vendor Performance Tracking – One dashboard for all vendor KPIs
🤝 Vendor Rating Analysis – Measure quality and reliability
💰 Contract Value & Payment Visibility – Improve cost control
📉 Payment Variance Tracking – Identify mismatches early
🌍 Region-Wise Vendor Insights – Reduce geographic risk
🧾 Category-Wise Vendor Analysis – Smarter sourcing decisions
📈 Monthly Performance Trends – Better forecasting
🎯 Interactive Slicers – Drill down instantly
📦 What’s Inside the Vendor Management Dashboard
📌 Overview Page

The Overview Page acts as the executive command center.
It includes:
-
Interactive slicers (time, region, category)
-
KPI cards such as Active Vendor % and Total Contract Value USD
-
Visuals like:
-
Contract Value USD by Vendor Category
-
Vendor Rating by Account Manager
-
Payment Variance USD by Region
-
This page helps leadership assess overall vendor health within seconds.
🧩 Vendor Category Analysis Page
This page evaluates vendors by category.
It shows:
-
Payment Variance USD by Vendor Category
-
Vendor Rating by Vendor Category
-
Average Contractual Lead Time Days
As a result, procurement teams optimize category-wise sourcing and negotiations.
🌍 Region Analysis Page
The Region Analysis Page focuses on geographic performance.
It highlights:
-
Contract Value USD by Region
-
Vendor Rating by Region
-
Active Vendors by Region
Therefore, organizations balance regional dependency and reduce risk exposure.
💳 Actual Paid USD Analysis Page
This page tracks vendor payments and cash flow.
It includes:
-
Actual Paid USD by Vendor Category
-
Actual Paid USD by Region
-
Actual Paid USD by Account Manager
As a result, finance teams identify payment leakage and improve working-capital control.
📈 Monthly Trends Page
The Monthly Trends Page tracks vendor performance over time.
It shows:
-
Actual Paid USD by Month
-
Contract Value USD by Month
-
Total Orders by Month
This page supports trend analysis, forecasting, and long-term vendor planning.
🛠️ How to Use the Vendor Management Dashboard
1️⃣ Connect vendor data from Excel or ERP
2️⃣ Refresh the Power BI dataset
3️⃣ Apply slicers for focused analysis
4️⃣ Review vendor ratings and payment variance
5️⃣ Identify risks and improvement areas
6️⃣ Take data-driven vendor actions
👥 Who Can Benefit from This Dashboard
-
Procurement Managers
-
Vendor Relationship Managers
-
Finance & Accounts Teams
-
Supply Chain Teams
-
Regional Heads
-
Senior Leadership
Any organization seeking better vendor control and cost transparency will benefit.
### 📘 Click here to read the Detailed blog post
📺 Visit our YouTube channel to learn step-by-step video tutorials
👉 https://youtube.com/@PKAnExcelExpert


Reviews
There are no reviews yet.