

Managing vacation rentals is no longer simple. Competition grows daily. Guest expectations rise constantly. Pricing changes every week. If you still rely on scattered Excel files, you are already behind.
That is exactly why the Vacation Rentals KPI Dashboard in Power BI becomes your ultimate performance control system.
This ready-to-use, professionally designed dashboard transforms raw rental data into powerful, interactive, and decision-driven insights. Instead of manually calculating occupancy or revenue trends, you can instantly monitor MTD, YTD, Target vs Actual, and Previous Year comparisons in one centralized Power BI solution.
Whether you manage one Airbnb property or an entire rental portfolio, this dashboard gives you clarity, speed, and control.
🚀 Key Features of Vacation Rentals KPI Dashboard in Power BI
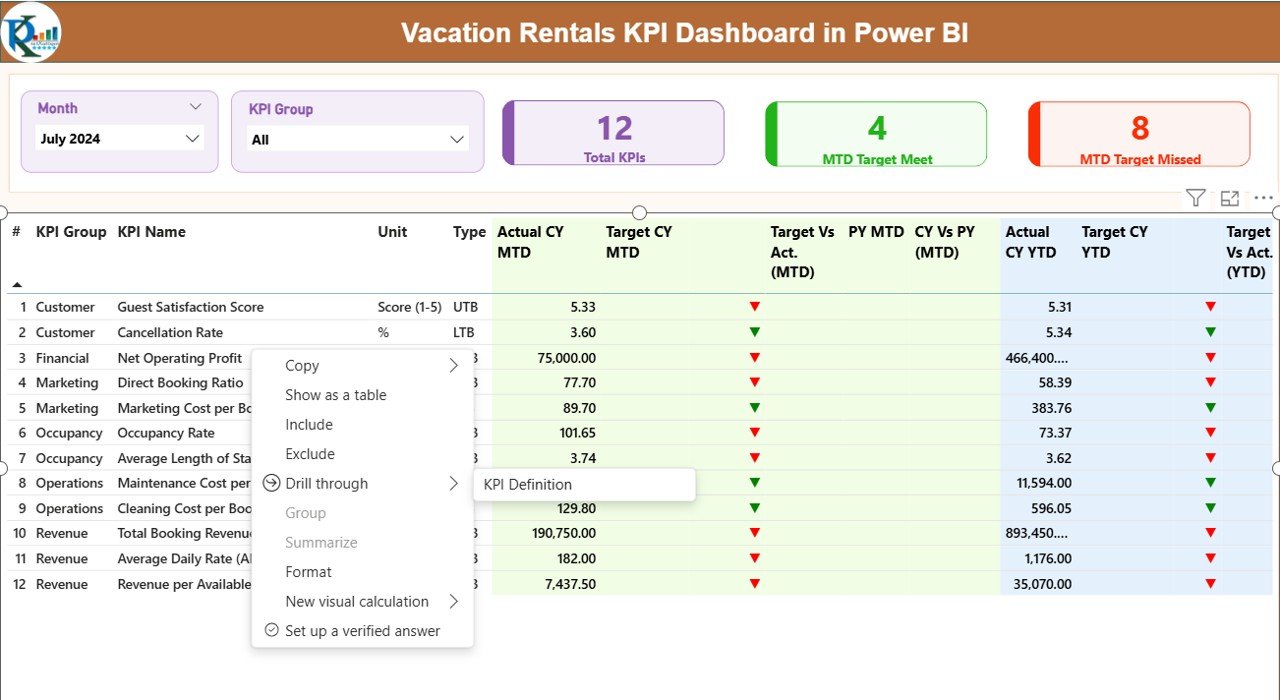
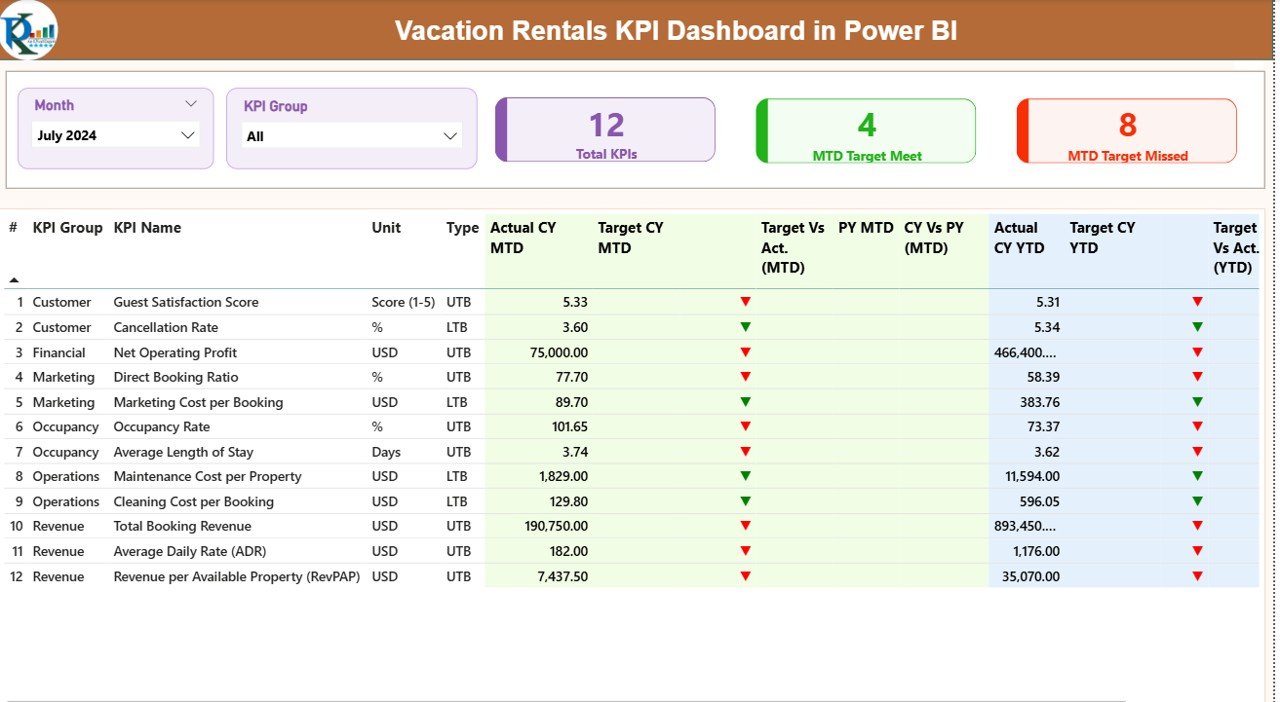
📊 Interactive Summary Page
Monitor all KPIs in one central command center with dynamic slicers and visual indicators.
📅 Month & KPI Group Slicers
Filter performance by month or category instantly.
📈 MTD & YTD Tracking
Track short-term and long-term performance simultaneously.
🎯 Target vs Actual Comparison
Instantly see whether you meet your goals.
📉 Previous Year Comparison
Measure growth accurately using historical performance data.
🟢🔴 Performance Icons (LTB / UTB Logic)
Green ▲ and Red ▼ indicators simplify decision-making.
📊 KPI Trend Analysis Page
Visual combo charts for historical performance tracking.
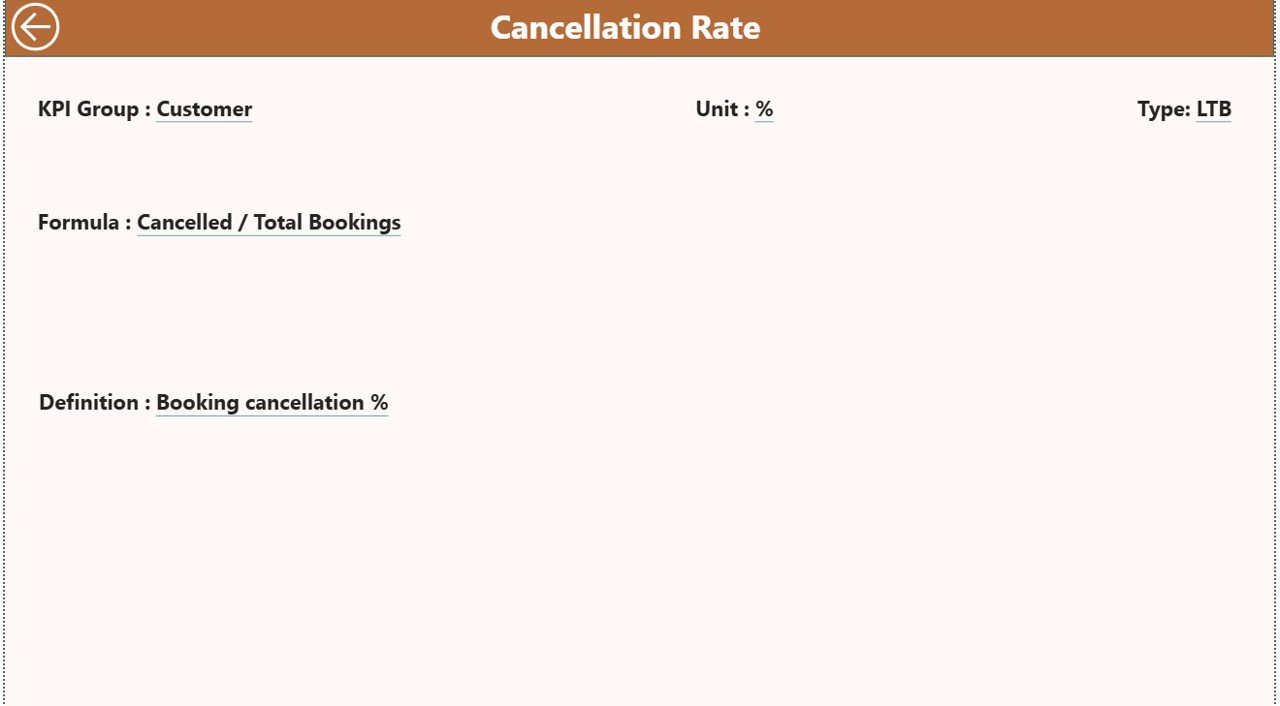
🔎 Drill-Through KPI Definition Page
Understand formulas, logic, and KPI classification in detail.
🔄 Excel Data Integration
Simply update Excel and click refresh in Power BI.
📦 What’s Inside the Vacation Rentals KPI Dashboard in Power BI
When you download this product, you receive a fully structured Power BI Desktop file connected to a well-designed Excel data source.
The Excel file includes:
✔ Input_Actual Sheet
✔ Input_Target Sheet
✔ KPI Definition Sheet
The Power BI file includes:
✔ Summary Dashboard Page
✔ KPI Trend Page
✔ KPI Definition Drill-Through Page
✔ MTD & YTD Calculations
✔ Target vs Actual Logic
✔ Previous Year Comparison Measures
✔ Dynamic KPI Cards
Everything is already built. You do not need to create DAX formulas or visuals from scratch.
🛠 How to Use the Vacation Rentals KPI Dashboard in Power BI
Using this dashboard is simple.
Step 1️⃣ – Enter Actual data in the Input_Actual sheet
Step 2️⃣ – Enter Target data in the Input_Target sheet
Step 3️⃣ – Define KPI details in the KPI Definition sheet
Step 4️⃣ – Open Power BI and click Refresh
That’s it.
The dashboard updates automatically. All charts, indicators, and calculations adjust instantly.
You can also:
✔ Add new KPIs
✔ Include multiple properties
✔ Filter by revenue, occupancy, cost, or guest KPIs
✔ Conduct monthly review meetings using the Summary page
This makes performance management structured and efficient.
👥 Who Can Benefit from This Vacation Rentals KPI Dashboard in Power BI
🏡 Airbnb Hosts
🏢 Property Management Companies
📊 Revenue Managers
🏨 Hospitality Consultants
📈 Real Estate Portfolio Owners
💼 Vacation Rental Startups
Whether you manage 1 property or 100, this dashboard adapts to your needs.
Small hosts gain visibility.
Large portfolios gain control.
Consultants gain professional reporting power.
💡 Why This Dashboard Is a Game-Changer
Instead of reacting late to occupancy drops or revenue declines, you identify issues early.
If bookings decrease → Adjust pricing strategy.
If cancellation rate increases → Improve policies.
If cleaning costs rise → Optimize vendor contracts.
Because decisions become data-driven, profitability improves.
This dashboard does not just show numbers.
It drives action.
And in today’s competitive vacation rental market, fast decisions create winning results.
Click here to read the Detailed blog post
Watch the step-by-step video tutorial:


