Cities never stop growing. Roads expand. Bridges rise. Metro lines extend. Utilities evolve. Meanwhile, budgets tighten, deadlines shrink, and stakeholders demand transparency at every stage.
If you are still managing infrastructure projects through scattered spreadsheets and manual reports, you are losing visibility — and potentially losing money.
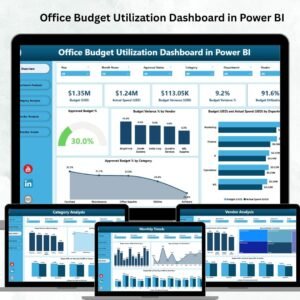
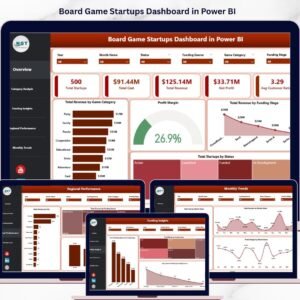
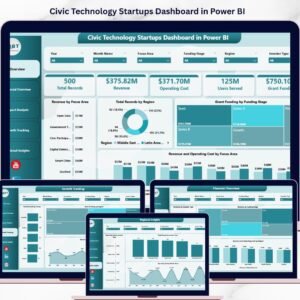
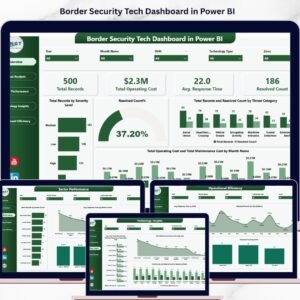
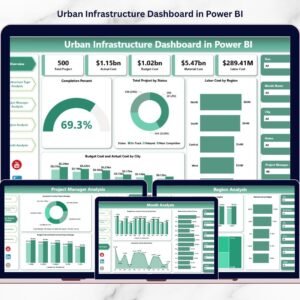
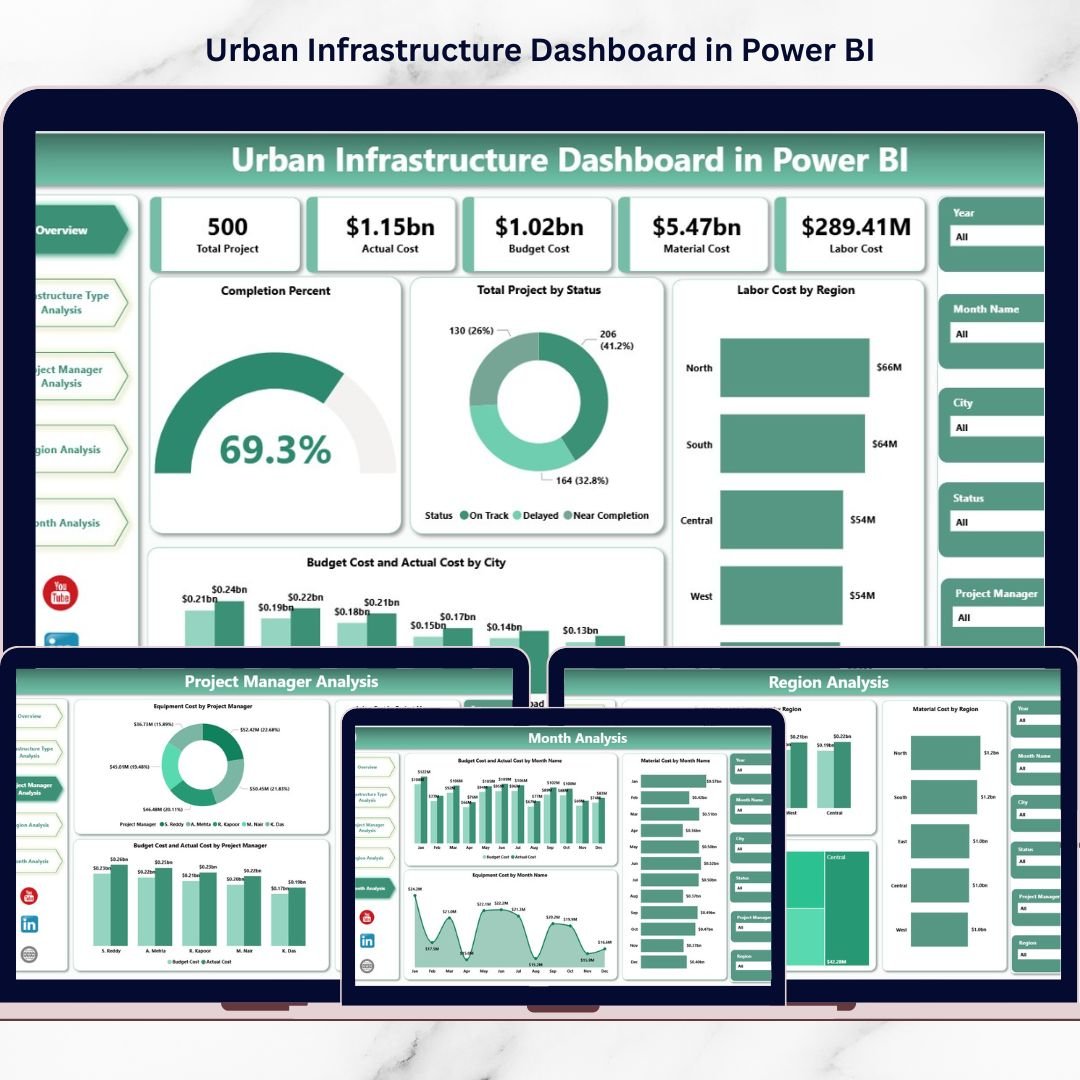
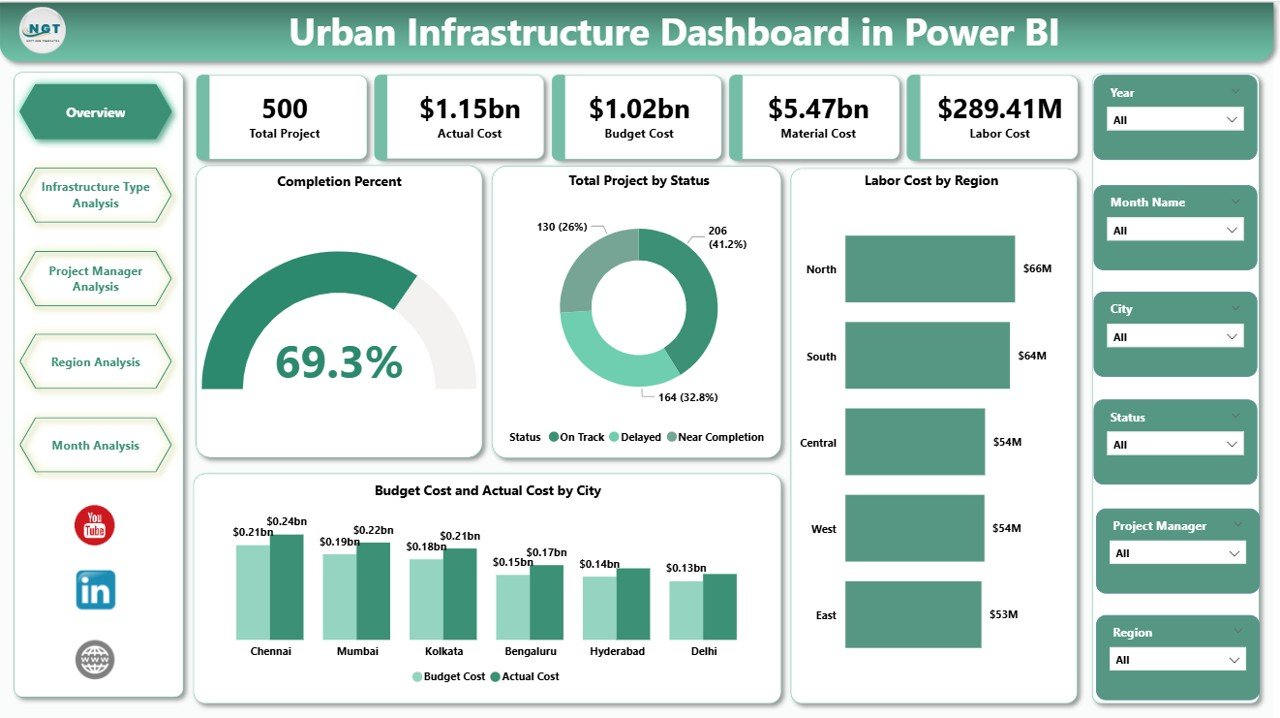
That is why we created the Urban Infrastructure Dashboard in Power BI — a powerful, ready-to-use analytical solution designed to bring clarity, control, and confidence to urban development projects.
This interactive dashboard transforms raw infrastructure data into meaningful visuals. As a result, city planners, government agencies, and construction leaders can instantly monitor project completion, compare budget vs actual costs, analyze regional performance, and detect overruns before they escalate.
If you want smarter cities built with smarter decisions, this dashboard is built for you.
🚀 Key Feature of Urban Infrastructure Dashboard in Power BI
This dashboard includes 5 powerful analytical pages, each designed to monitor a critical dimension of infrastructure performance:
📊 Overview Page – Track completion %, project status, labor cost by region, and budget vs actual by city.
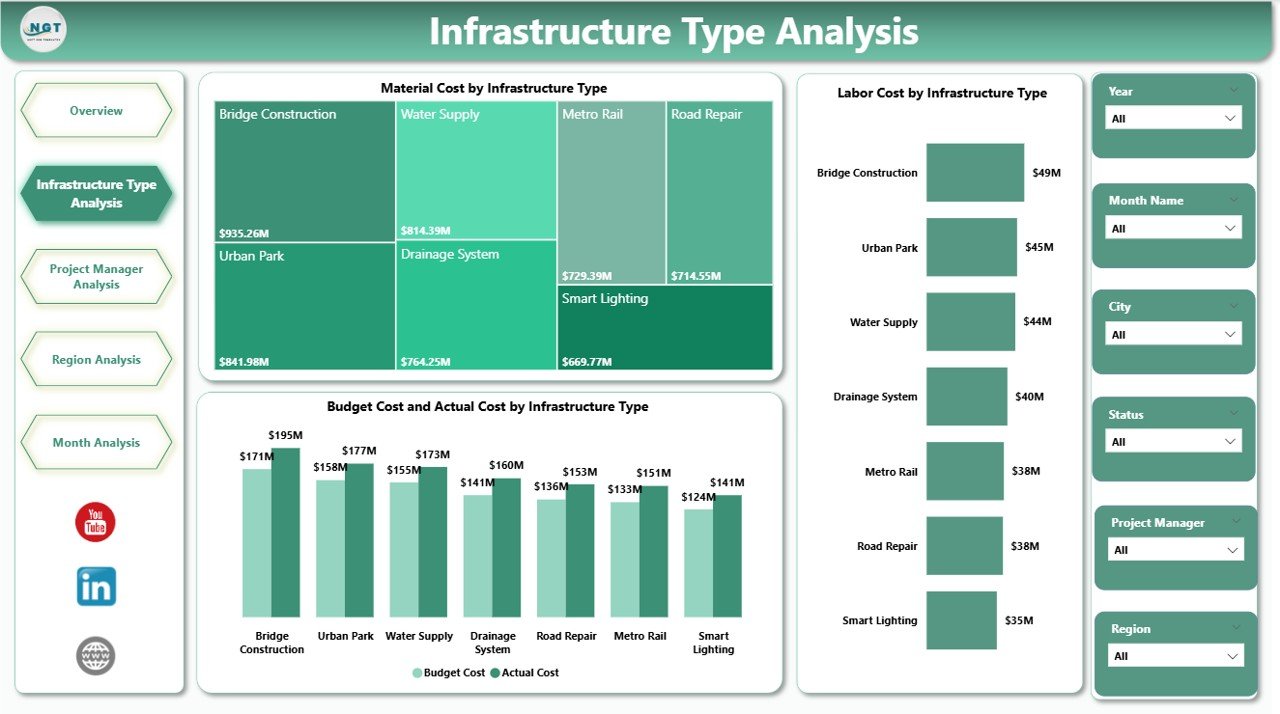
🏗 Infrastructure Type Analysis – Compare material, labor, and budget variance across roads, bridges, metro systems, utilities, and more.
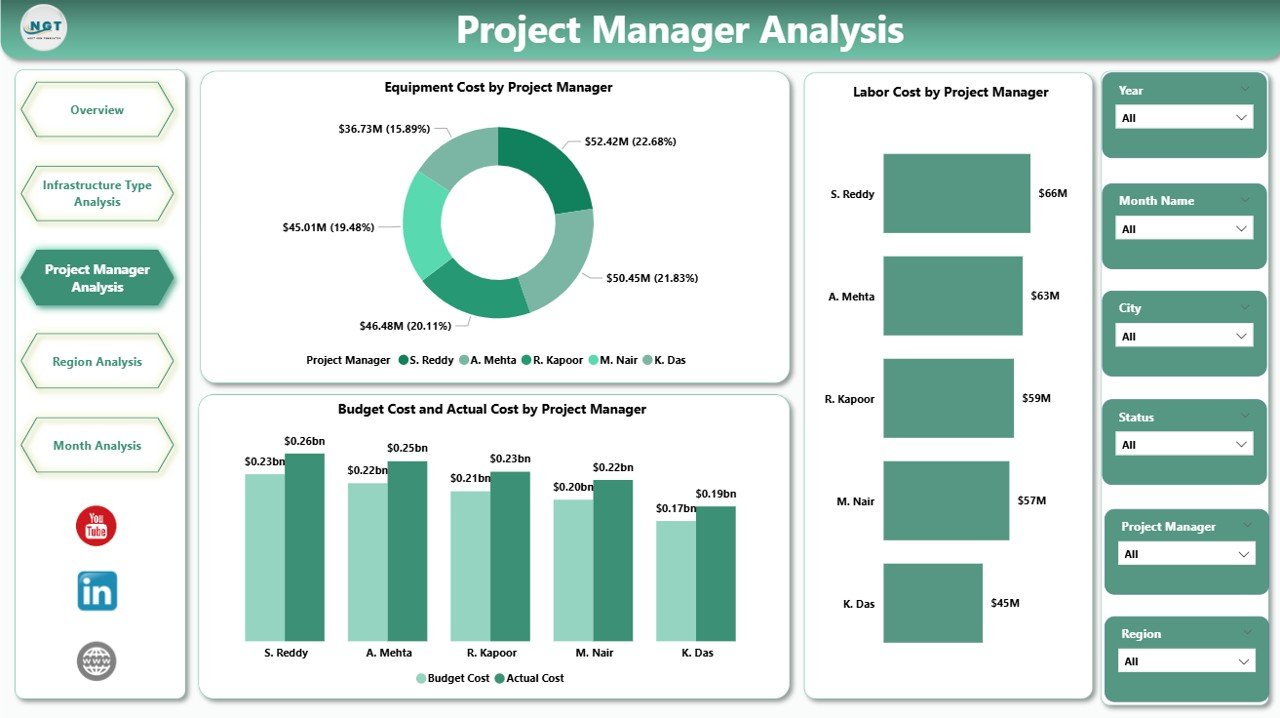
👷 Project Manager Analysis – Evaluate manager-level cost control and performance.
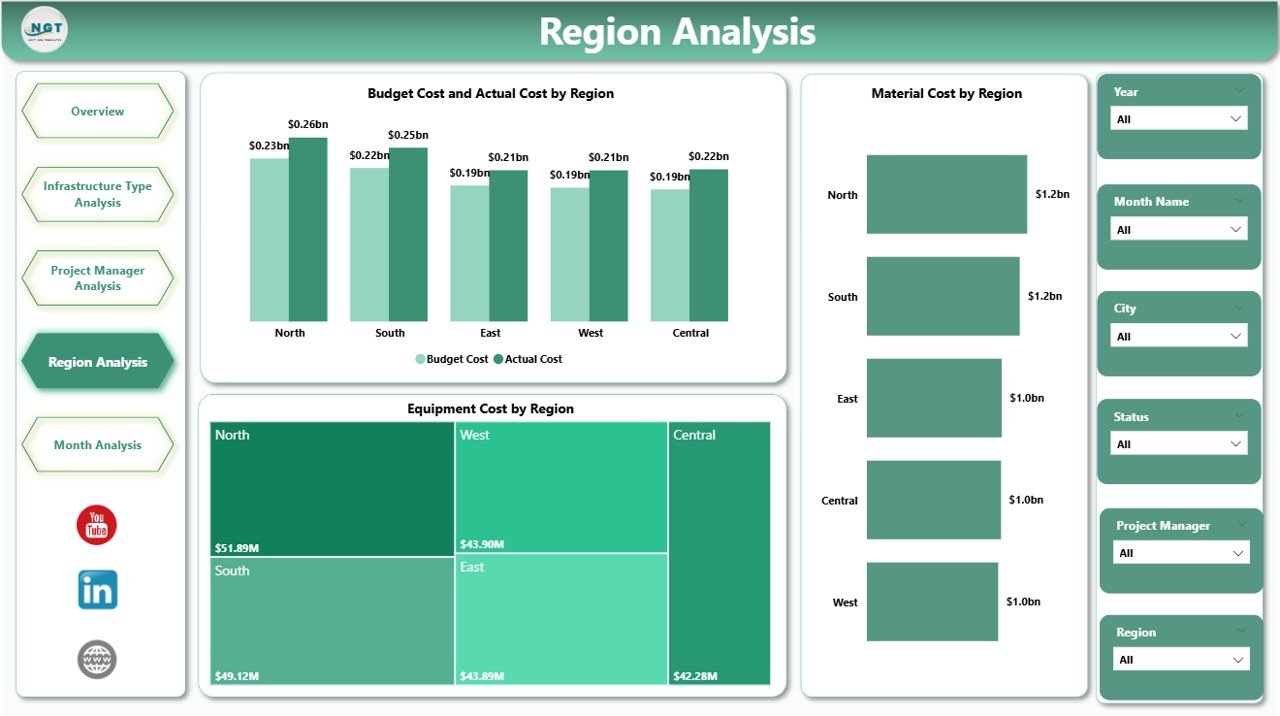
🌍 Region Analysis – Identify high-cost zones and optimize funding allocation.
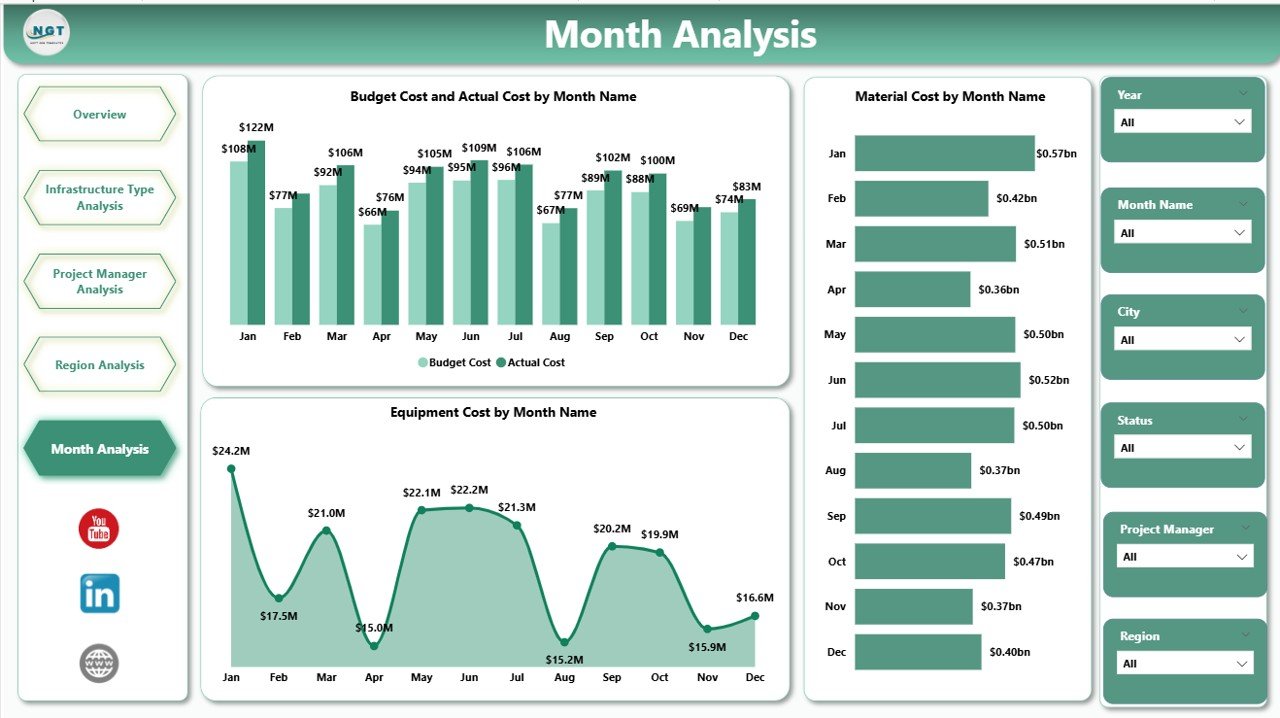
📅 Month Analysis – Monitor cost trends and seasonal patterns over time.
✨ Advanced Power BI capabilities include:
-
Interactive slicers
-
Drill-down analysis
-
Dynamic filtering
-
Real-time data refresh
-
Clear cost comparison visuals
Because everything updates dynamically, you move from reactive reporting to proactive planning.
📦 What’s Inside the Urban Infrastructure Dashboard in Power BI
This professionally designed Power BI file includes:
✔ 5 fully structured analytical pages
✔ KPI cards for completion % and project status
✔ Budget vs Actual comparison visuals
✔ Labor, Equipment & Material cost tracking
✔ Infrastructure-type cost distribution
✔ Region-wise performance insights
✔ Project manager accountability charts
✔ Monthly trend analysis
✔ Interactive filters for city, region, manager, and month
You don’t need complex setup. Simply connect your data and start analyzing instantly.
🛠 How to Use the Urban Infrastructure Dashboard in Power BI
Using this dashboard is simple and practical:
1️⃣ Import your project data into Power BI.
2️⃣ Refresh the dashboard weekly or monthly.
3️⃣ Use slicers to filter by city, region, infrastructure type, or manager.
4️⃣ Compare Budget vs Actual instantly.
5️⃣ Identify cost spikes, delays, and inefficiencies early.
For example:
If one city exceeds budget by 12%, you can investigate immediately.
If bridge projects show higher material cost than expected, you adjust procurement.
If a region reports increasing labor expenses, you review workforce planning.
Because decisions are data-driven, financial surprises reduce significantly.
👥 Who Can Benefit from This Urban Infrastructure Dashboard in Power BI
This dashboard is ideal for:
🏛 Urban Development Authorities
🏗 Infrastructure Construction Companies
📊 Government Agencies
🏙 City Planning Departments
💼 Infrastructure Consultants
🚇 Smart City Project Managers
Whether you manage roads, bridges, metro systems, utilities, or residential infrastructure, this dashboard supports both operational monitoring and strategic planning.
It improves:
✔ Cost transparency
✔ Budget discipline
✔ Resource allocation
✔ Manager accountability
✔ Regional performance control
When infrastructure data becomes centralized and visual, decision-making becomes faster and smarter.
💰 How This Dashboard Improves Financial Control
Urban projects involve massive investments. Without real-time monitoring, overspending grows unnoticed.
This dashboard helps you:
-
Detect budget variance early
-
Monitor cost-heavy infrastructure types
-
Optimize labor and equipment deployment
-
Track project completion progress
-
Forecast expenses using monthly trends
Instead of reacting to financial damage, you prevent it.
And prevention is where profitability begins.
Click hare to read the Detailed blog post
Visit our YouTube channel to learn step-by-step video tutorials