Managing the performance of a trade association requires tracking multiple operational and financial metrics at the same time. From membership growth and revenue tracking to operational efficiency and historical comparisons, organizations must monitor a wide range of Key Performance Indicators (KPIs) to stay competitive and transparent.
However, many trade associations still rely on scattered spreadsheets and manual reports, making KPI tracking difficult, time-consuming, and error-prone.
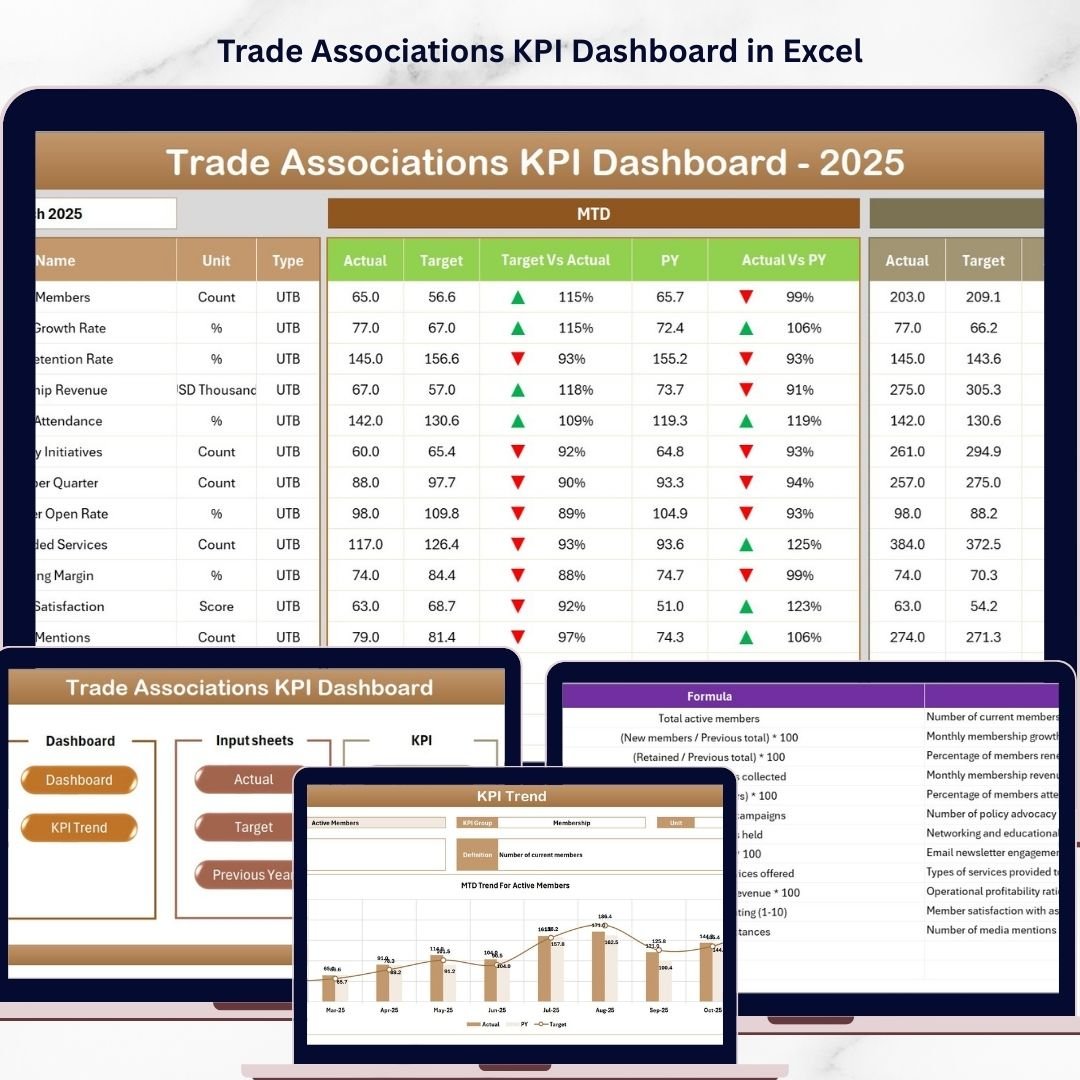
To solve this problem, we created the Trade Associations KPI Dashboard in Excel — a powerful, ready-to-use Excel dashboard designed to simplify KPI monitoring and help organizations make smarter decisions.
This professionally designed dashboard transforms raw KPI data into clear visual insights. With dynamic charts, automated calculations, and easy-to-update input sheets, you can monitor performance, compare results against targets, and evaluate year-over-year trends effortlessly.
Whether you manage a trade association, membership organization, professional body, or industry council, this dashboard helps you track financial health, operational performance, and KPI trends in one centralized Excel solution.
🚀 Key Features of Trade Associations KPI Dashboard
📊 Interactive KPI Dashboard
Monitor all your key performance indicators from one centralized dashboard with clear metrics and visual comparisons.
📅 Dynamic Month Selection
Use the drop-down menu to select any month and instantly update the entire dashboard with Month-to-Date and Year-to-Date data.
📈 MTD & YTD Performance Tracking
Track Month-to-Date and Year-to-Date performance against targets and previous year values for accurate performance evaluation.
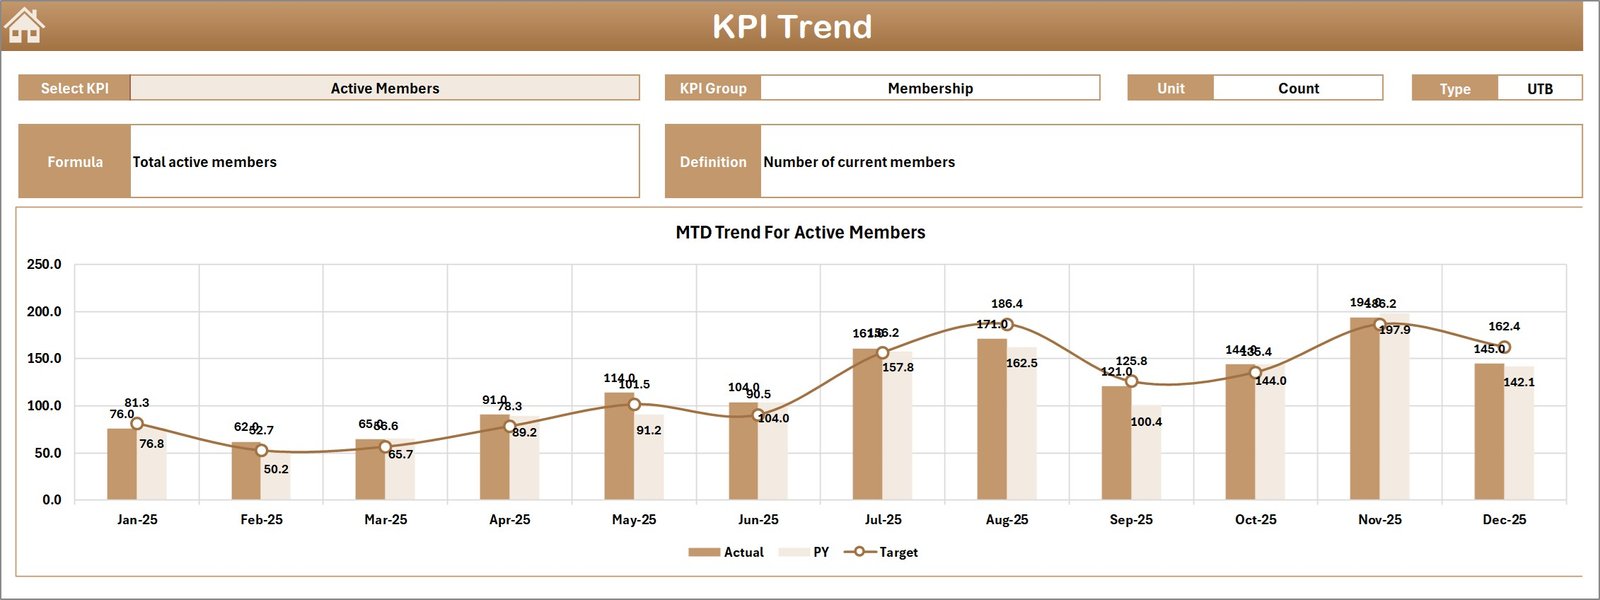
📉 Trend Analysis Charts
Analyze KPI trends over time using automated charts that display Actual, Target, and Previous Year performance.
📊 Conditional Formatting Indicators
Up and down arrows highlight whether KPIs are improving or declining, allowing quick visual insights.
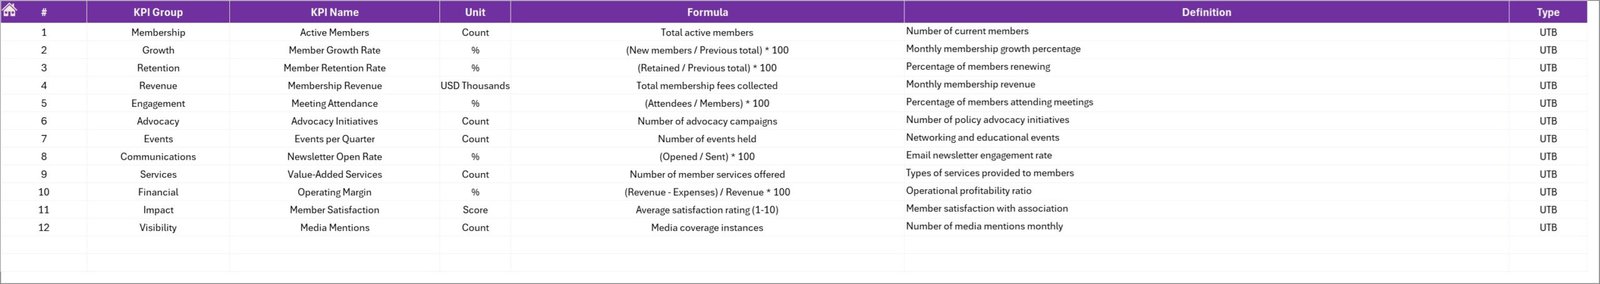
🧾 Detailed KPI Documentation
Every KPI includes its group, unit, formula, definition, and performance type (Lower the Better or Upper the Better).
📂 Structured Data Input Sheets
Separate sheets for Actual Numbers, Target Numbers, and Previous Year data ensure organized and accurate data entry.
⚡ Fully Automated Calculations
Prebuilt formulas automatically calculate comparisons, performance indicators, and trends without manual effort.
🎯 Professional Excel Dashboard Design
Clean layout, intuitive navigation, and organized sheets make this template easy to use even for non-technical users.
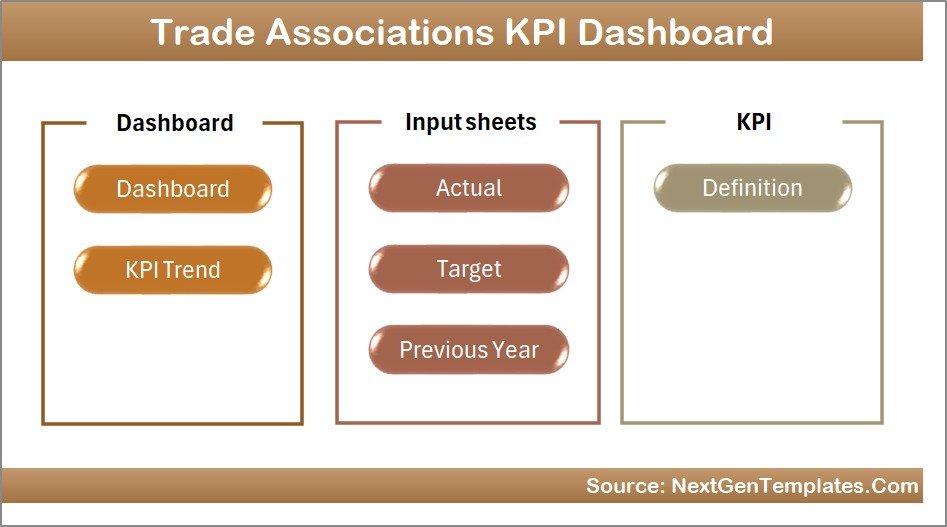
📦 What’s Inside the Trade Associations KPI Dashboard
This Excel template contains 7 structured worksheets, each designed to perform a specific function:
🏠 Home Sheet
The central navigation hub that provides quick access to all sections of the dashboard using interactive buttons.
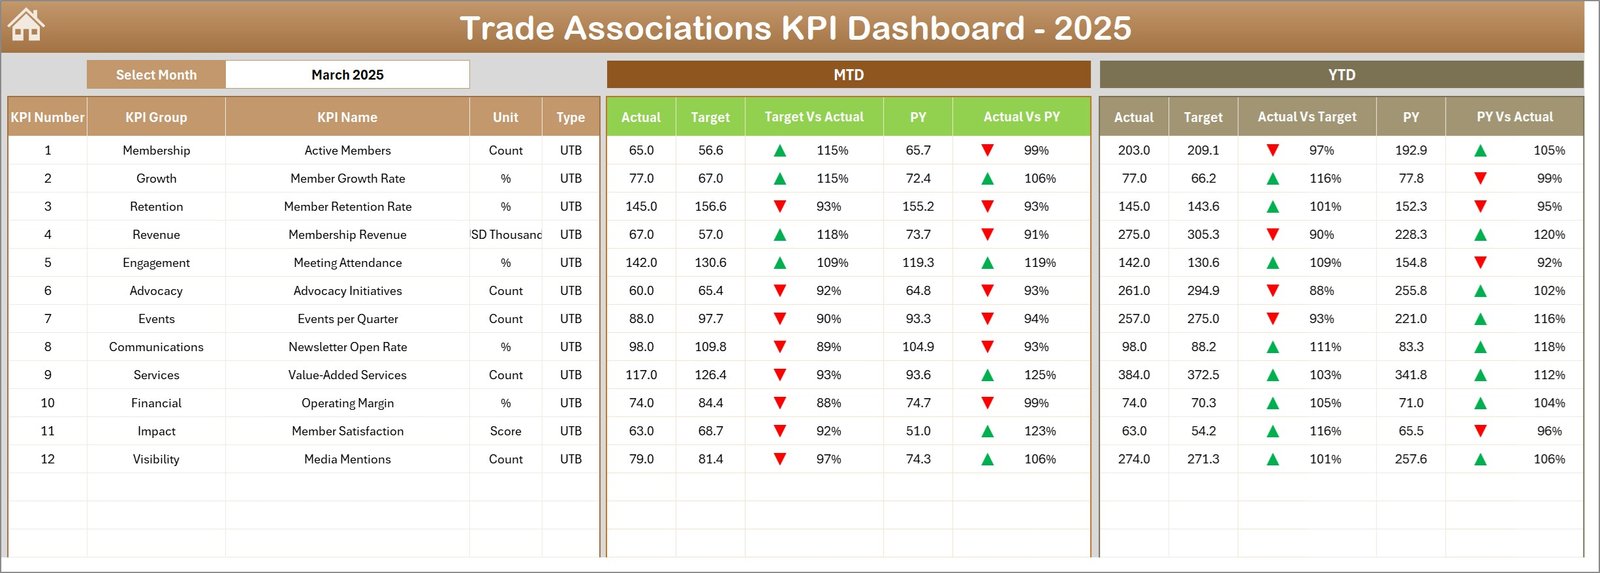
📊 Dashboard Sheet
The main dashboard where all KPIs are displayed with MTD, YTD, Target, and Previous Year comparisons.
📈 KPI Trend Sheet
Select any KPI and instantly view detailed trend charts, definitions, formulas, and performance metrics.
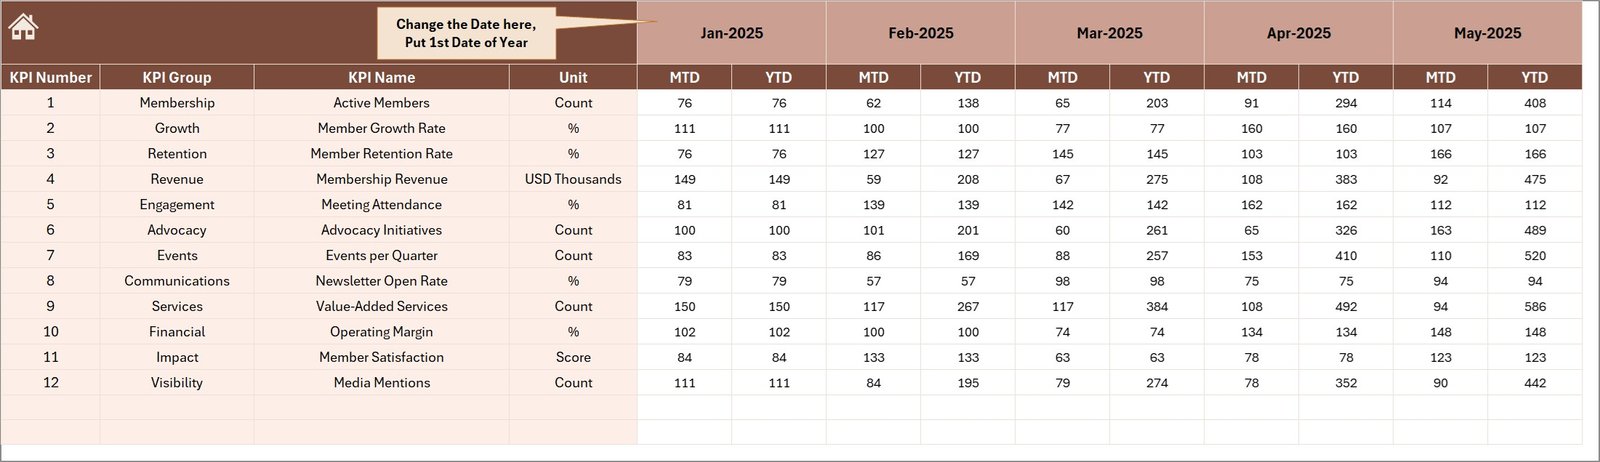
🧾 Actual Numbers Input Sheet
Enter the monthly KPI values here to update dashboard performance automatically.
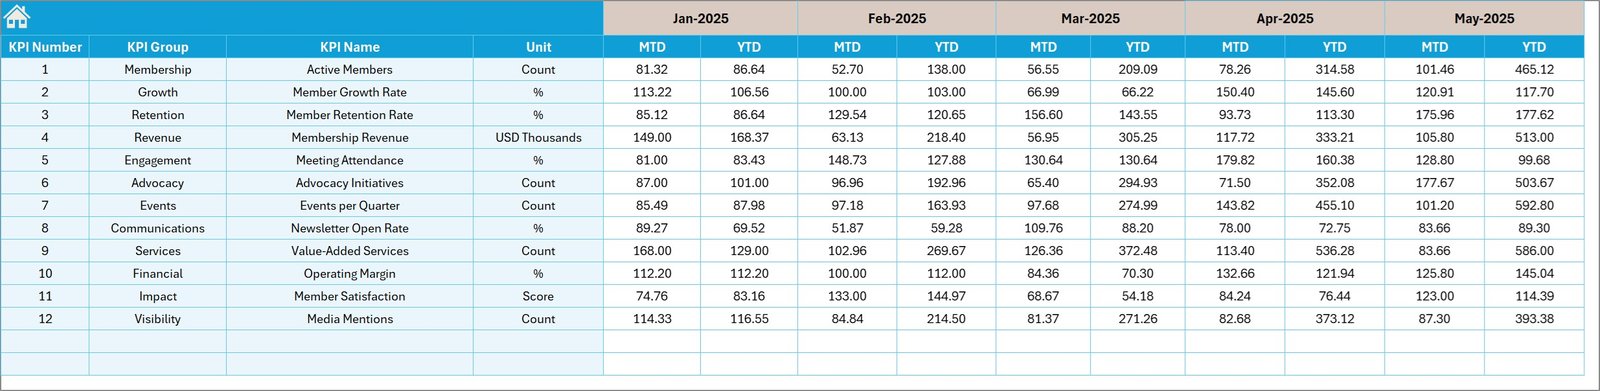
🎯 Target Numbers Input Sheet
Store target values for each KPI to evaluate performance against goals.
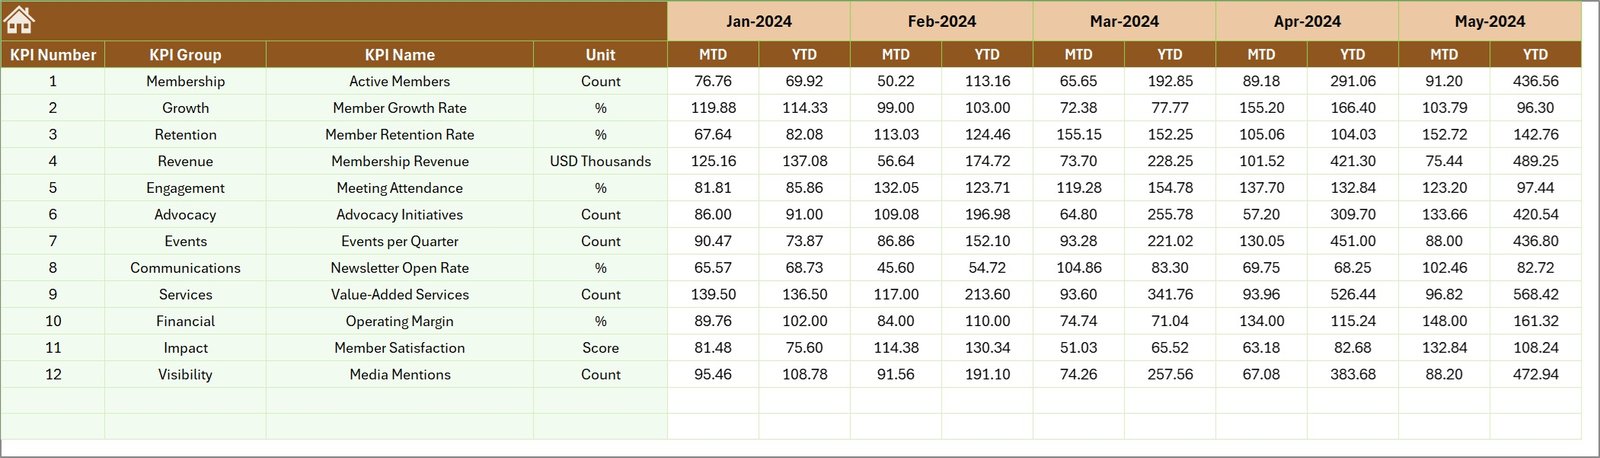
📅 Previous Year Data Sheet
Add historical KPI values for year-over-year comparisons.
📘 KPI Definition Sheet
Maintain complete documentation of each KPI including formula, unit, definition, and KPI type.
🛠 How to Use the Trade Associations KPI Dashboard
Using this Excel dashboard is extremely simple and requires only basic Excel knowledge.
1️⃣ Enter your monthly actual KPI numbers in the Actual Numbers sheet.
2️⃣ Add target KPI values in the Target Numbers sheet.
3️⃣ Input previous year KPI data in the Previous Year sheet.
4️⃣ Use the month selector in the dashboard to analyze performance dynamically.
5️⃣ Review charts, KPI comparisons, and indicators to identify performance trends.
Within minutes, you can transform raw KPI data into powerful business insights.
👥 Who Can Benefit from This Trade Associations KPI Dashboard
This dashboard is ideal for professionals and organizations that manage performance metrics.
🏢 Trade Associations tracking operational and financial KPIs
📊 Finance Teams monitoring accounting performance and financial indicators
👨💼 Executive Leadership analyzing organizational performance and trends
📈 Strategy & Planning Teams evaluating KPI performance and growth opportunities
👥 Membership Organizations monitoring member growth and engagement metrics
📉 Operations Managers tracking efficiency and productivity indicators
If your organization needs clear, data-driven insights to measure performance, this dashboard will become an essential reporting tool.
Click here to read the Detailed blog post
Watch the step-by-step video tutorial:


