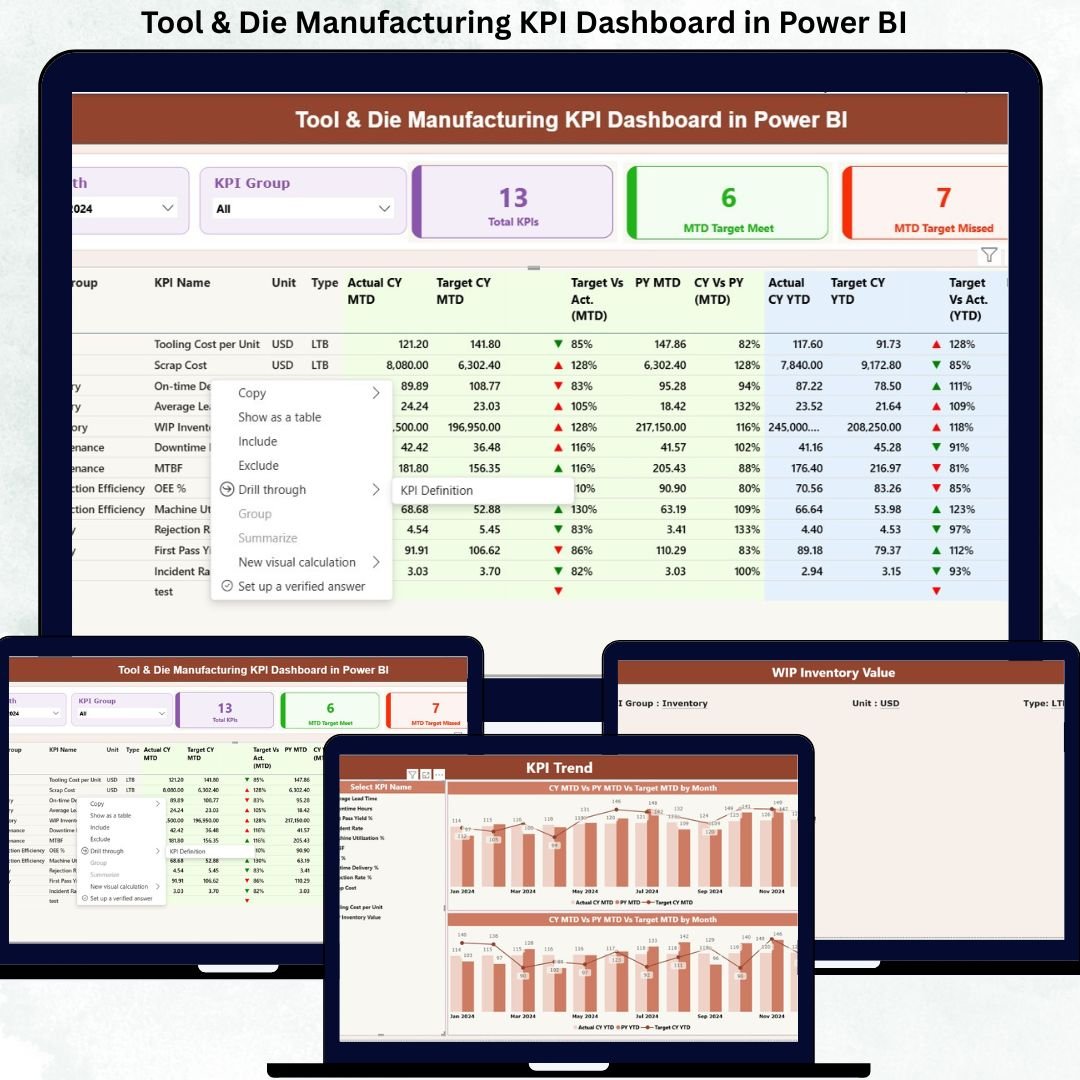
Tool and die manufacturing demands extreme precision, tight delivery schedules, and strict cost control. Even a minor deviation in performance can lead to delays, rework, or increased operational costs. However, many tool rooms and die manufacturing units still rely on manual tracking, scattered Excel files, and delayed performance reviews. As a result, decision-makers often react too late instead of acting proactively.Tool & Die Manufacturing KPI Dashboard in Power BI
That is exactly why the Tool & Die Manufacturing KPI Dashboard in Power BI is a game-changing solution.Tool & Die Manufacturing KPI Dashboard in Power BI
This ready-to-use Power BI dashboard converts complex manufacturing data into clear, visual, and actionable insights. Instead of chasing multiple reports, teams get a centralized view of production, quality, efficiency, cost, and delivery KPIs—all in one interactive dashboard. Because the data source is Excel, implementation remains simple, fast, and practical for real-world manufacturing environments.
🔑 Key Features of Tool & Die Manufacturing KPI Dashboard in Power BI
✅ Interactive KPI Monitoring – Track critical manufacturing KPIs with real-time visuals
✅ MTD & YTD Performance Analysis – Monitor short-term execution and long-term trends together
✅ Target vs Actual Comparison – Instantly identify performance gaps and achievements
✅ Previous Year Benchmarking – Measure improvement against historical performance
✅ Color-Coded Performance Indicators – Green and red arrows highlight success and risk instantly
✅ Dynamic Filters & Slicers – Analyze performance by month and KPI group effortlessly
✅ KPI Trend Analysis – Visualize KPI behavior over time using combo charts
✅ Standardized KPI Definitions – Maintain clarity, governance, and consistency across teams
✅ Excel-Based Data Entry – No complex systems required—easy and flexible data input

📦 What’s Inside the Tool & Die Manufacturing KPI Dashboard in Power BI
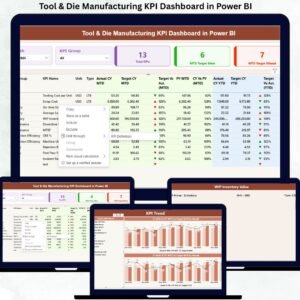
This digital product includes a professionally structured Power BI report with three powerful pages:Tool & Die Manufacturing KPI Dashboard in Power BI
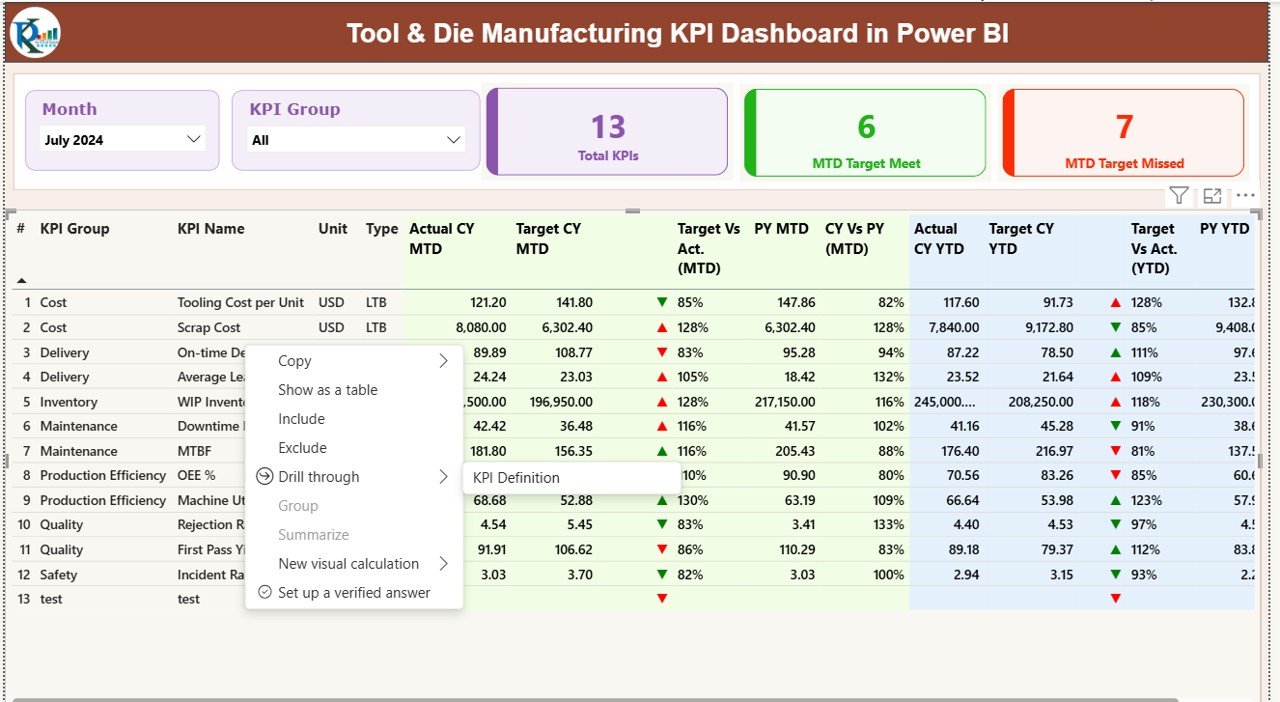
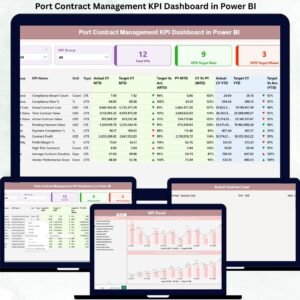
📊 Summary Page
The main control center of the dashboard where you get an instant snapshot of overall performance.
You can filter data by Month and KPI Group, while KPI cards display:Tool & Die Manufacturing KPI Dashboard in Power BI
-
Total KPIs tracked
-
MTD Target Met count
-
MTD Target Missed count
A detailed KPI table shows MTD and YTD actuals, targets, previous-year values, and performance indicators—helping you assess execution at a glance.
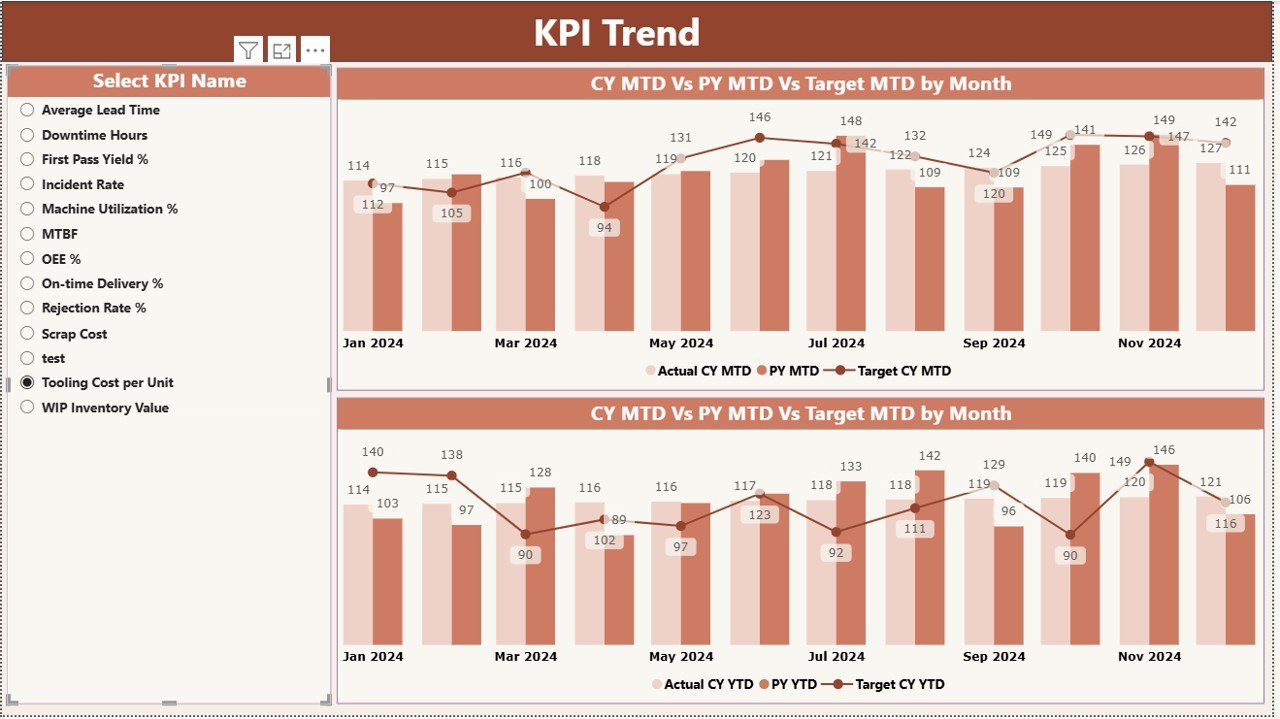
📈 KPI Trend Page
This page allows deep-dive analysis of individual KPIs.
Using a KPI selector, you can analyze:
-
MTD trends
-
YTD trends
-
Actual vs Target vs Previous Year comparisonsTool & Die Manufacturing KPI Dashboard in Power BI
As a result, identifying seasonality, bottlenecks, and improvement opportunities becomes effortless.
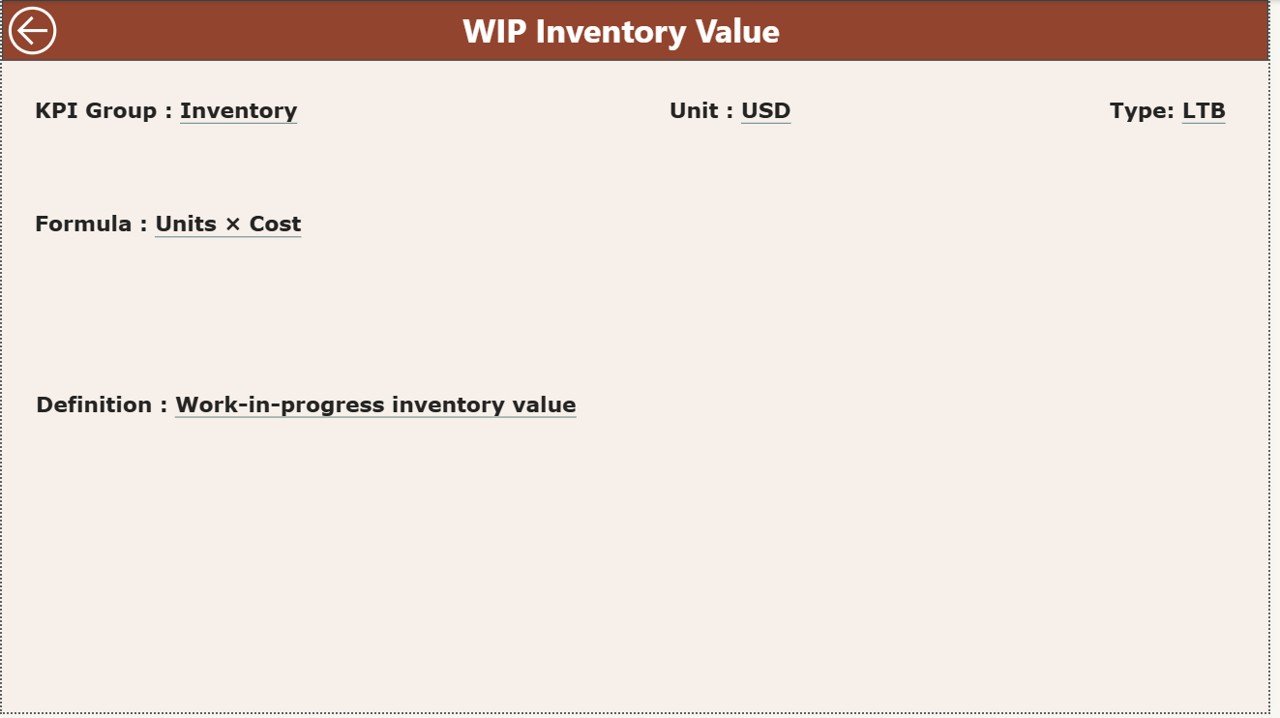
📘 KPI Definition Page
This hidden drill-through page ensures KPI clarity and standardization.
It displays:
-
KPI definition
-
Formula and calculation logic
-
Unit of measurement
-
KPI type (LTB or UTB)
This eliminates confusion and ensures consistent interpretation across departments.
⚙️ How to Use the Tool & Die Manufacturing KPI Dashboard in Power BI
Using this dashboard is simple and practical:
1️⃣ Enter actual KPI values in the Excel Input_Actual sheet
2️⃣ Enter target values in the Excel Input_Target sheet
3️⃣ Maintain KPI master data in the KPI Definition sheet
4️⃣ Refresh Power BI to update all visuals automatically
5️⃣ Use slicers, tables, and charts to analyze performanceTool & Die Manufacturing KPI Dashboard in Power BI
Because Power BI handles calculations and visuals, users can focus entirely on insights and decision-making.
🎯 Who Can Benefit from This Tool & Die Manufacturing KPI Dashboard
This dashboard is ideal for:
🏭 Tool room managers
⚙️ Manufacturing and process engineers
📊 Operations and plant heads
✅ Quality and production managers
📉 Cost control and improvement teamsTool & Die Manufacturing KPI Dashboard in Power BI
Whether you manage a small precision tool room or a large die manufacturing facility, this dashboard adapts easily to your operational scale.
Click here to read the Detailed blog post
Watch the step-by-step video tutorial:
Visit our YouTube channel to learn step-by-step video tutorials
https://www.youtube.com/@PKAnExcelExpert


Reviews
There are no reviews yet.