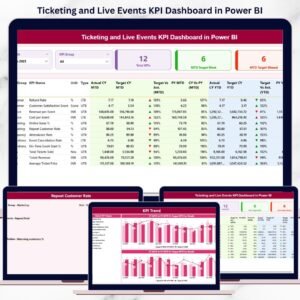
The ticketing and live events industry demands speed, accuracy, and clarity. Concerts, sports events, exhibitions, and festivals generate massive volumes of ticket sales and revenue data every month. Ticketing and Live Events KPI Dashboard in Power BI However, when teams rely on static reports or manual analysis, critical insights get delayed—and missed opportunities become costly.
Ticketing and Live Events KPI Dashboard in Power BI That is why the Ticketing and Live Events KPI Dashboard in Power BI is a game-changing analytics solution. This ready-to-use Power BI dashboard converts raw Excel data into interactive visuals, KPI cards, slicers, and trend analysis. As a result, event organizers, ticketing teams, and venue managers gain real-time visibility into performance and make confident decisions faster.
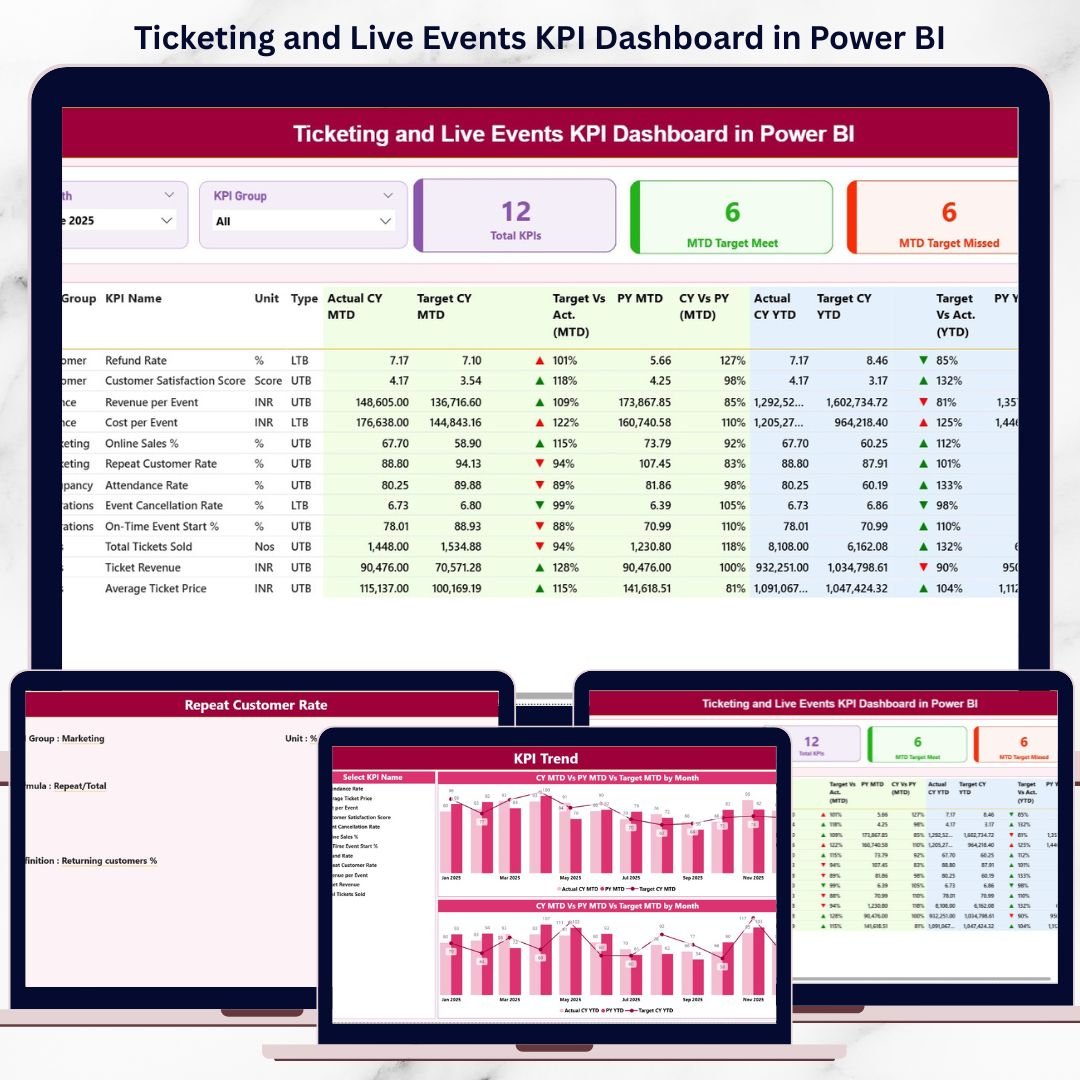
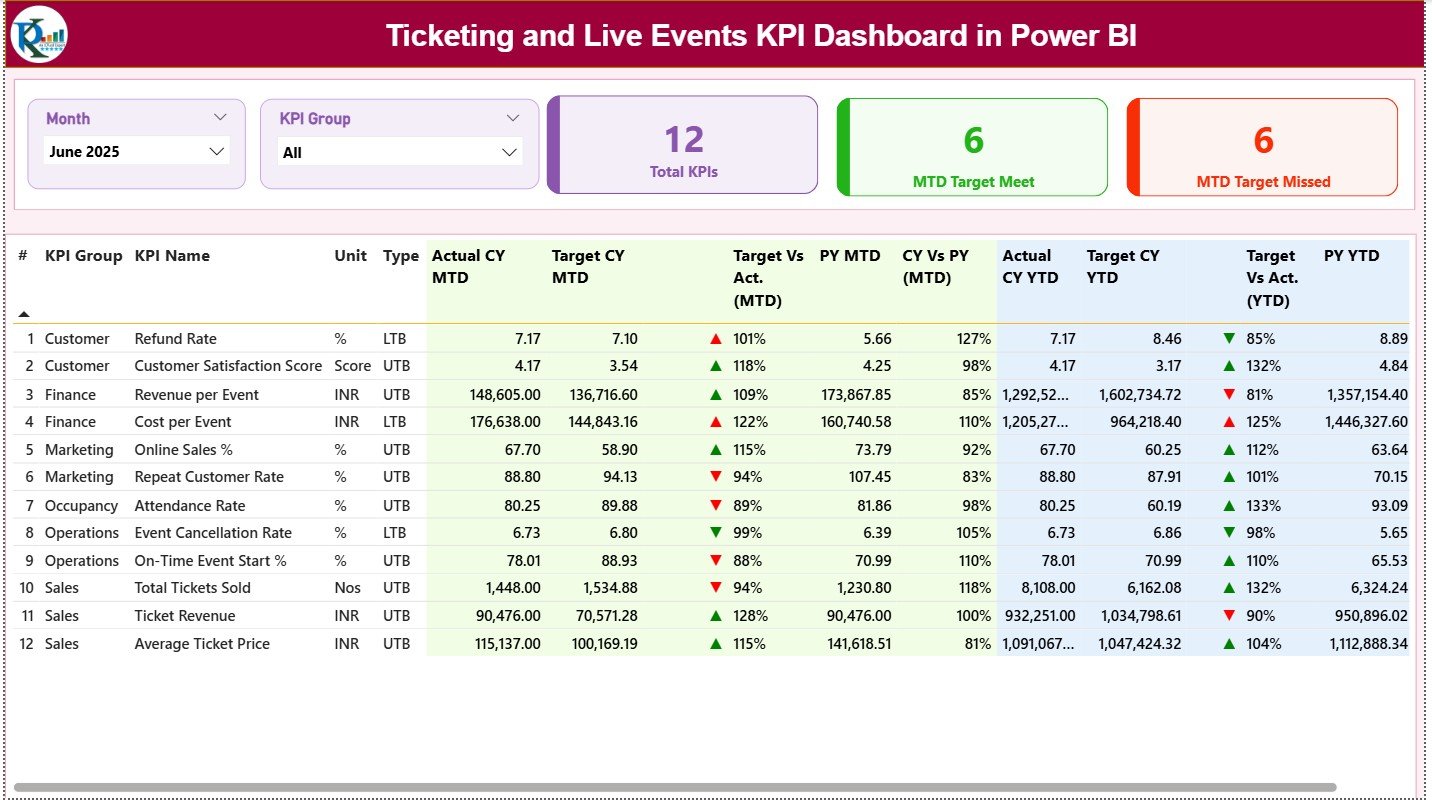
This dashboard tracks MTD, YTD, target vs actual, and previous-year performance in one centralized Power BI file—eliminating manual reporting and transforming how live event data is analyzed.
🔑 Key Features of Ticketing and Live Events KPI Dashboard in Power BI
📌 Interactive KPI Cards – Instantly view total KPIs, target met count, and target missed count.
📌 MTD & YTD Performance Tracking – Monitor month-to-date and year-to-date results dynamically.
📌 Target vs Actual Comparison – Identify performance gaps using percentage variance indicators.
📌 Previous Year Analysis – Compare current performance with last year’s data effortlessly.
📌 Powerful KPI Trend Analysis – Analyze performance over time using combo charts.
📌 Advanced Slicers – Filter by month, KPI group, or KPI name with one click.
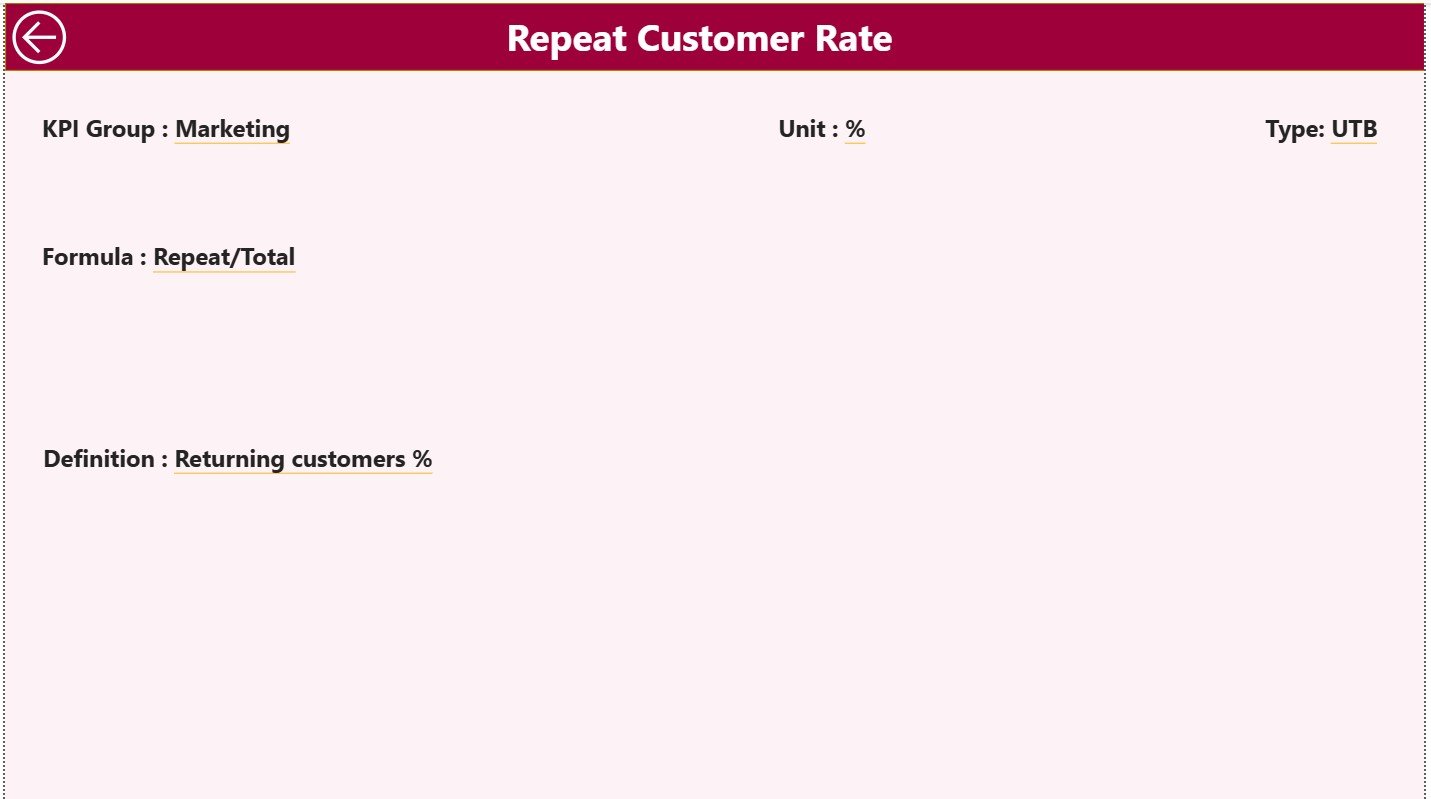
📌 Drill-Through KPI Details – View KPI formula and definition instantly for clarity.
📌 Excel-Based Data Entry – Maintain data easily without complex systems or databases.
📂 What’s Inside the Ticketing and Live Events KPI Dashboard in Power BI
This professionally designed Power BI dashboard includes 3 focused analytical pages:
📊 Summary Page
Acts as the main control center with slicers, KPI cards, and a detailed KPI performance table showing MTD, YTD, targets, and previous-year comparisons.
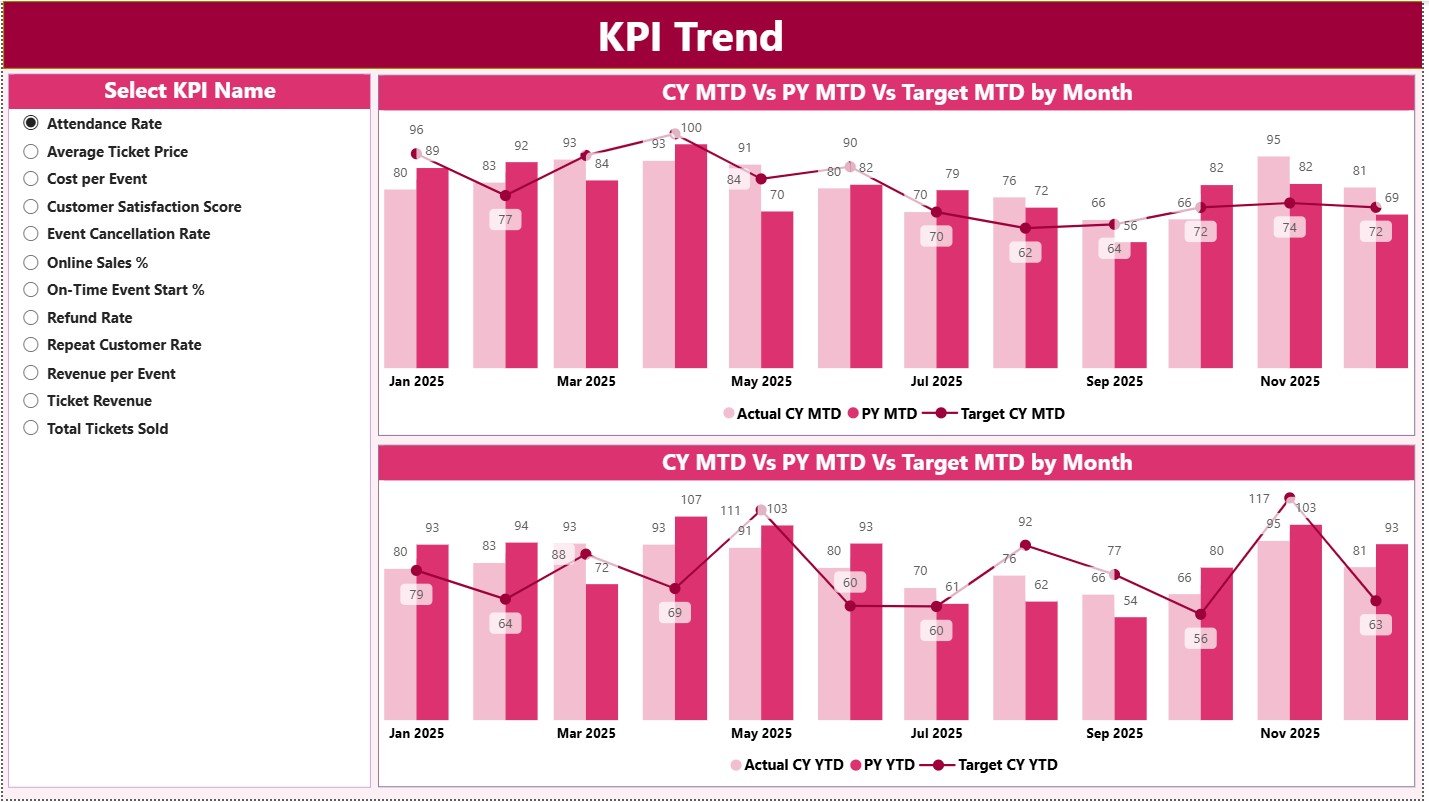
📈 KPI Trend Page
Displays interactive MTD and YTD trend charts comparing Actual vs Target vs Previous Year, helping users identify performance patterns instantly.
📘 KPI Definition (Drill-Through) Page
Provides KPI formulas and definitions through drill-through navigation, ensuring transparency without cluttering the main dashboard.
The dashboard connects seamlessly to an Excel file containing Actuals, Targets, and KPI Definitions, keeping data management simple and flexible.
⚙️ How to Use the Ticketing and Live Events KPI Dashboard in Power BI
🚀 Step 1: Enter actual performance data in the Excel Input Actual sheet.
🚀 Step 2: Define monthly and yearly targets in the Input Target sheet.
🚀 Step 3: Maintain KPI definitions in the KPI Definition sheet.
🚀 Step 4: Refresh Power BI to update all visuals instantly.
🚀 Step 5: Use slicers and drill-through to analyze performance deeply.
No advanced Power BI expertise is required—just refresh and analyze.
👥 Who Can Benefit from This Ticketing and Live Events KPI Dashboard
🎟️ Event Managers & Coordinators
🎤 Concert & Festival Organizers
🏟️ Venue Owners & Operators
🏀 Sports Event Management Teams
📈 Ticketing & Sales Operations
💰 Finance & Revenue Analysts
📊 Strategy & Planning Teams
Whether managing a single event or a large portfolio, this dashboard scales effortlessly.


Reviews
There are no reviews yet.