The live Ticketing and Live Events Dashboard industry is more competitive than ever. Concerts, festivals, corporate events, sports matches, and exhibitions attract massive audiences every month. However, managing ticket sales, marketing budgets, venue performance, and customer ratings manually creates confusion and missed opportunities.
Without structured tracking, you cannot answer important questions like:
Which event generated the highest net profit?
Which city performed best?
Which ticket type drives maximum revenue?
Is your marketing spend delivering results?
That is exactly why the Ticketing and Live Events Dashboard in Excel becomes a must-have solution 🎟️📊.
This ready-to-use Excel dashboard transforms raw ticketing data into clear, actionable insights. It allows you to monitor gross sales, net sales, marketing spend, ratings, ticket performance, and monthly trends — all in one interactive system. Instead of juggling spreadsheets, you gain full visibility and control.
🔑 Key Features of Ticketing and Live Events Dashboard in Excel
📊 Centralized Event Performance Tracking
Monitor all events, venues, cities, and ticket types in one structured dashboard.
💰 Gross & Net Sales Analysis
Track revenue streams clearly and compare profitability across events.
📈 Marketing Spend Monitoring
Evaluate marketing impact on sales and optimize campaign budgets.
⭐ Customer Rating Insights
Analyze event ratings by region and event type to improve quality.
🎯 Multi-Dimensional Filtering
Use slicers to filter by month, city, event type, and ticket category.
🧭 Interactive Page Navigator
Switch between analysis pages quickly and smoothly.
🧩 Excel-Based & Easy to Customize
No complex tools required. Modify KPIs and visuals as needed.
📦 What’s Inside the Ticketing and Live Events Dashboard in Excel
This dashboard includes 5 powerful analytical pages, along with structured Data and Support Sheets.
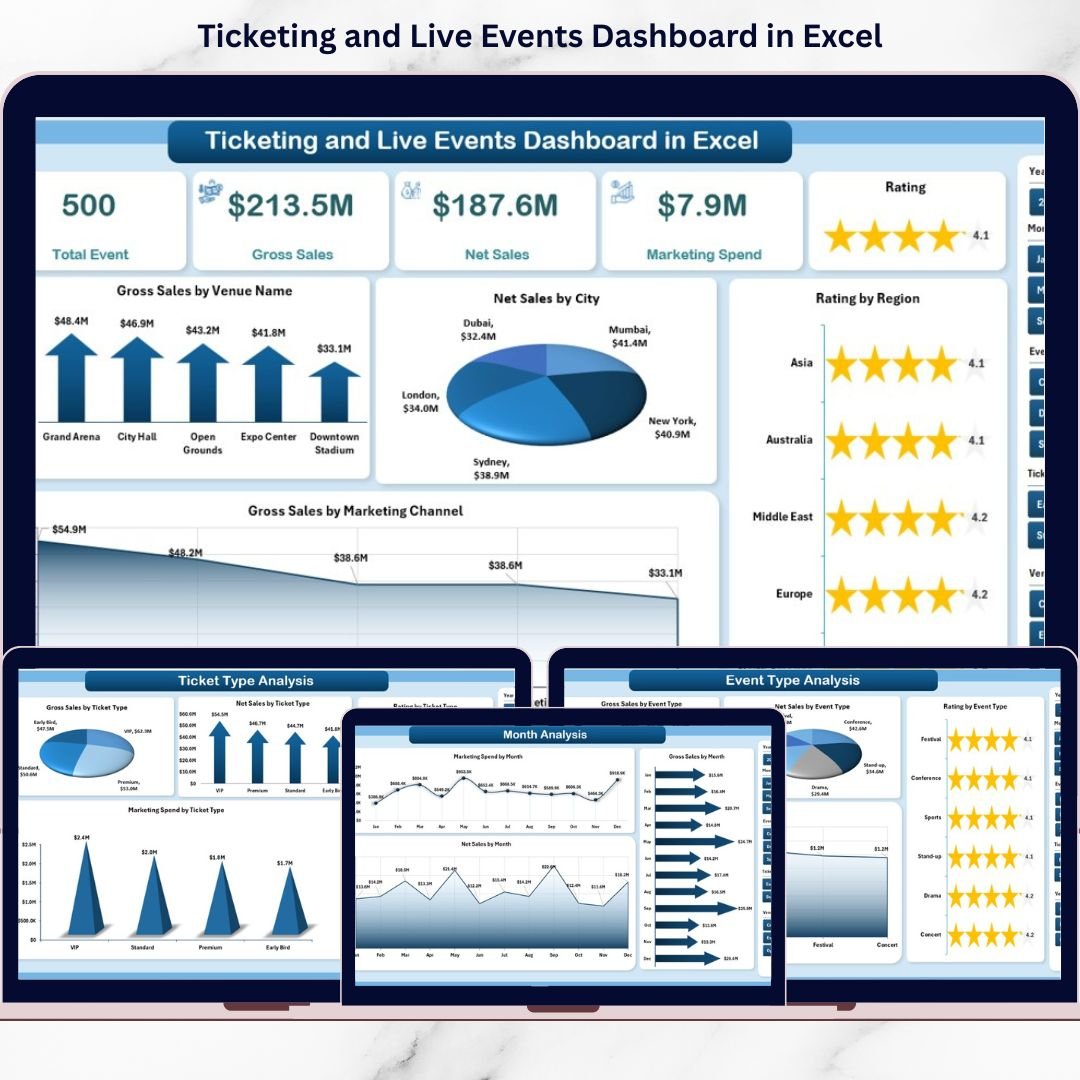
📌 Overview Page – Complete Business Snapshot
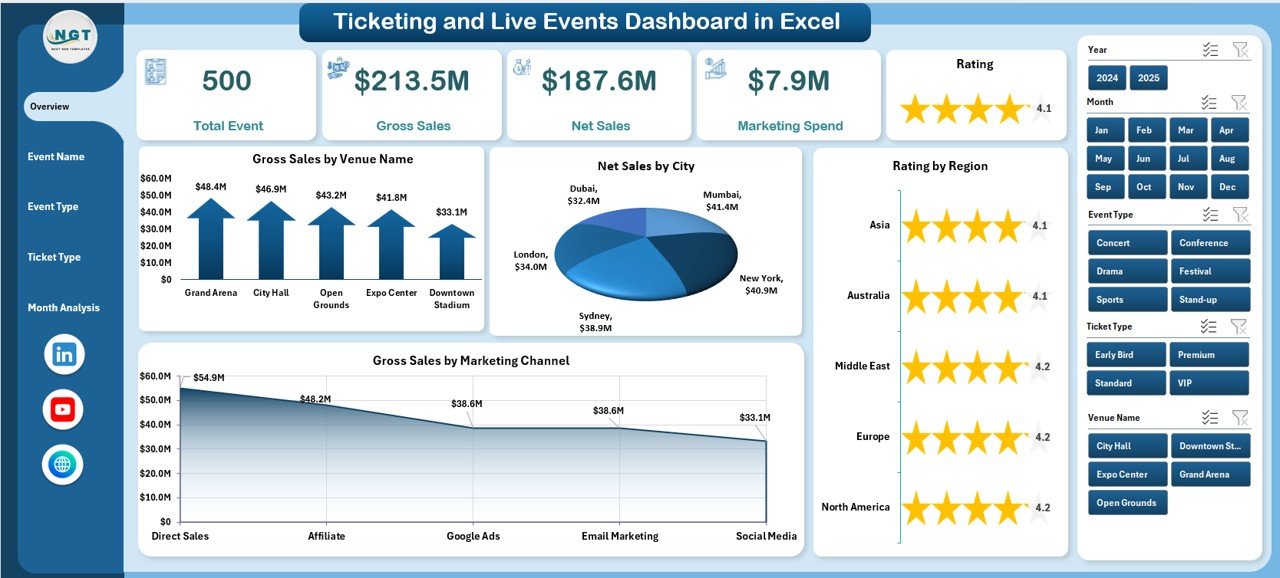
This is your executive summary page featuring:
• 4 KPI Cards (Total Gross Sales, Total Net Sales, Marketing Spend, Average Rating)
• Gross Sales by Venue
• Net Sales by City
• Rating by Region
• Gross Sales by Marketing
This page instantly shows top-performing venues, cities, and marketing impact.
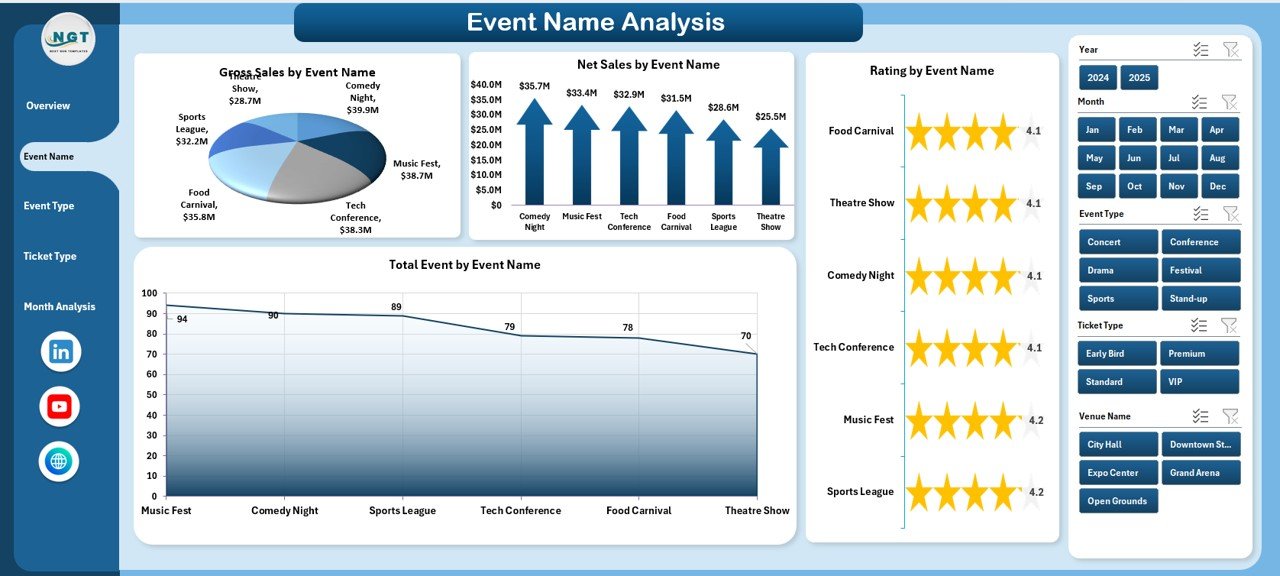
📢 Event Name Analysis Page
Compare performance event by event:
• Gross Sales by Event Name
• Net Sales by Event Name
• Rating by Event Name
• Total Events by Event Name
Identify profitable events and underperformers quickly.
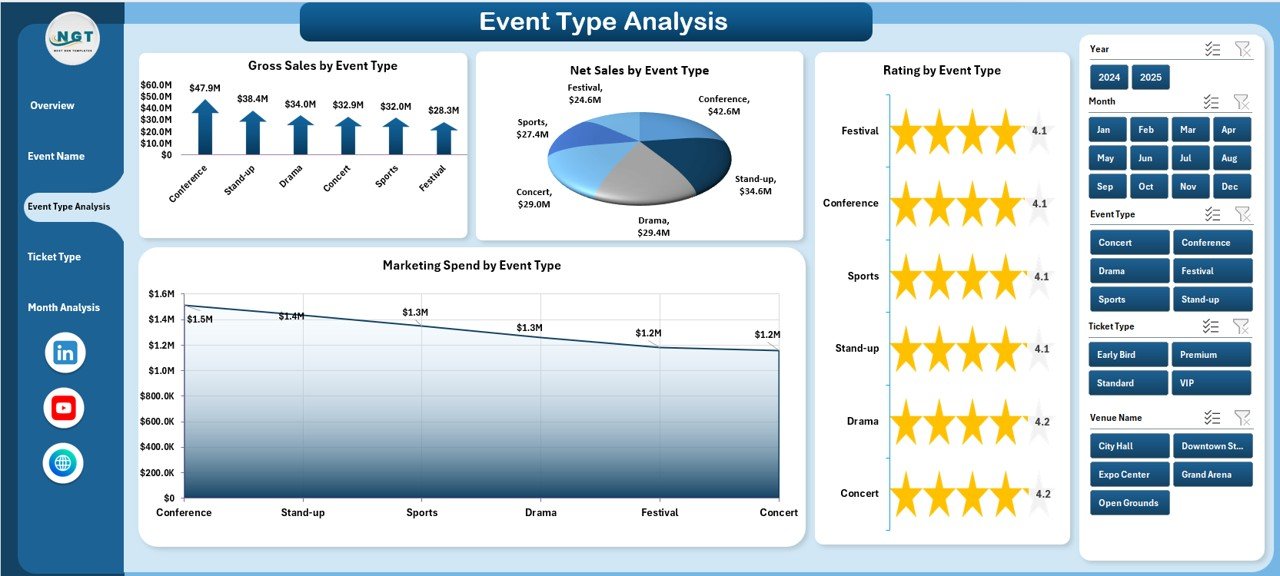
🎭 Event Type Analysis Page
Compare concerts, corporate events, sports events, and exhibitions:
• Gross Sales by Event Type
• Net Sales by Event Type
• Rating by Event Type
• Marketing Spend by Event Type
Invest more in high-performing categories.
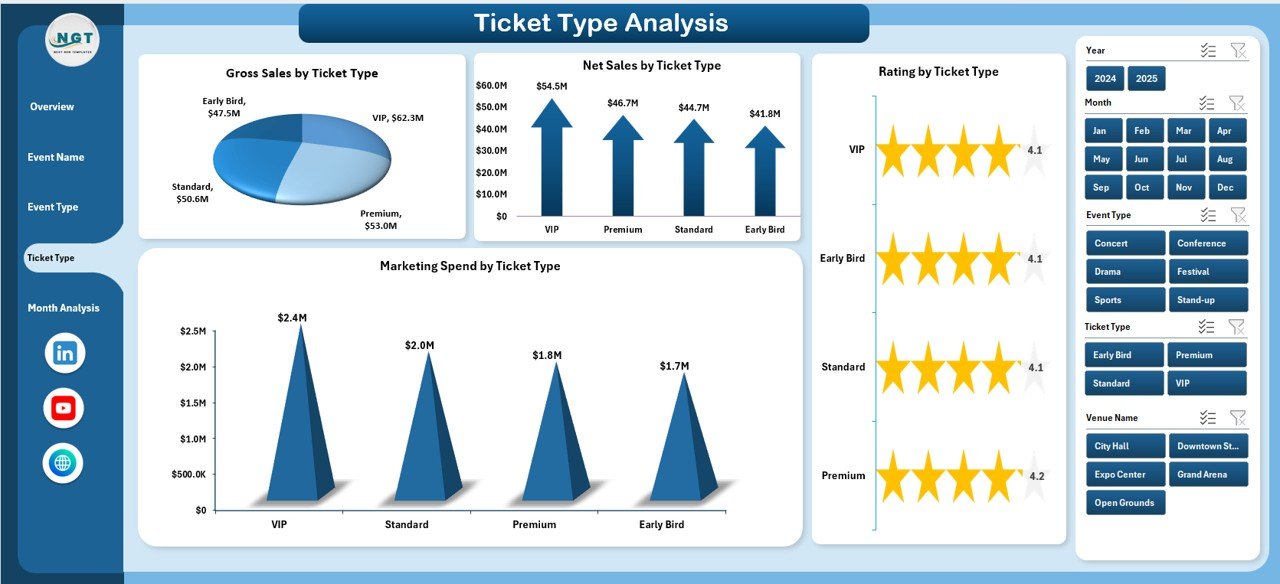
🎟️ Ticket Type Analysis Page
Analyze VIP, Regular, Early Bird, and Premium tickets:
• Gross Sales by Ticket Type
• Net Sales by Ticket Type
• Rating by Ticket Type
• Marketing Spend by Ticket Type
Optimize pricing strategy and promotional offers effectively.
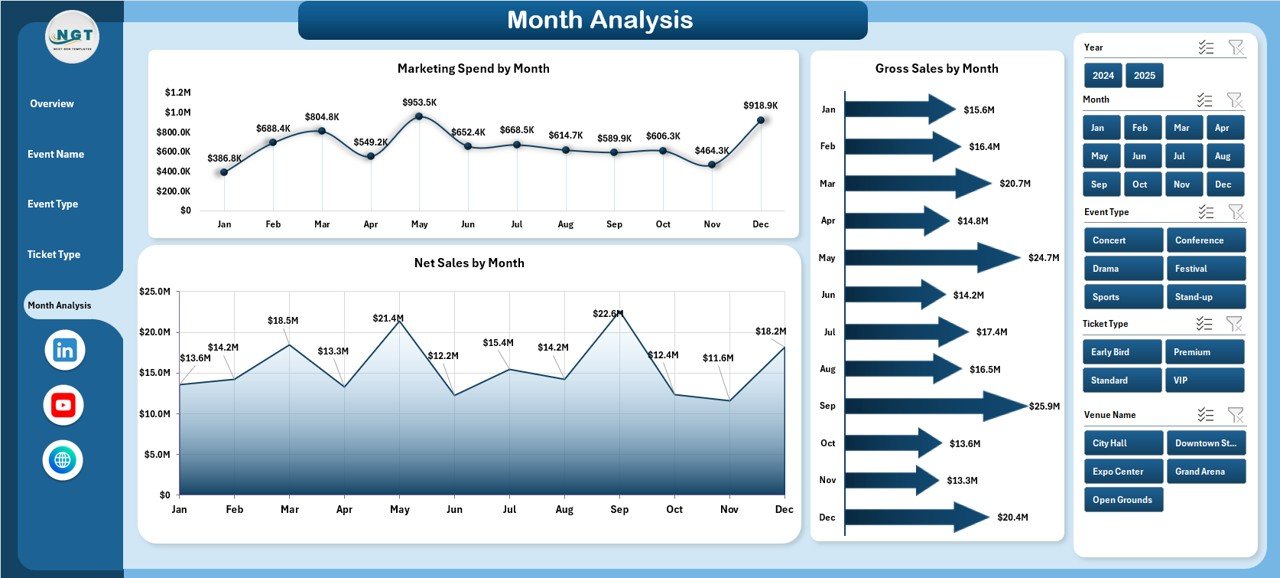
📅 Month Analysis Page
Track seasonal trends and sales performance:
• Gross Sales by Month
• Net Sales by Month
• Marketing Spend by Month
Plan future events strategically using historical trends.
📄 Data Sheet & Support Sheet
Data Sheet includes:
Event Name
Event Type
Venue Name
City
Region
Ticket Type
Gross Sales
Net Sales
Marketing Spend
Rating
Event Date
Month
The Support Sheet handles helper calculations and pivot logic for smooth reporting.
🛠️ How to Use the Ticketing and Live Events Dashboard in Excel
1️⃣ Enter structured event data into the Data Sheet
2️⃣ Convert data into Excel Table format
3️⃣ Refresh Pivot Tables
4️⃣ Use slicers to filter by month, city, or category
5️⃣ Review KPI cards and charts
6️⃣ Identify high-profit and low-performance areas
7️⃣ Optimize marketing, pricing, and venue strategies
Within minutes, your event data becomes strategic insight.
👥 Who Can Benefit from This Ticketing and Live Events Dashboard in Excel
🎤 Concert Organizers
🏟️ Sports Event Planners
🏢 Corporate Event Managers
🎪 Festival Coordinators
🏛️ Exhibition Organizers
🎟️ Ticketing Agencies
If you sell tickets and manage events, this dashboard gives you clarity and control.