In the telecom industry, network performance is the backbone of customer satisfaction, operational efficiency, and revenue growth. Dropped calls, slow data speeds, or frequent outages can quickly damage brand reputation. To stay ahead, telecom operators must monitor their key performance indicators (KPIs) in real time and take proactive measures to optimize service delivery.
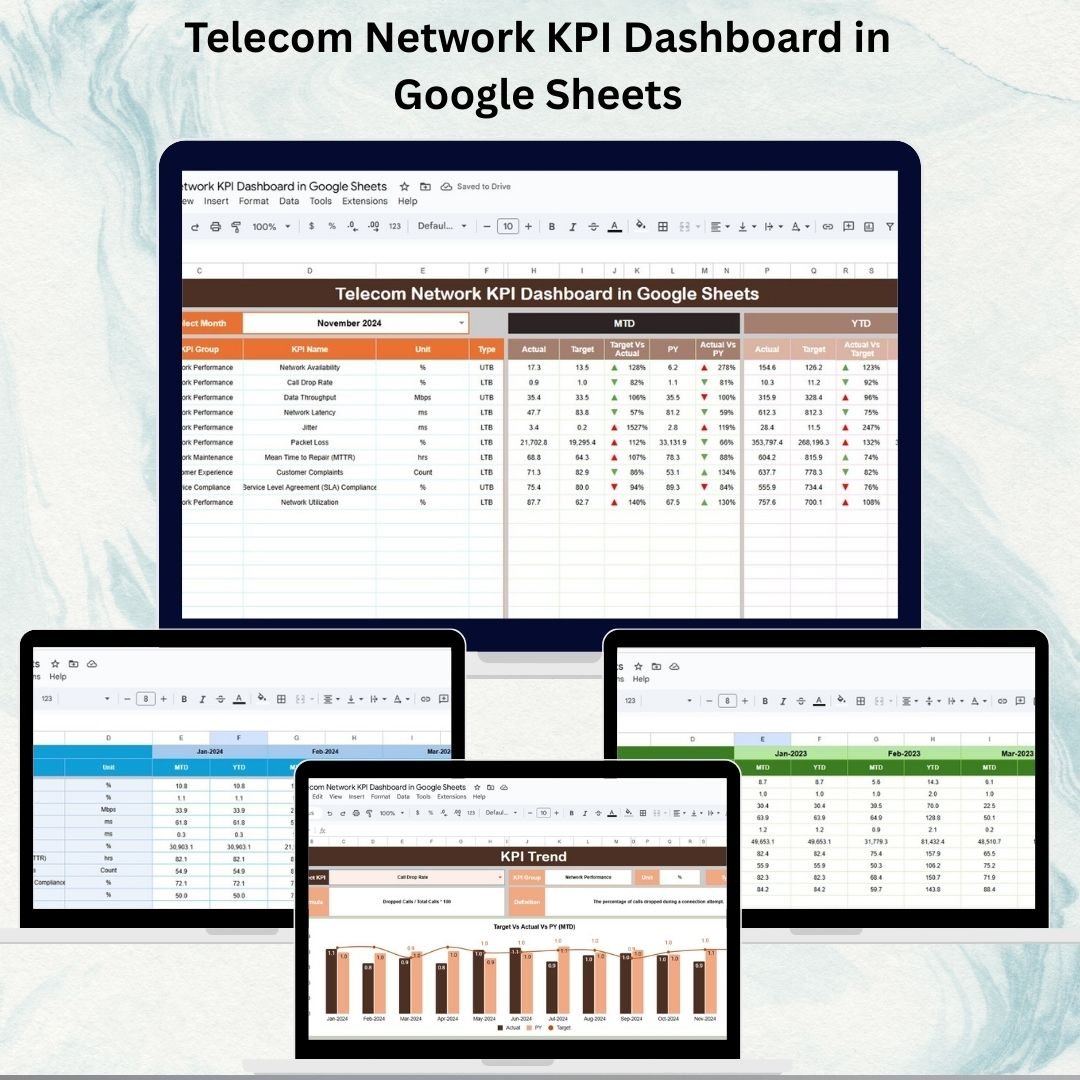
Our Telecom Network KPI Dashboard in Google Sheets is a ready-to-use, interactive, and customizable template designed to help telecom managers, engineers, and analysts track network KPIs effectively. Built entirely in Google Sheets, it requires no advanced technical knowledge and provides instant, visual insights into network performance.
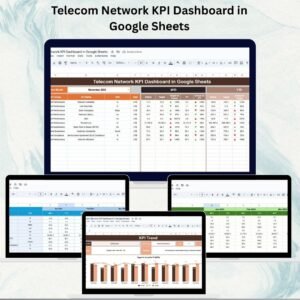
📊 Key Features of the Telecom Network KPI Dashboard
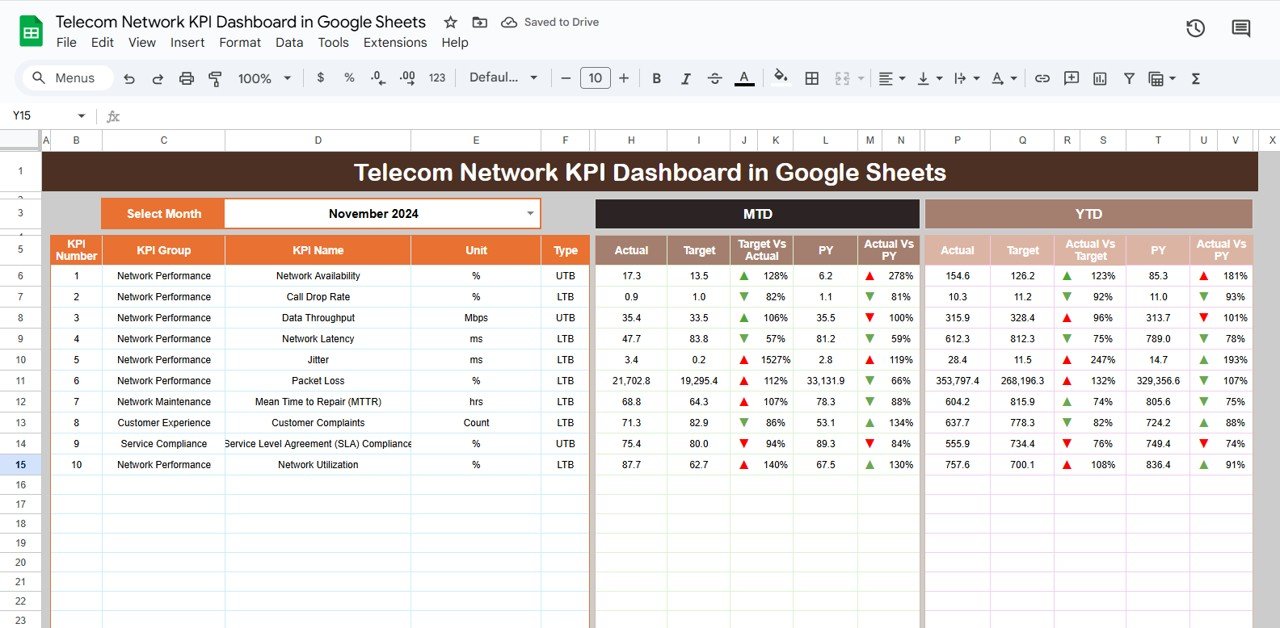
1️⃣ Dashboard Sheet – Centralized Performance View
The Dashboard Sheet serves as the main hub for performance tracking.
-
Month Selection Dropdown: Choose any month (cell D3) to instantly update all metrics.
-
MTD (Month-to-Date) Metrics: Actual vs Target vs Previous Year (PY) with arrows for trend analysis.
-
YTD (Year-to-Date) Metrics: Compare year-to-date performance against targets and previous year numbers.
-
Conditional Formatting: Visual cues (green/red arrows) highlight areas of improvement or decline.
This sheet provides real-time visibility into network KPIs at both monthly and yearly levels.
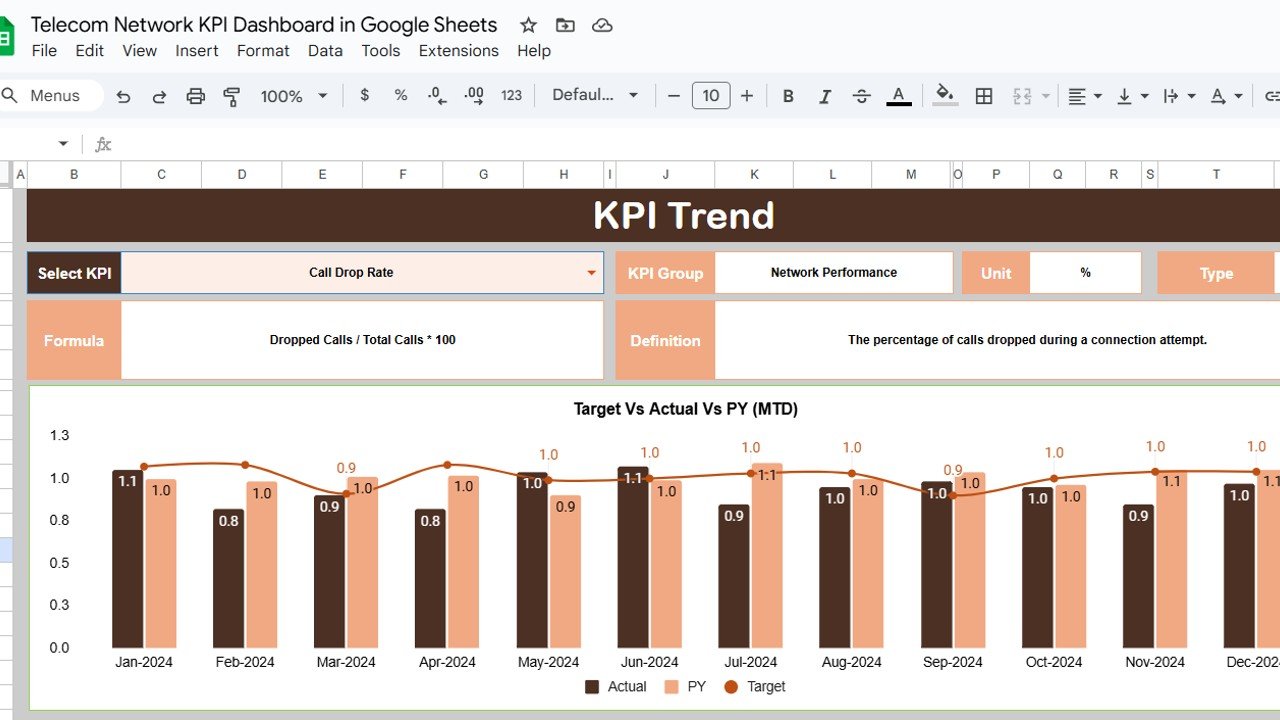
2️⃣ KPI Trend Sheet – Detailed KPI Analysis
The KPI Trend Sheet enables in-depth analysis of individual metrics:
-
Select any KPI from the dropdown (cell C3).
-
View KPI Group, Unit, Formula, Definition, and Type (LTB = Lower the Better, UTB = Upper the Better).
-
Analyze historical performance trends across months and years.
Perfect for drilling down into specific KPIs like call drop rate, data throughput, or network downtime.
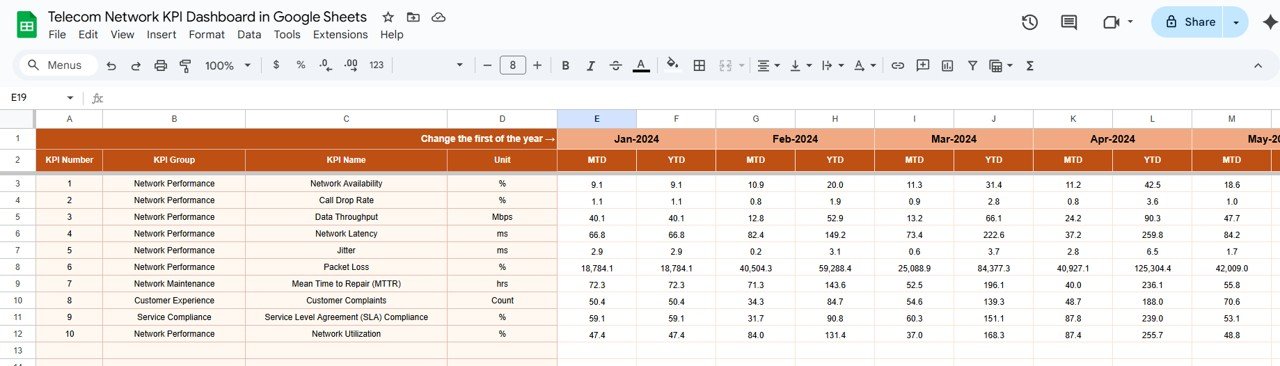
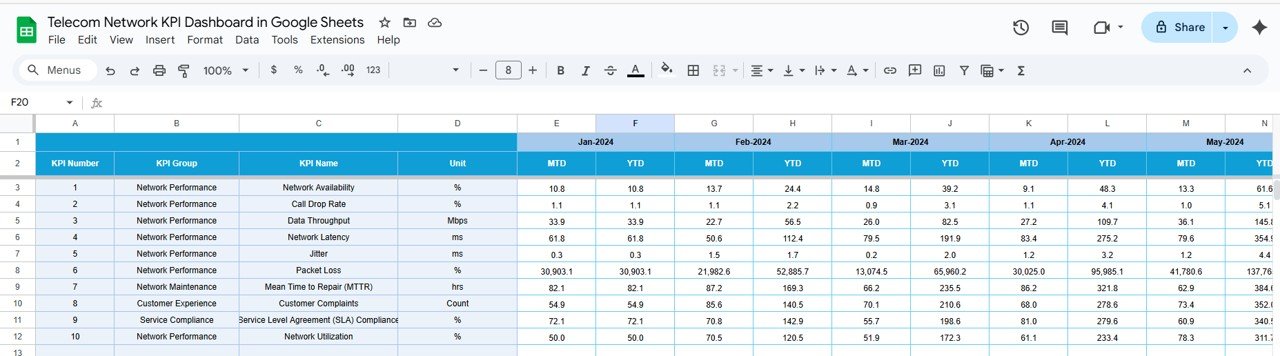
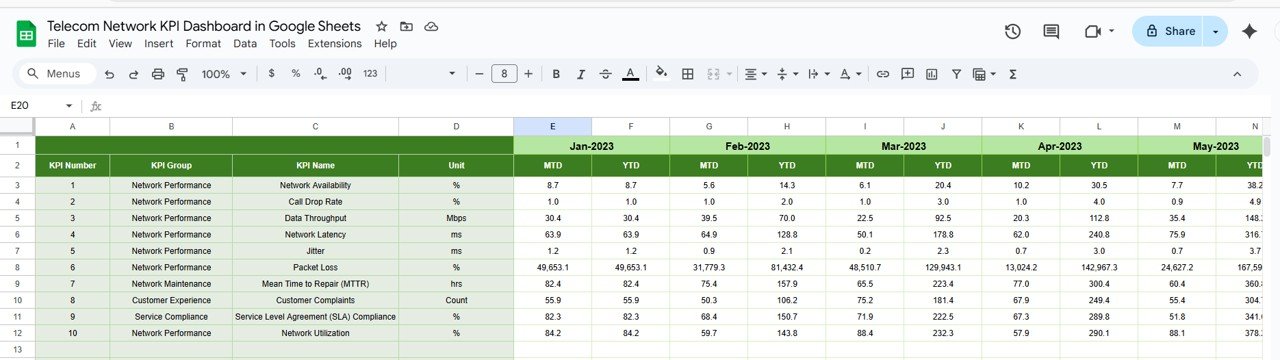
3️⃣ Actual Numbers Sheet – Real Data Entry
This sheet captures actual performance metrics:
-
Enter MTD and YTD actuals for each KPI.
-
Change the month in cell E1 to auto-refresh dashboard metrics.
Keeps your dashboard updated with the latest network data.
4️⃣ Target Sheet – Set Performance Benchmarks
The Target Sheet allows you to define monthly and yearly KPI goals:
-
Input MTD and YTD target values.
-
Compare actual performance against benchmarks to spot underperforming areas.
5️⃣ Previous Year Numbers Sheet – Historical Comparison
Enter last year’s KPI numbers to:
-
Compare current results with previous year metrics.
-
Track year-over-year improvements or declines.
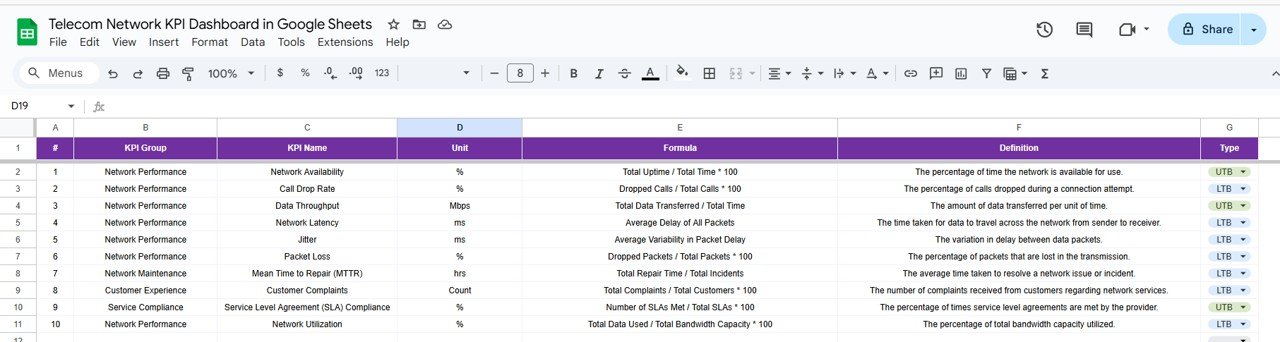
6️⃣ KPI Definition Sheet – Clear Reference Guide
Provides a structured definition of all KPIs, including:
-
KPI Name & Group
-
Unit of Measurement
-
Formula Used
-
KPI Definition
-
Indicator Type (LTB/UTB)
Ensures consistency in KPI tracking and helps new team members quickly adapt.
🌟 Advantages of the Telecom Network KPI Dashboard
✅ Centralized Monitoring – Manage all KPIs in one interactive file.
✅ Real-Time Updates – Update actuals monthly for instant reporting.
✅ Trend Analysis – Compare Actual vs Target vs Previous Year.
✅ Visual Insights – Cards, charts, and arrows for quick interpretation.
✅ Collaboration-Friendly – Built in Google Sheets for easy sharing.
✅ Decision-Making Tool – Empower managers to reduce downtime and optimize network quality.
🛠️ How to Use the Dashboard
-
Enter Actual Data – Update KPI actuals in the Actual Numbers Sheet.
-
Set Targets – Define goals in the Target Sheet.
-
Review Dashboard – Monitor MTD and YTD performance visually.
-
Analyze Trends – Use the KPI Trend Sheet for detailed insights.
-
Compare Yearly Data – Refer to the Previous Year Sheet for benchmarking.
-
Consult KPI Definitions – Use the Definition Sheet for clarity.
✅ Best Practices
-
Update actuals promptly each month.
-
Keep targets realistic and consistent across departments.
-
Focus on critical KPIs like uptime, SLA compliance, and call success rates.
-
Use conditional formatting to highlight high-risk areas.
-
Conduct monthly and quarterly reviews for long-term strategy.
⚡ Opportunities for Improvement
-
Integrate with network monitoring tools for automated data entry.
-
Add predictive analytics to forecast future performance.
-
Include regional or customer-segment breakdowns for deeper insights.
-
Develop alerts for KPIs falling below thresholds.
🎯 Conclusion
The Telecom Network KPI Dashboard in Google Sheets is an essential tool for telecom operators aiming to enhance network reliability, customer satisfaction, and operational efficiency. With MTD/YTD performance tracking, KPI trends, and real-time dashboards, this template ensures proactive management of telecom operations.
Stay ahead of issues, improve decision-making, and deliver exceptional customer experiences with this easy-to-use Google Sheets dashboard.
🔗 Click here to read the Detailed blog post
Watch the step-by-step video Demo:


Reviews
There are no reviews yet.