


Key Features of Team Collaboration KPI Dashboard in Excel ✨
Collaboration is the backbone of high-performing organizations, but measuring it effectively can be tricky. That’s why the Team Collaboration KPI Dashboard in Excel is designed to give you crystal-clear insights into how your teams are working together.
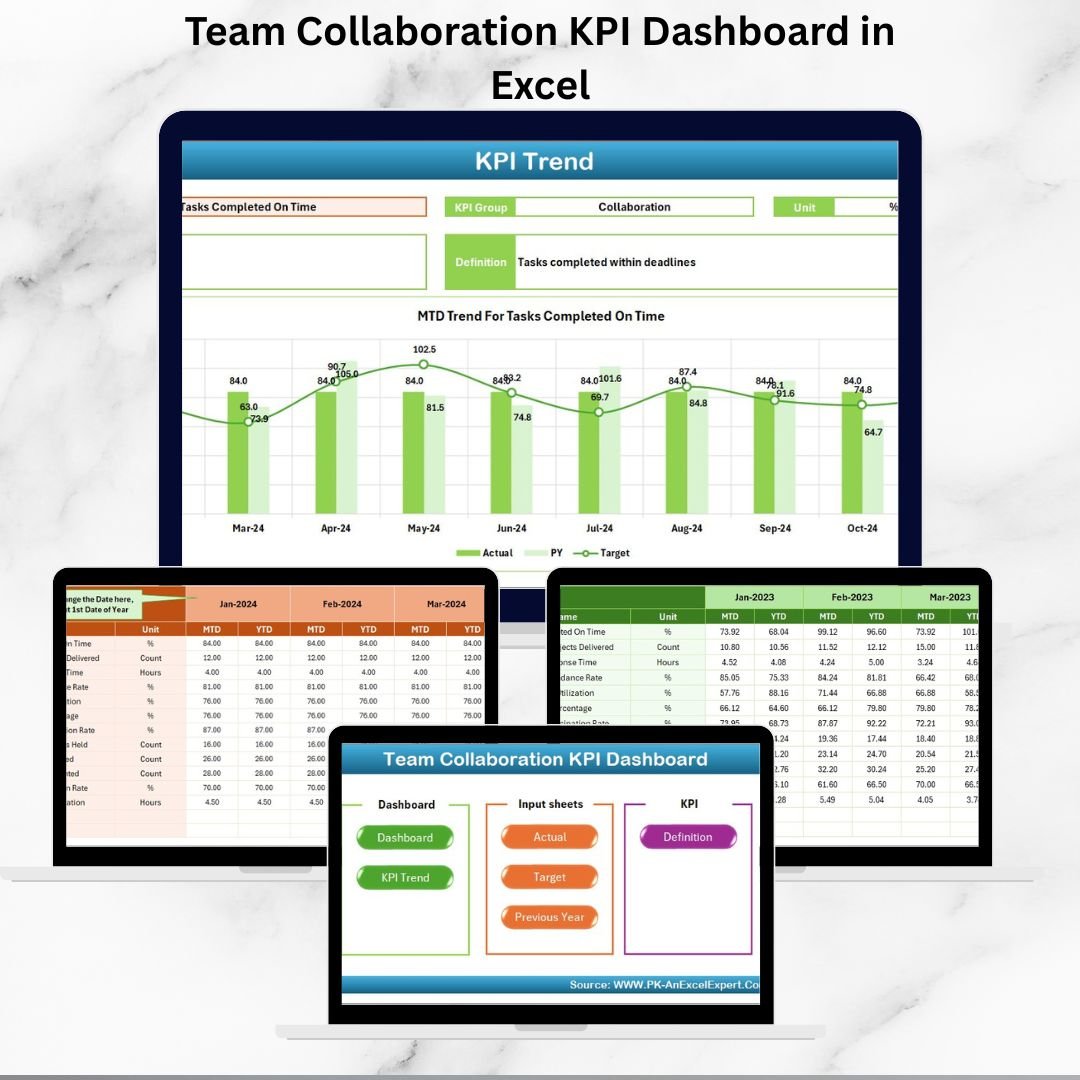
This dashboard comes with 7 powerful sheets—Home, Dashboard, KPI Trend, Actual Numbers Input, Target, Previous Year Numbers, and KPI Definition. Each sheet plays a role in providing a complete 360° view of team collaboration. From drop-down driven filters to conditional formatting with arrows and traffic-light indicators, this tool goes beyond reporting—it becomes your decision-making partner.Team Collaboration KPI Dashboard in Excel

🚀 Key highlights include:
-
MTD (Month-to-Date) & YTD (Year-to-Date) comparisons
-
Dynamic drop-down selections for KPIs and months
-
Actual vs. Target vs. Previous Year comparisons
-
Automatically refreshed charts and progress visuals
-
Clear KPI definitions for total transparency
What’s Inside the Team Collaboration KPI Dashboard 📊
When you purchase this digital product, you’ll receive a ready-to-use Excel file that is already structured and formatted to save you countless hours of setup.
Here’s what’s inside:
-
Home Sheet: One-click navigation to all other sheets.
-
Dashboard Sheet: Interactive view of MTD and YTD performance with charts, arrows, and conditional formatting.
-
KPI Trend Sheet: Drill-down analysis of each KPI with actual, target, and PY data trends.
-
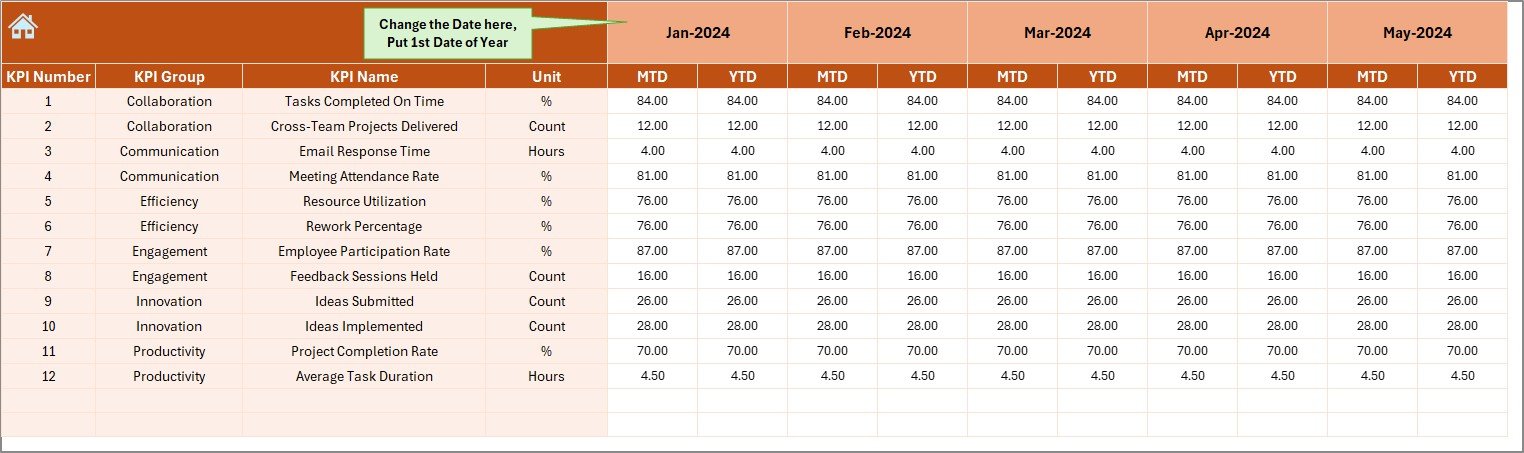
Actual Numbers Input Sheet: Easy data entry for all KPIs.
-
Target Sheet: Define your monthly and yearly targets for benchmarking.
-
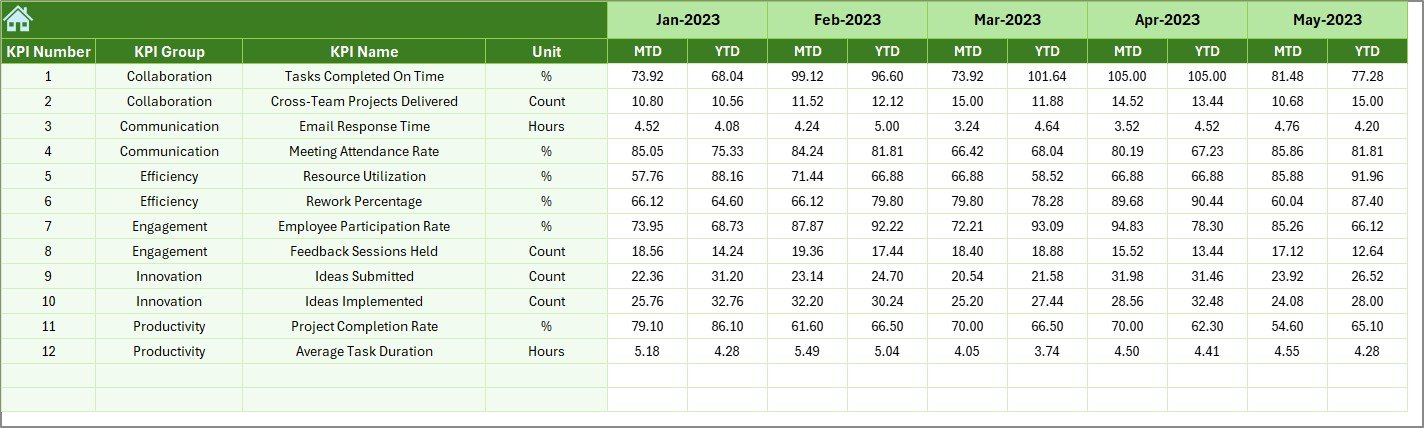
Previous Year Numbers Sheet: Store historical performance for comparison.
-
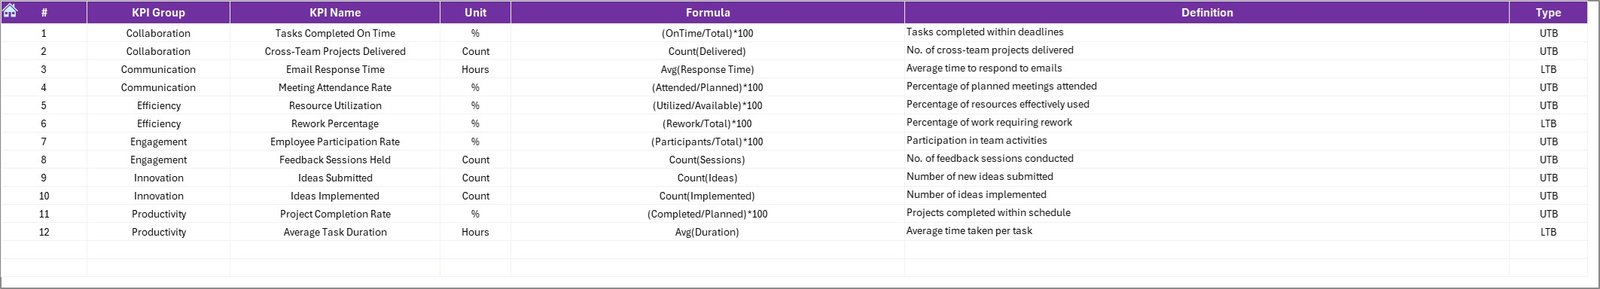
KPI Definition Sheet: Complete blueprint of KPI groups, names, formulas, and units.
You’re not just buying a template—you’re buying a business solution designed to elevate collaboration insights in real-time.
How to Use the Team Collaboration KPI Dashboard 🛠️
Getting started is simple—even if you’re not an Excel expert.
-
Enter Actual Data: Input monthly and yearly performance values in the Actual Numbers Input Sheet.
-
Set Targets: Define MTD & YTD benchmarks in the Target Sheet.
-
Choose Periods: Use drop-down menus to select the month or KPI you want to analyze.
-
View Results: Navigate to the Team Collaboration KPI Dashboard in Excel
-
Compare Performance: Easily review Actual vs. Target vs. Previous Year values to spot gaps and strengths.
No need for complex coding or formulas—the template does the heavy lifting for you.
Who Can Benefit from This Team Collaboration KPI Dashboard 👥
This dashboard is versatile and can be used across industries:
-
Corporate Teams – Track cross-departmental collaboration.
-
Educational Institutions – Monitor collaboration between staff, faculty, and students.
-
Healthcare Organizations – Improve teamwork among doctors, nurses, and administration.
-
Nonprofits – Measure volunteer collaboration and campaign execution.
-
Startups – Ensure small teams are aligned and working together effectively.
Whether you’re a manager, HR leader, project owner, or executive, this tool ensures you always have measurable insights into collaboration.


Reviews
There are no reviews yet.