
Managing tax advisory operations without real-time visibility is risky in today’s fast-changing compliance environment. Missed deadlines, unclear performance metrics, and delayed reviews can directly impact client trust. That is exactly why the Tax Advisory KPI Dashboard in Power BI is a game-changing digital solution for modern tax professionals.Tax Advisory KPI Dashboard in Power BI
This ready-to-use Power BI dashboard transforms raw tax data into powerful visual insights. Instead of juggling multiple Excel files and static reports, you get a single, automated dashboard that tracks every critical KPI—monthly, yearly, and historically. As a result, decision-making becomes faster, sharper, and more confident.
Built for tax advisory firms, consultants, and finance professionals, this dashboard combines Excel-based data entry with Power BI visualization power, ensuring ease of use without sacrificing analytical depth.
✅ Key Features of Tax Advisory KPI Dashboard in Power BI
🚀 Centralized Tax KPI Monitoring
Track all tax advisory KPIs in one unified dashboard with structured tables and clean visuals.
📅 MTD & YTD Performance Tracking
Instantly measure Month-to-Date and Year-to-Date performance for better control over compliance timelines.
🎯 Target vs Actual Comparison
Identify achievement gaps using automated variance percentages and visual status indicators.
📈 Current Year vs Previous Year Analysis
Understand improvement patterns with CY vs PY comparisons across MTD and YTD metrics.
📊 Interactive Slicers & Filters
Slice data by Month and KPI Group for instant, focused analysis.
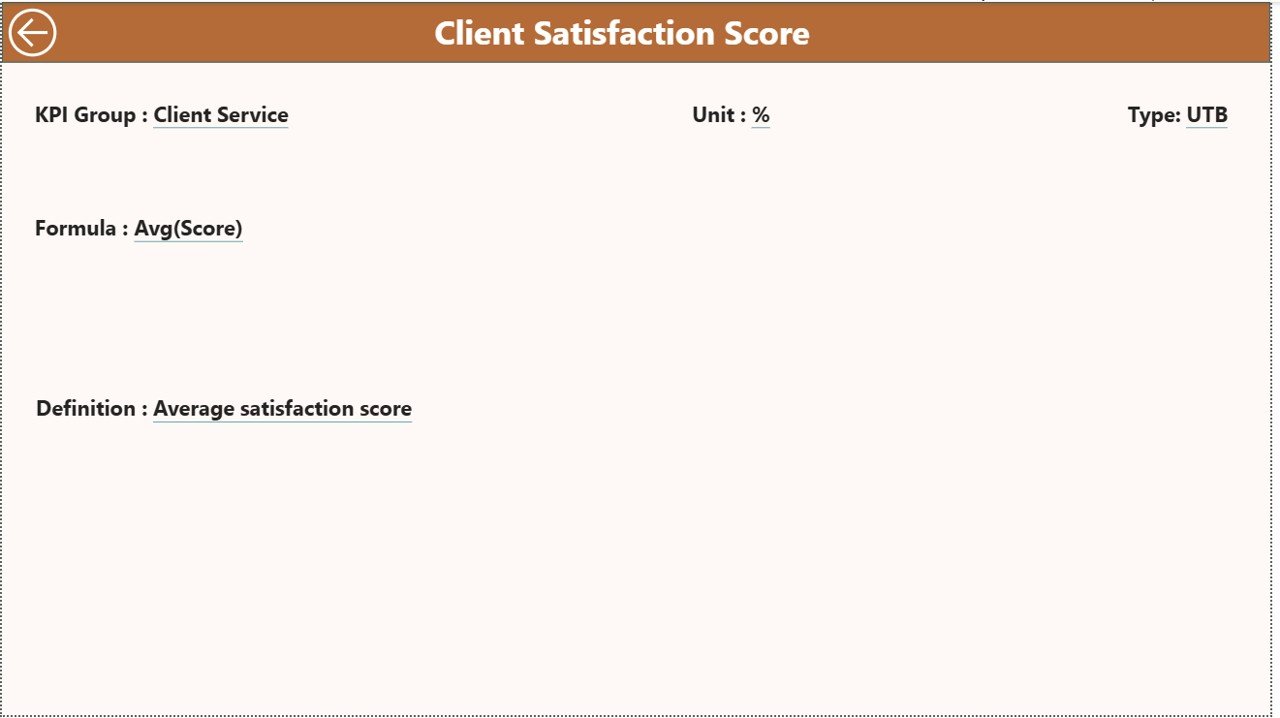
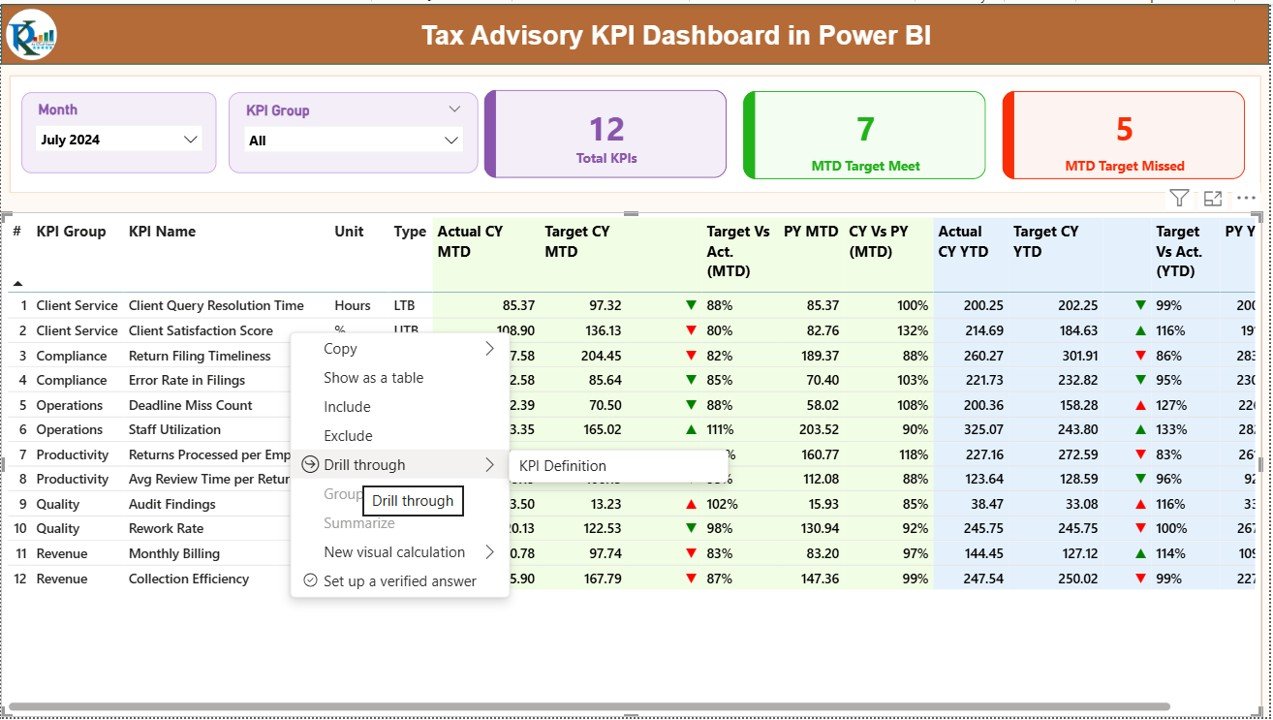
🔍 Drill-Through KPI Definitions
Click any KPI to understand its definition, formula, and business intent.
⚡ Automated & Error-Free Calculations
Eliminate manual errors with Power BI-driven calculations and refresh logic.
📦 What’s Inside the Tax Advisory KPI Dashboard in Power BI
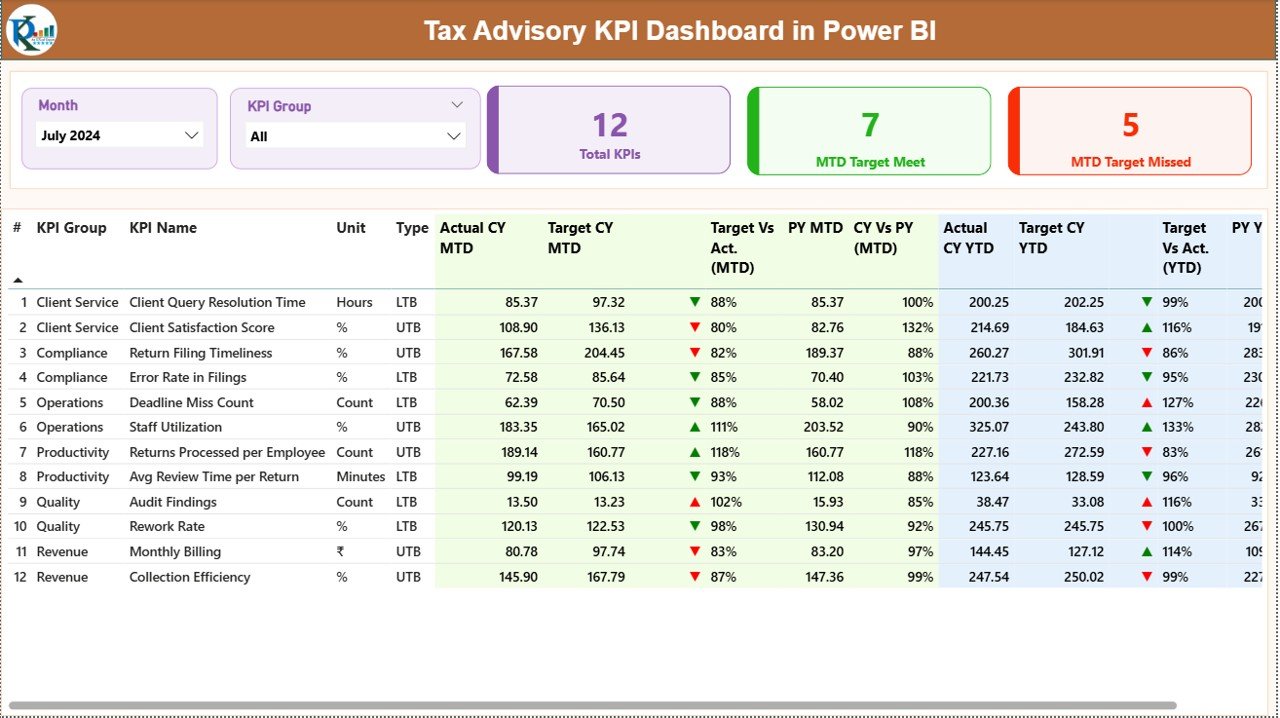
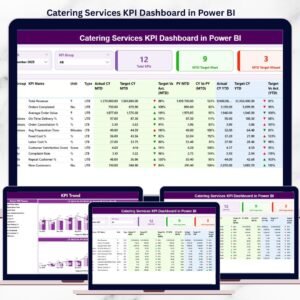
📄 Summary Page
Your central control panel featuring slicers, KPI cards, and a detailed KPI table with conditional formatting icons.Tax Advisory KPI Dashboard in Power BI
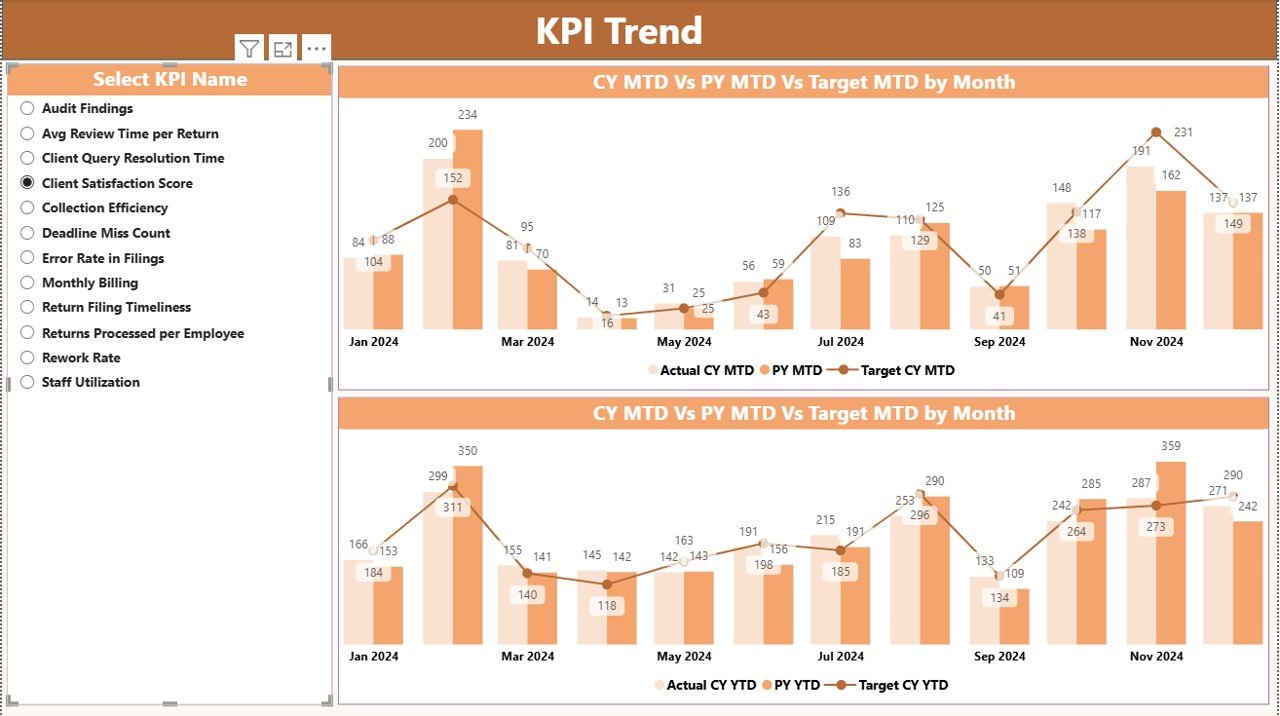
📉 KPI Trend Page
Powerful combo charts comparing Actual vs Target vs Previous Year for both MTD and YTD metrics.
📘 KPI Definition Page (Drill-Through)
A hidden insight page explaining KPI formulas, definitions, and measurement logic.
📊 Excel Data Structure
Well-organized Excel sheets for:
-
Input_Actual (Actual performance data)
-
Input_Target (Target benchmarks)
-
KPI Definition (Master KPI list)
This structure ensures smooth updates and accurate dashboard refreshes.Tax Advisory KPI Dashboard in Power BI
🛠️ How to Use the Tax Advisory KPI Dashboard in Power BI
✅ Step 1: Enter KPI actuals and targets into the provided Excel sheets
✅ Step 2: Refresh the Power BI dashboard
✅ Step 3: Use slicers to filter Month and KPI Group
✅ Step 4: Review KPI cards, tables, and trend charts
✅ Step 5: Drill through KPIs for deeper understanding
No coding. No complex modeling. Just clean data and instant insights.
👥 Who Can Benefit from This Tax Advisory KPI Dashboard in Power BI
👔 Tax Advisory Firms
📑 Accounting & Audit Professionals
📊 Tax Managers & Partners
🧾 Compliance Teams
💼 Finance Consultants
🏢 Professional Services Firms
If you work with tax data and performance measurement, this dashboard is built for you.
By using this dashboard, tax firms experience better compliance control, faster responses, improved accuracy, and stronger client satisfaction. More importantly, it replaces outdated static reports with a future-ready analytical approach.
🔗 Click here to read the detailed blog post
Watch the step-by-step video tutorial:
👉 Visit our YouTube channel to learn step-by-step video tutorials
YouTube.com/@PKAnExcelExpert


Reviews
There are no reviews yet.