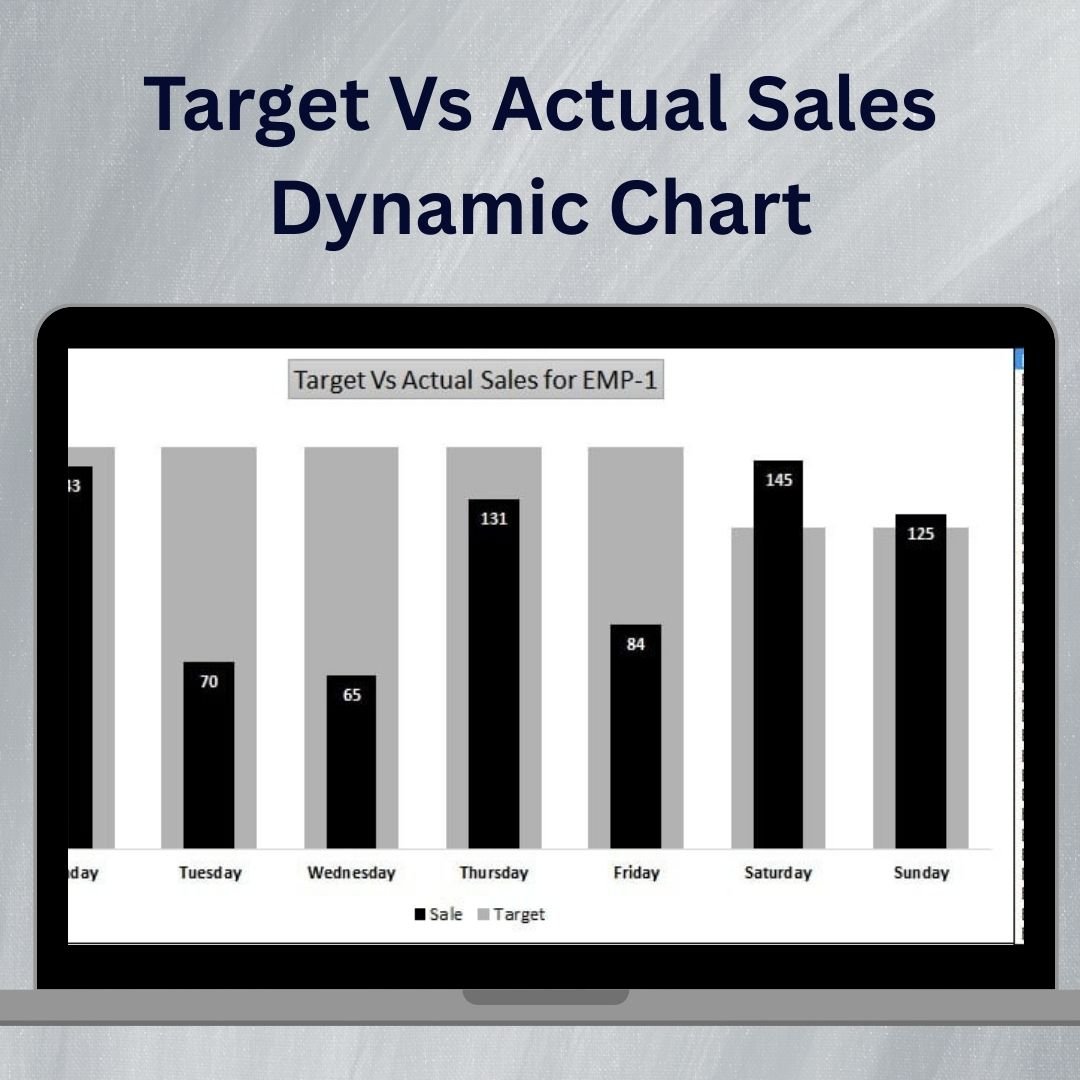
The Target vs Actual Sales Dynamic Chart is an interactive and visually appealing tool designed to help businesses, sales teams, and managers track and compare their target sales with actual sales performance. This Excel-based chart offers a clear visual representation of sales performance over time, helping you identify trends, track progress, and make data-driven decisions to improve your sales strategies.
The chart is dynamic, updating in real-time as you input new data, allowing you to compare your sales targets with actual performance across different time periods, such as weekly, monthly, or quarterly. Whether you’re tracking sales for individual products, regions, or sales reps, this dynamic chart helps you visualize gaps, identify opportunities for improvement, and keep your sales team motivated to reach their targets.
Key Features of the Target vs Actual Sales Dynamic Chart
📊 Real-Time Data Updates
The dynamic chart automatically updates when new data is entered, ensuring that your sales tracking is always up-to-date and reflective of the latest performance.
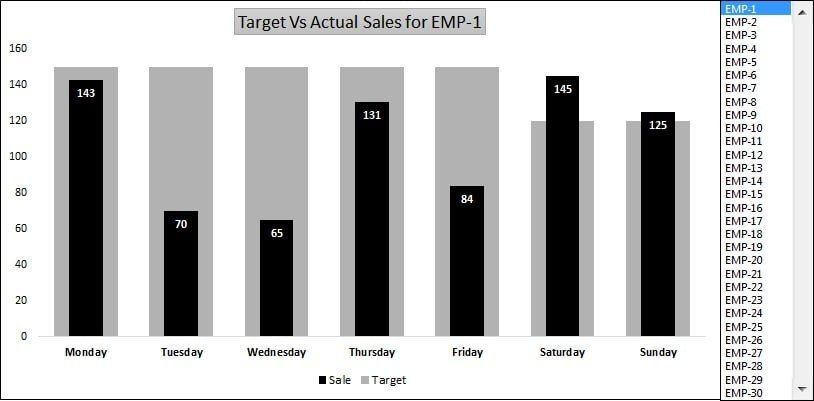
📈 Clear Visual Comparisons
Easily compare target sales with actual sales performance using bar charts or line graphs. The visual format makes it easy to spot trends and understand where you’re falling short or exceeding expectations.
📉 Track Sales Progress Over Time
Monitor sales performance over weeks, months, or quarters, and assess how well you are meeting sales goals over time. This helps you make adjustments to strategies quickly and efficiently.
🎯 Set Customizable Sales Targets
Define your sales targets for different time periods, products, or regions. The chart allows you to set specific goals and compare them against actual sales data to identify performance gaps.
📊 Interactive & Customizable Chart
The Excel template includes interactive features such as slicers and dropdown menus, allowing you to filter and compare sales data across various metrics and timeframes.
Why You’ll Love the Target vs Actual Sales Dynamic Chart
✅ Track Sales Performance with Ease
Quickly compare target sales with actual sales data to track performance across time periods and identify areas for improvement.
✅ Make Data-Driven Decisions
Use real-time data to adjust your sales strategies, identify underperforming products or regions, and take action to improve results.
✅ Motivate Your Sales Team
Visualize performance gaps and celebrate achievements by clearly seeing how the actual sales compare to targets. This motivates your team to meet or exceed goals.
✅ Identify Trends & Opportunities
Spot sales trends and identify opportunities for growth or adjustments by monitoring actual sales versus targets over time.
✅ Fully Customizable for Your Business
Tailor the chart to meet your specific sales tracking needs, whether you’re tracking individual products, regions, sales reps, or specific campaigns.
What’s Inside the Target vs Actual Sales Dynamic Chart Template?
- Real-Time Data Integration: Automatically update the chart as you input sales data.
- Dynamic Sales Tracking: Compare target sales with actual sales for various time periods (week, month, quarter).
- Customizable Target Setting: Set and track your sales targets for different products, regions, or sales teams.
- Interactive Chart: Use slicers and filters to adjust views and analyze specific sales data.
- Visual Comparison: Track and compare sales performance using bar charts, line graphs, and other visual representations.
- Customizable KPIs: Tailor the chart to track different sales KPIs such as revenue, units sold, and more.
How to Use the Target vs Actual Sales Dynamic Chart in Excel
1️⃣ Download the Template: Get immediate access to the Target vs Actual Sales Dynamic Chart in Excel.
2️⃣ Input Your Sales Data: Enter your actual sales data and sales targets for different time periods and metrics.
3️⃣ Track Sales Progress: Use the chart to compare target and actual sales performance over time.
4️⃣ Analyze & Adjust: Spot trends, identify underperforming areas, and make data-driven decisions to optimize sales performance.
Who Can Benefit from the Target vs Actual Sales Dynamic Chart?
🔹 Sales Managers & Team Leaders
🔹 Business Owners & Entrepreneurs
🔹 Sales Analysts & Data Professionals
🔹 Marketing Teams & Product Managers
🔹 Anyone Looking to Track & Optimize Sales Performance
Track your sales targets and actual performance with the Target vs Actual Sales Dynamic Chart. Make informed decisions, identify performance gaps, and optimize your sales strategies to drive better results.
Click here to read the Detailed blog post
Visit our YouTube channel to learn step-by-step video tutorials
Youtube.com/@PKAnExcelExpert


Reviews
There are no reviews yet.