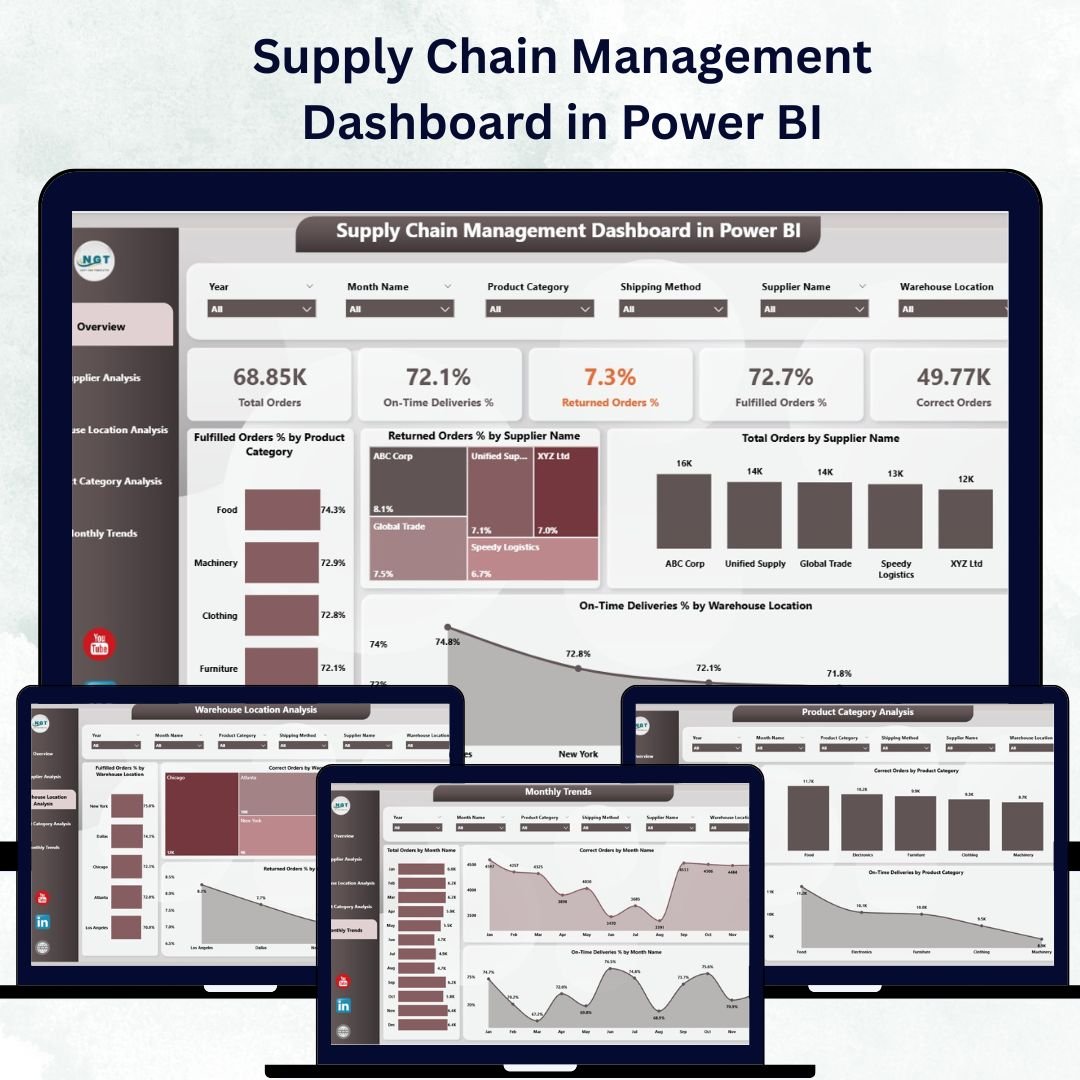
In today’s complex business environment, managing supply chain performance demands accuracy, agility, and visibility. The Supply Chain Management Dashboard in Power BI offers all three — transforming raw logistics data into meaningful, visual insights that drive faster and smarter decision-making.
Built using Microsoft Power BI and powered by Excel data, this dynamic and interactive dashboard helps organizations monitor supplier reliability, warehouse efficiency, product performance, and delivery timelines — all in one place. Whether you manage procurement, logistics, or operations, this dashboard gives you a 360° view of your entire supply chain network.
⚙️ Key Features of the Supply Chain Management Dashboard in Power BI
This dashboard is divided into five analytical pages, each designed to focus on a specific layer of supply chain performance. Together, they create a powerful, data-driven decision-making tool.
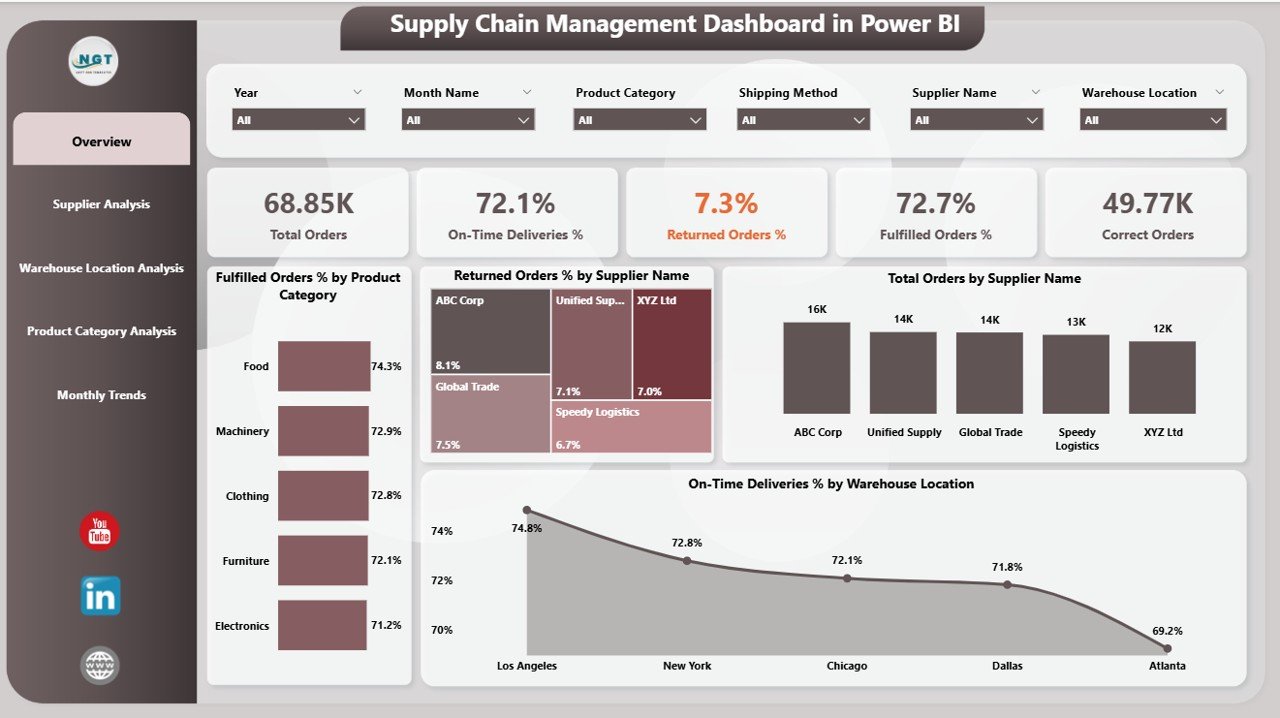
🏠 1️⃣ Overview Page – The Central Command Hub
The Overview Page acts as your strategic control center, displaying all critical metrics in one snapshot.
Highlights:
-
KPI Cards: Total Orders, Fulfilled Orders, Return %, On-Time Delivery %, and Correct Order %.
-
Interactive Visuals:
-
Fulfilled Order % by Product Category
-
Return Order % by Supplier Name
-
Total Orders by Supplier Name
-
On-Time Deliveries % by Warehouse Location
-
This top-level summary helps managers instantly identify performance bottlenecks and success areas across the supply chain.
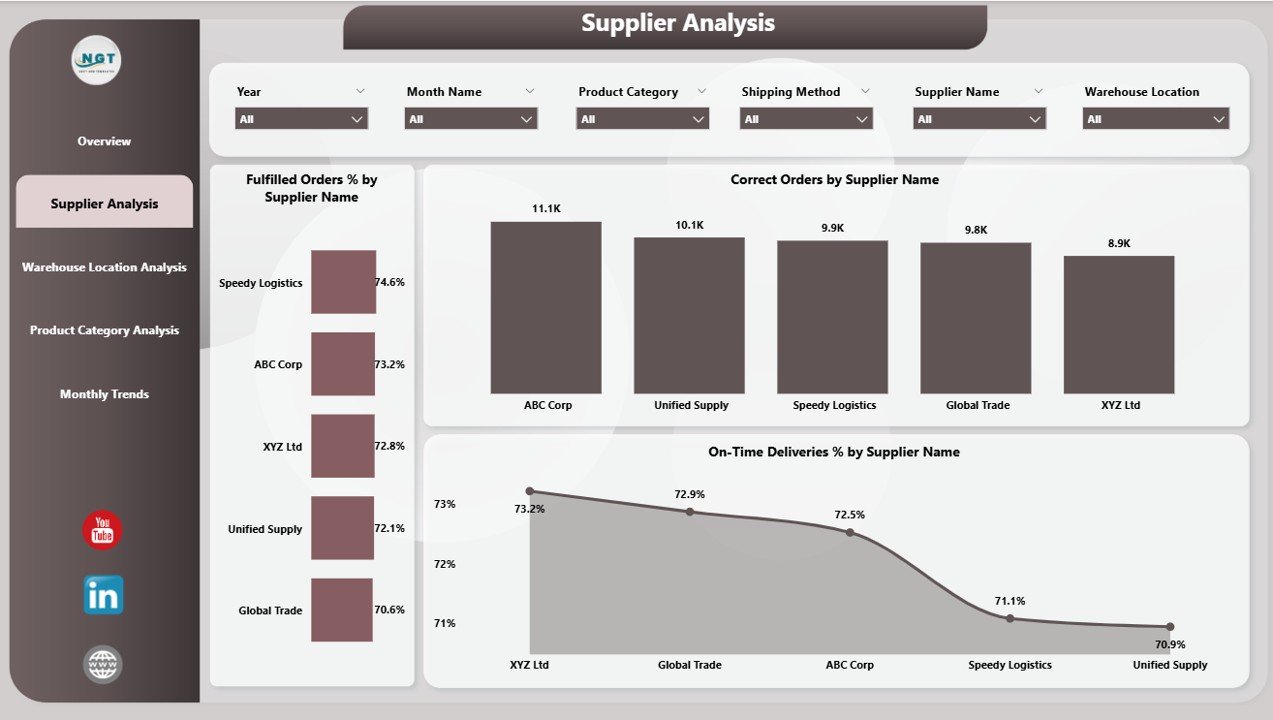
🏢 2️⃣ Supplier Analysis Page – Evaluate Supplier Reliability
The Supplier Analysis Page dives deeper into supplier-level performance metrics.
Charts Include:
-
Fulfilled Order % by Supplier
-
Correct Order % by Supplier
-
On-Time Deliveries % by Supplier
Purpose:
Quickly identify top-performing suppliers, detect quality issues, and optimize procurement decisions through data-driven comparisons across categories, time periods, or regions.
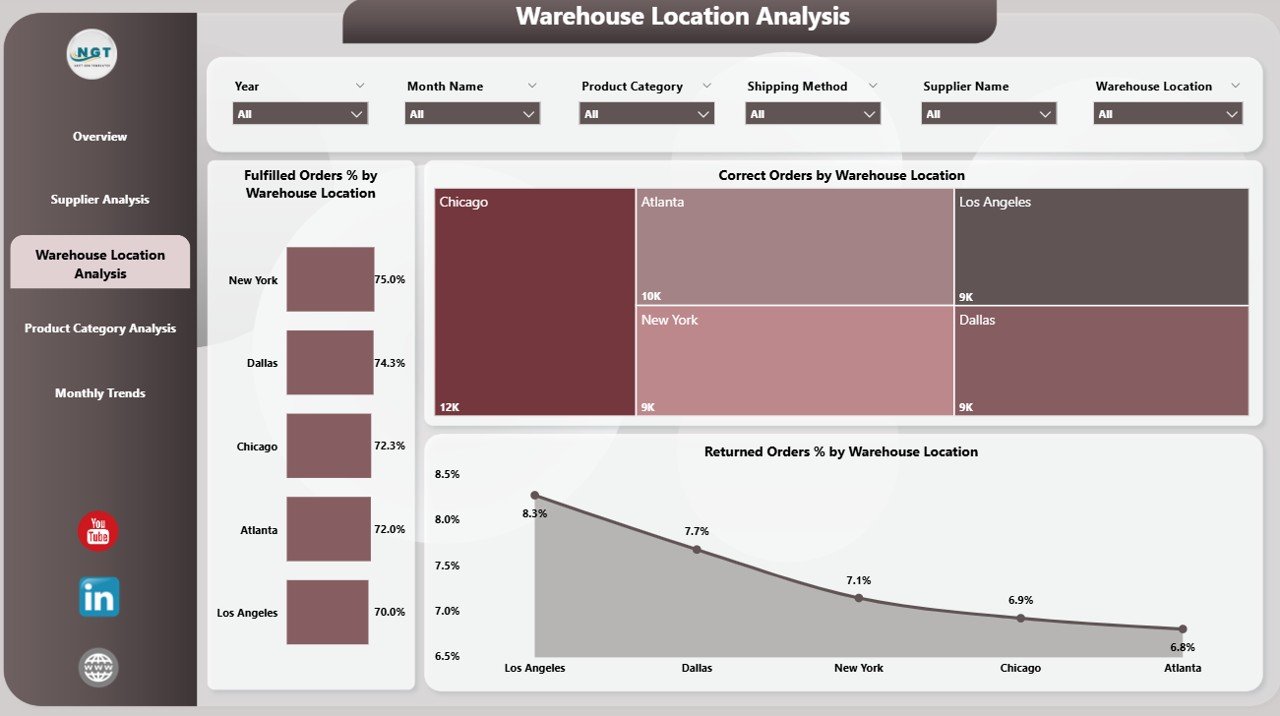
🏭 3️⃣ Warehouse Location Analysis Page – Monitor Operational Efficiency
The Warehouse Location Analysis Page focuses on logistics performance.
Visuals:
-
Fulfilled Order % by Warehouse
-
Correct Order % by Warehouse
-
Returned Order % by Warehouse
This analysis enables logistics teams to pinpoint high-performing locations and address inefficiencies, helping optimize delivery times and reduce return rates.
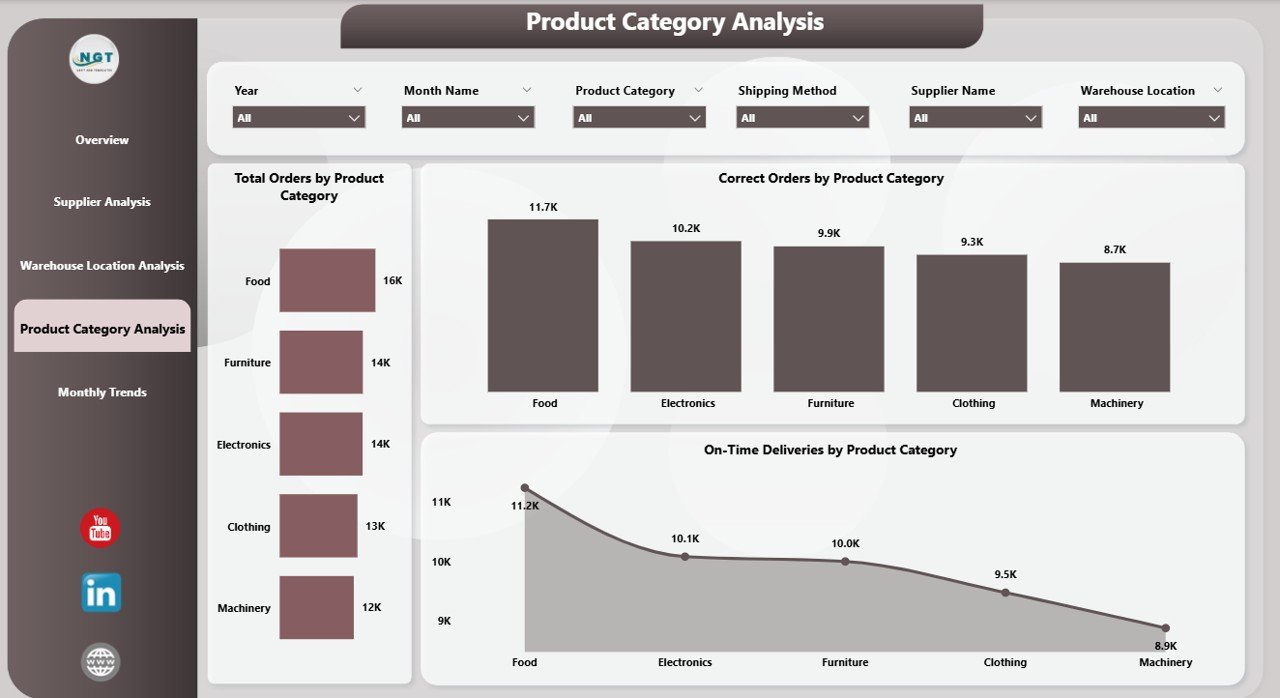
🛒 4️⃣ Product Category Analysis Page – Identify What Drives Performance
Understand product-level insights with powerful visualizations:
-
Total Orders by Product Category
-
Correct Orders by Category
-
On-Time Deliveries by Category
Insight:
Determine which product categories contribute most to profits, which struggle with quality issues, and where improvements are needed in production or packaging.
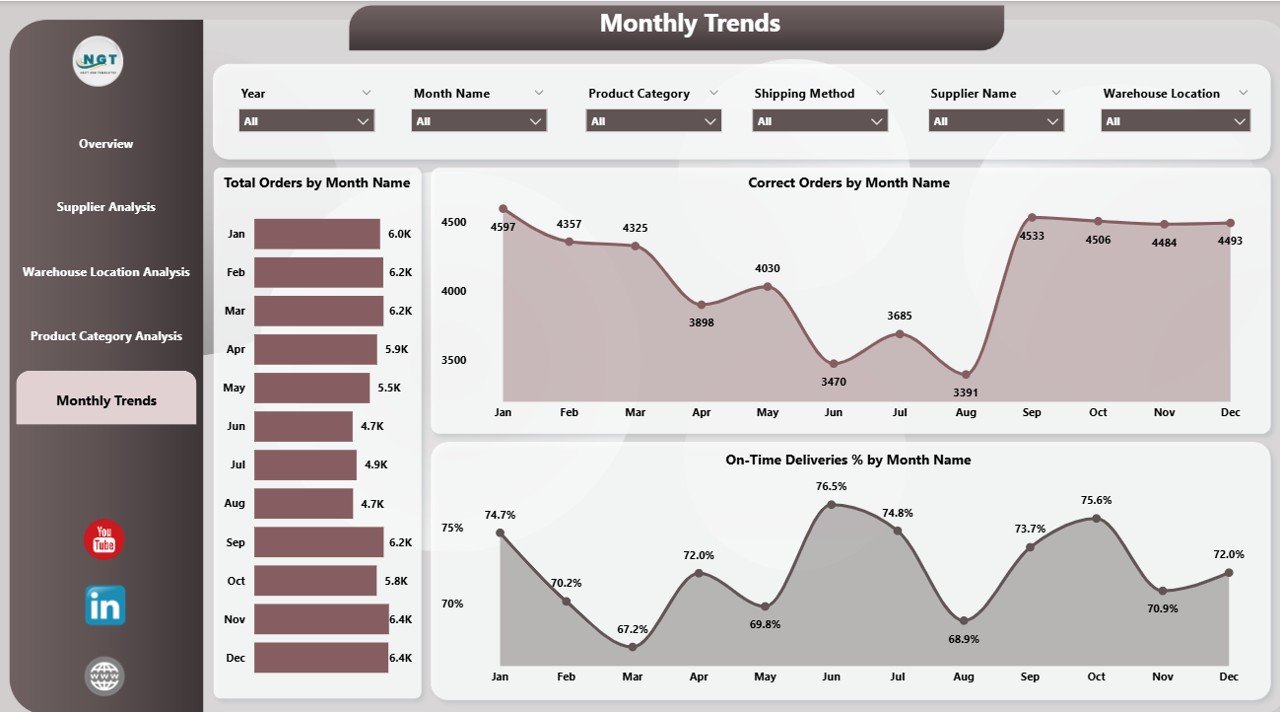
📆 5️⃣ Monthly Trends Page – Track Growth and Seasonality
Monitor time-based performance with trend analysis visuals:
-
Total Orders by Month
-
Correct Orders by Month
-
On-Time Deliveries % by Month
This helps identify seasonal variations, recurring inefficiencies, and opportunities for forecasting demand more accurately.
📊 What’s Inside the Supply Chain Dashboard
✅ 5 Power BI Pages: Overview, Supplier, Warehouse, Product, and Monthly Trends
✅ Excel Data Source Integration: Auto-refresh connections ensure real-time updates
✅ Dynamic Slicers: Filter by Supplier, Month, Product Category, or Warehouse
✅ Interactive Drill-Throughs: Dive deeper into individual KPIs
✅ Customizable Visuals: Modify colors, KPIs, or chart types easily
💡 How to Use the Supply Chain Management Dashboard
1️⃣ Connect Excel Data: Load your structured data containing supplier, order, and delivery information.
2️⃣ Refresh Automatically: Schedule Power BI refresh for daily or weekly updates.
3️⃣ Apply Filters: Use slicers for Month, Supplier, or Category to narrow insights.
4️⃣ Analyze KPIs: Compare Fulfillment %, Returns %, and Delivery Performance across time.
5️⃣ Share Insights: Publish reports for collaboration via Power BI Service.
Within minutes, your dashboard becomes a live monitoring system for supply chain operations.
🌍 Who Can Benefit from This Dashboard
🏭 Manufacturing Companies: Optimize supply, production, and delivery cycles.
📦 Retailers & Distributors: Monitor supplier performance and reduce return rates.
🚚 Logistics Providers: Improve on-time delivery and reduce warehousing costs.
🏢 Procurement Teams: Evaluate vendor efficiency and track purchase trends.
📈 Advantages of the Supply Chain Management Dashboard in Power BI
✔️ Real-Time Visibility: Live data updates ensure instant access to performance metrics.
✔️ Improved Decision-Making: Visual insights reveal inefficiencies and opportunities.
✔️ Supplier Optimization: Transparent performance tracking strengthens vendor partnerships.
✔️ Warehouse Efficiency: Identify and correct logistical delays with precision.
✔️ Cost Reduction: Detect high-cost areas such as return logistics and delivery delays.
✔️ Forecasting: Predict future demand with monthly trend analysis.
🧠 Best Practices for Effective Use
✅ Maintain clean, consistent Excel data.
✅ Define clear KPIs aligned with business objectives.
✅ Automate data refresh schedules in Power BI Service.
✅ Design visuals using clear color themes and logical hierarchy.
✅ Review performance reports regularly for timely action.
✅ Train teams to interpret dashboard insights effectively.
🚀 Why Choose Power BI for Supply Chain Analytics
Unlike static Excel reports, Power BI delivers:
📊 Real-time dashboards
🔄 Automated updates
📱 Mobile accessibility
🎯 Interactive slicers and filters
This makes Power BI the ideal tool for supply chain visibility and operational agility.
🎯 Conclusion
The Supply Chain Management Dashboard in Power BI empowers organizations to transform their logistics and operations with real-time data insights. From tracking fulfillment rates to monitoring supplier and warehouse performance, this dashboard provides a holistic view of your supply chain health.
By connecting Excel data to Power BI visuals, businesses can reduce inefficiencies, cut costs, and improve customer satisfaction — all through one intuitive platform.
This dashboard isn’t just a report — it’s your digital control center for smarter, faster, and data-driven supply chain management.
🔗 Click here to read the Detailed Blog Post
🎥 Visit our YouTube channel for tutorials
🔗 YouTube.com/@PKAnExcelExpert


Reviews
There are no reviews yet.