


In today’s competitive business environment, supply chain management (SCM) is a critical driver of profitability and customer satisfaction. Companies must constantly monitor supplier performance, warehouse efficiency, product demand, and transportation delays. Yet, managing all these aspects manually often leads to errors, inefficiencies, and missed opportunities.
That’s where the Supply Chain Management Dashboard in Excel comes in. 🎯 Built entirely in Excel, this ready-to-use dashboard template helps organizations transform raw supply chain data into clear, interactive insights. By combining pivot tables, slicers, KPIs, and charts, it provides a 360° view of operations—helping managers make faster, data-driven decisions.
Whether you’re running a small business or managing a global supply chain, this Excel dashboard brings structure, visibility, and accuracy to your operations.
✨ Key Features of Supply Chain Management Dashboard in Excel
-
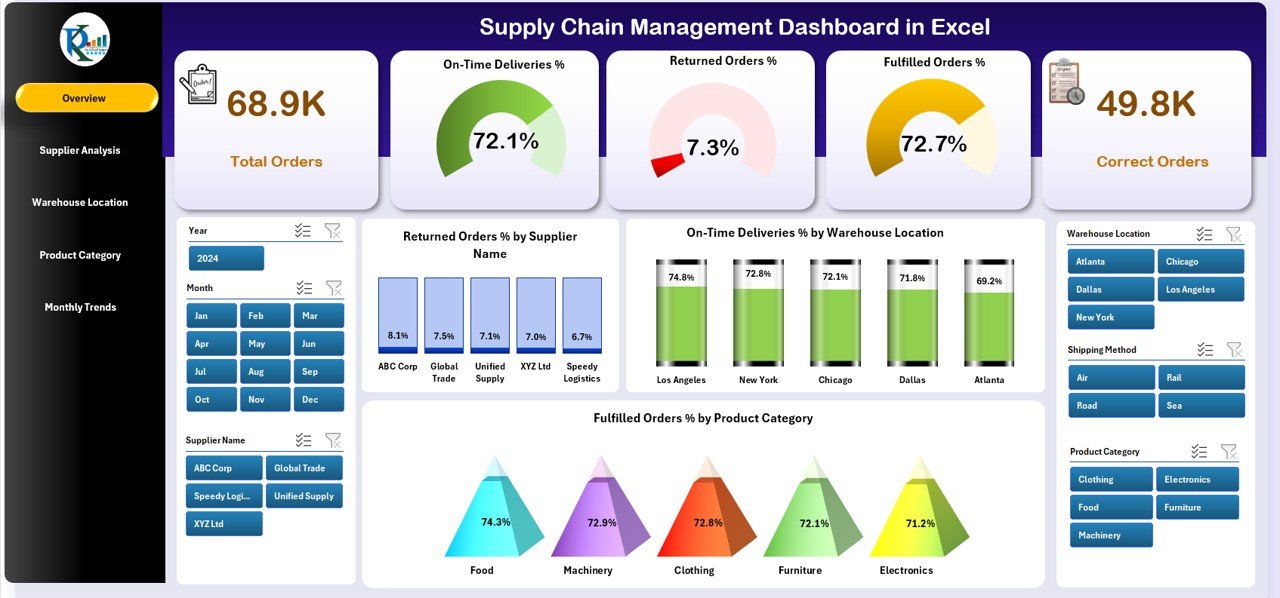
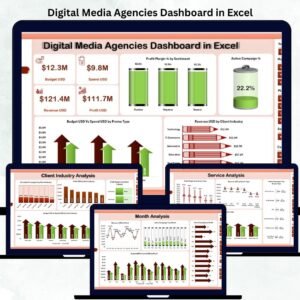
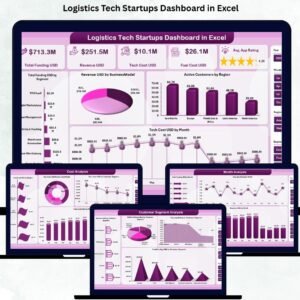
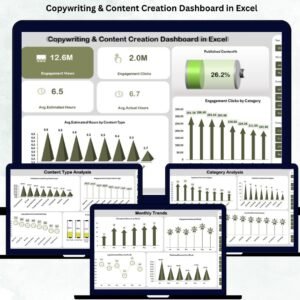
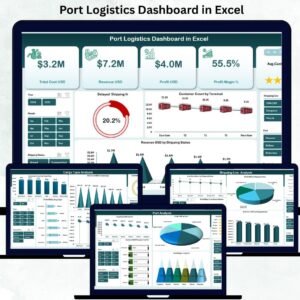
📊 Overview Page – High-level summary of key KPIs like total orders, fulfilled orders, return %, and cost efficiency.
-
📦 Supplier Analysis Page – Evaluate supplier performance with charts for margin, availability %, and cost vs. revenue.
-
🏬 Warehouse Location Analysis Page – Track efficiency with insights on orders, returns, on-time deliveries, and fulfillment rates.
-
🍴 Product Category Analysis Page – Understand demand and performance by product category with detailed charts.
-
📆 Monthly Trends Page – Identify seasonal trends and track shifts in supply chain performance month by month.
-
📂 Data & Support Sheets – Centralized sheets for data entry and dropdown management to keep everything accurate and organized.
-
⚡ Excel-Driven Automation – Built-in formulas and conditional formatting reduce manual errors.
-
🎨 User-Friendly Layout – Clean design, interactive slicers, and dynamic visuals for seamless navigation.
📂 What’s Inside the Supply Chain Management Dashboard
This template is structured into five analytical pages, each delivering actionable insights:
-
Overview Page – Executive summary with KPI cards and charts for supplier, warehouse, and product performance.
-
Supplier Analysis Page – Deep dive into supplier efficiency and profitability.
-
Warehouse Location Analysis Page – Optimize distribution and delivery accuracy.
-
Product Category Analysis Page – Monitor category-wise demand, returns, and fulfillment.
-
Monthly Trends Page – Spot performance fluctuations and seasonal variations.
Supporting these pages are Data Sheets (where you load raw supply chain data) and Support Sheets (for dropdowns, reference lists, and formulas).
🛠 How to Use the Supply Chain Management Dashboard
-
Download & Open the Excel template.
-
Load Your Data into the Data Sheet (orders, returns, costs, etc.).
-
Navigate Pages using the built-in page navigator on the dashboard.
-
Apply Slicers to filter results by supplier, warehouse, product, or time period.
-
Review KPIs & Charts – Compare performance across categories, suppliers, and regions.
-
Track Monthly Trends – Use historical data to forecast demand and optimize resources.
-
Update Regularly – Refresh the Data Sheet weekly or monthly for accurate insights.
👥 Who Can Benefit from This Supply Chain Management Dashboard
This tool is designed for supply chain professionals across industries:
-
🏭 Manufacturers – Track production flow, supplier efficiency, and cost management.
-
🛒 Retailers & E-commerce – Monitor product availability, demand trends, and fulfillment rates.
-
🚚 Logistics Companies – Optimize warehouse operations and delivery accuracy.
-
💼 Supply Chain Managers – Gain visibility into end-to-end supply chain performance.
-
📊 Business Owners – Make smarter decisions with centralized, easy-to-understand data.
📌 Click here to read the Detailed blog post
Visit our YouTube channel to learn step-by-step video tutorials


Reviews
There are no reviews yet.