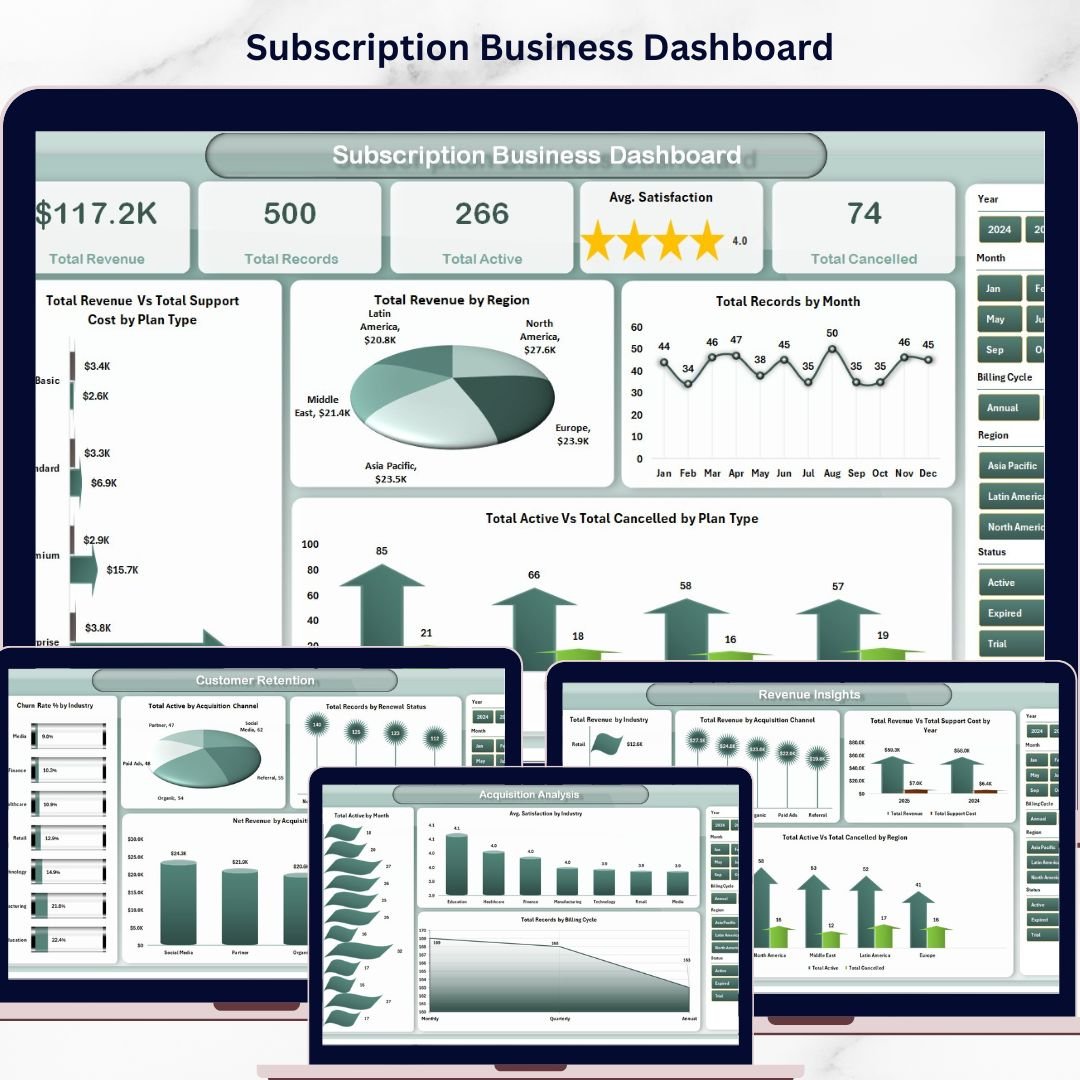
Subscription Business Dashboard in Excel is a professionally designed, pivot-powered analytics template built for subscription business owners, SaaS managers, revenue operations teams, and finance leaders who want to monitor revenue, customer retention, churn, satisfaction, and acquisition channels from a single dynamic interface. This template includes 5 interactive dashboard pages covering Overview, Plan Analysis, Revenue Insights, Customer Retention, and Acquisition Analysis — plus a Data Sheet and a Support Sheet with pivot tables that power the entire dashboard dynamically 🚀. Simply open the file in Microsoft Excel, replace the sample data with your own, click Refresh All, and watch your entire dashboard update automatically.
Whether you are tracking total revenue by region, analyzing churn rate by industry, measuring average satisfaction by plan type, or evaluating net revenue by acquisition channel, this Subscription Business Dashboard in Excel gives you complete visibility into your subscription operations with dynamic charts, KPI cards, and slicer-based filtering. This is one of the most comprehensive subscription analytics solutions available in Excel.
🔑 Key Features of Subscription Business Dashboard in Excel
📊 5 Interactive Dashboard Pages – Navigate between Overview, Plan Analysis, Revenue Insights, Customer Retention, and Acquisition Analysis tabs to explore subscription performance data from every angle.
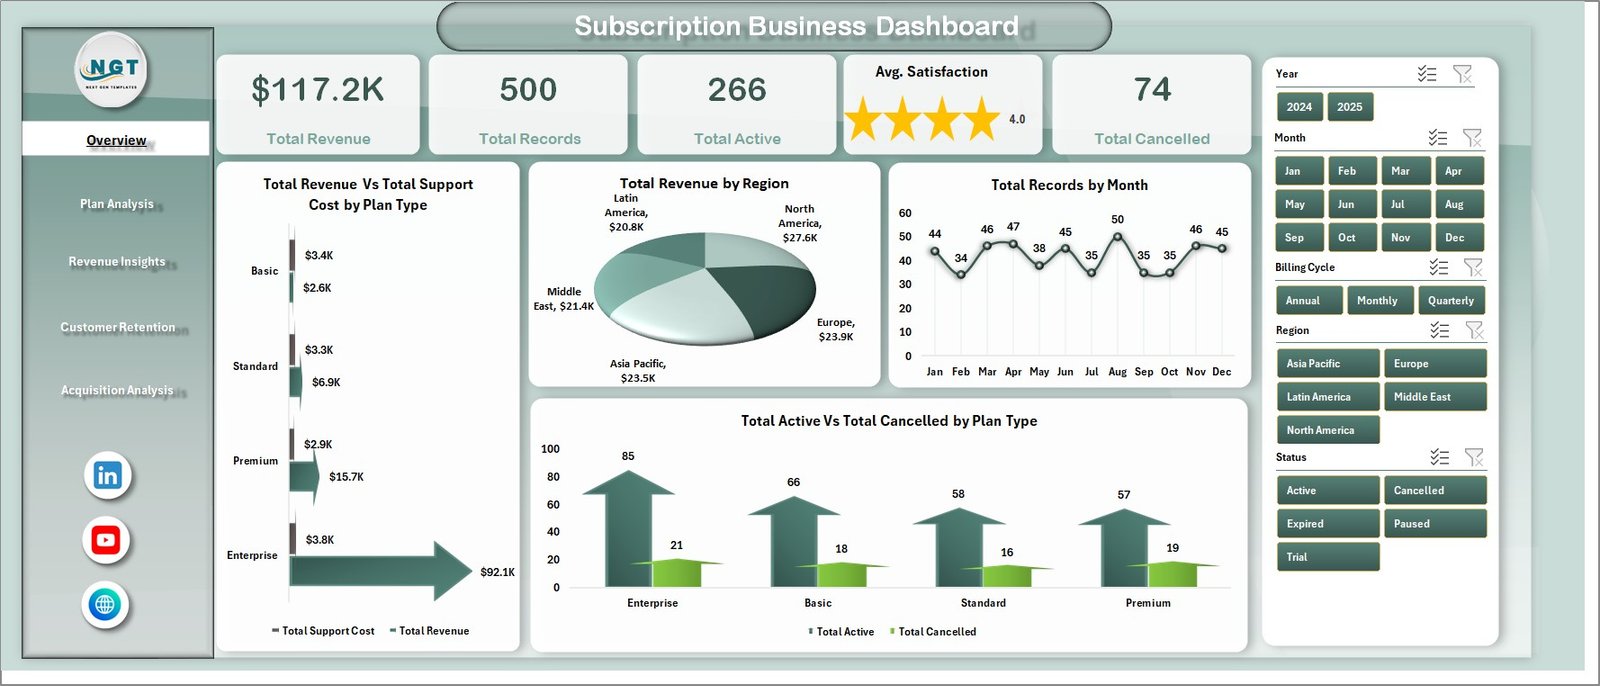
📈 5 Dynamic KPI Cards – Track high-level metrics at a glance including Total Revenue, Total Records, Total Active, Avg. Satisfaction, and Total Cancelled on the overview page.
🔍 Advanced Slicers and Filters – Filter the entire dashboard instantly by plan type, region, industry, billing cycle, acquisition channel, and more for targeted subscription analysis.
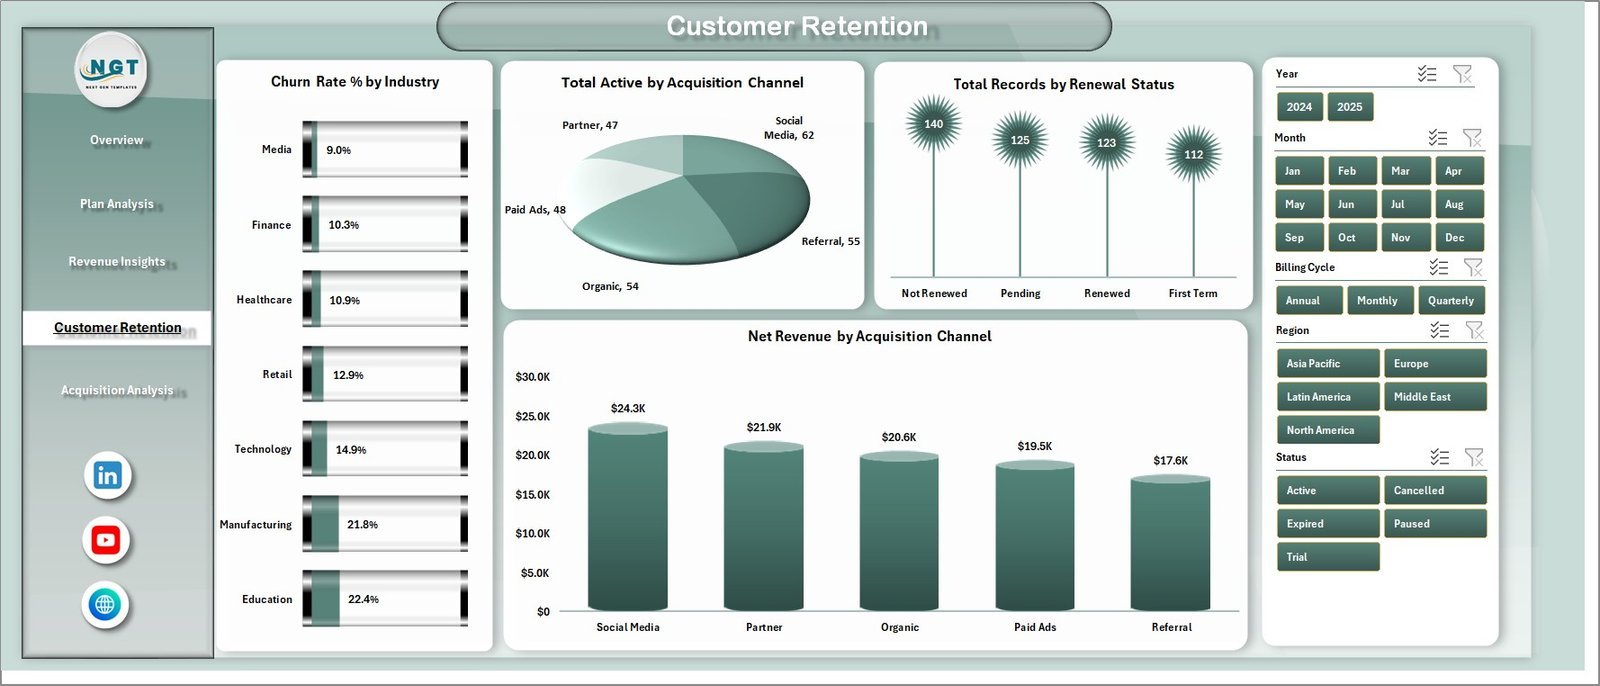
📉 Churn and Retention Tracking – Analyze Churn Rate % by Industry, Total Active by Acquisition Channel, Total Records by Renewal Status, and Net Revenue by Acquisition Channel to identify and reduce customer attrition.
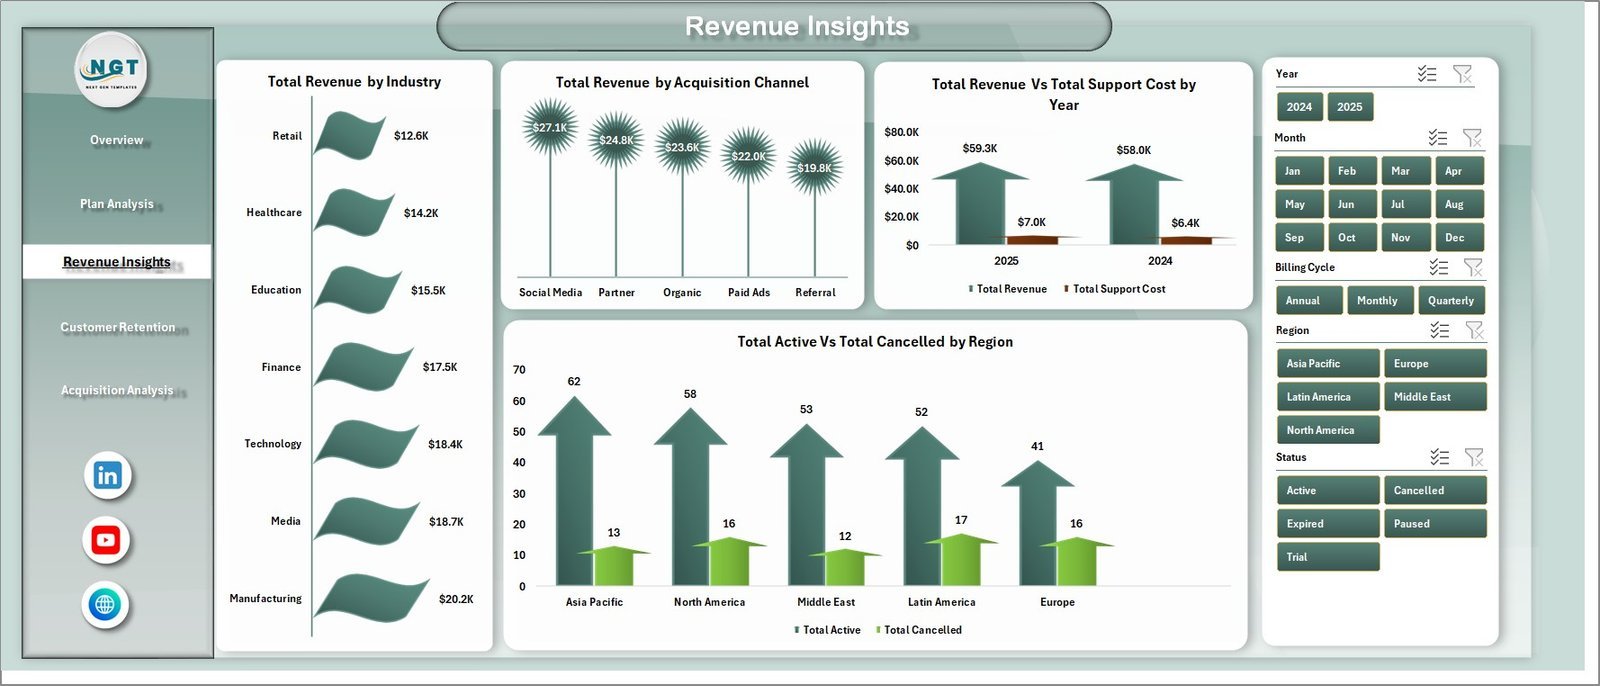
💰 Revenue Deep Dive – Explore Total Revenue by Industry, Total Revenue by Acquisition Channel, Total Revenue Vs Total Support Cost by Year, and Total Active Vs Total Cancelled by Region for complete revenue visibility.
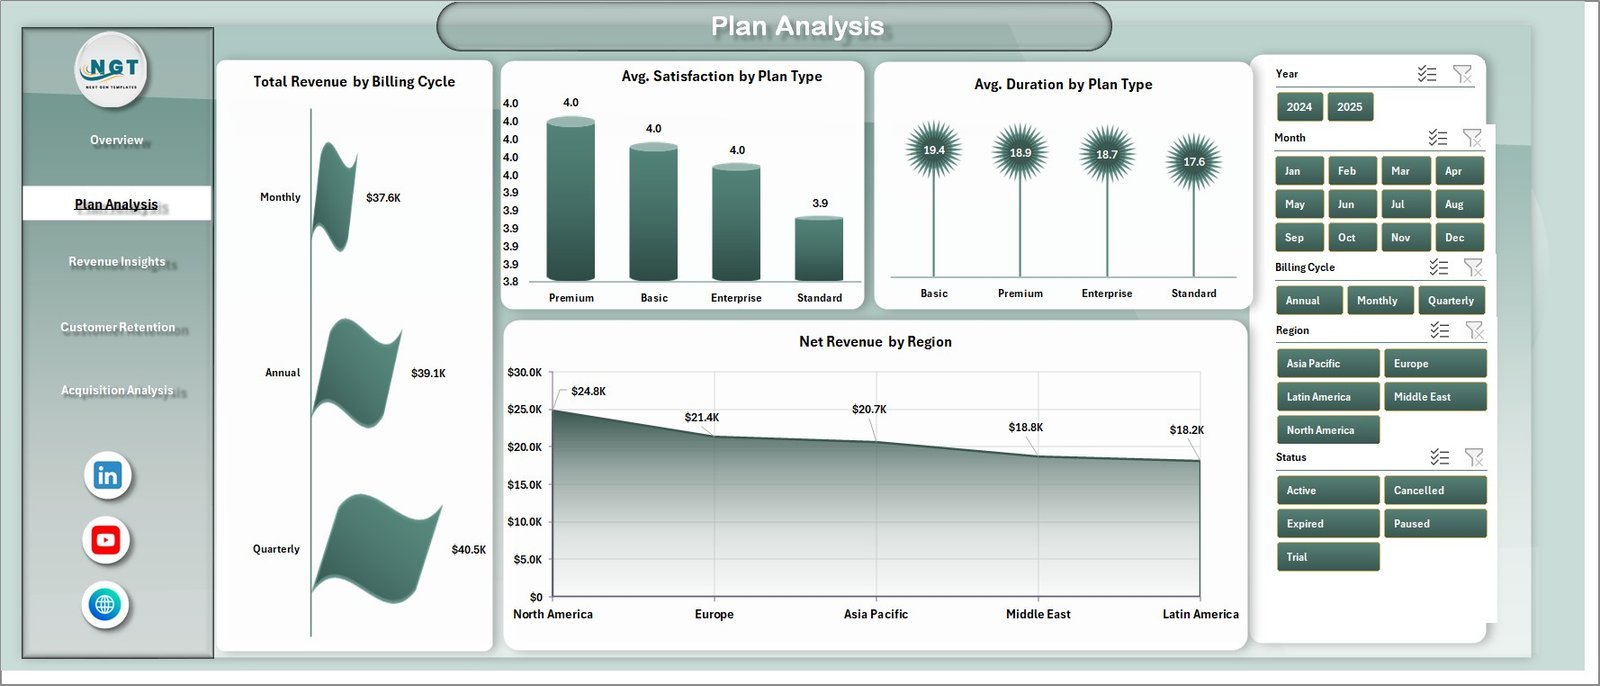
🏥 Plan Performance Monitoring – Track Total Revenue by Billing Cycle, Avg. Satisfaction by Plan Type, Avg. Duration by Plan Type, and Net Revenue by Region to compare plan effectiveness.
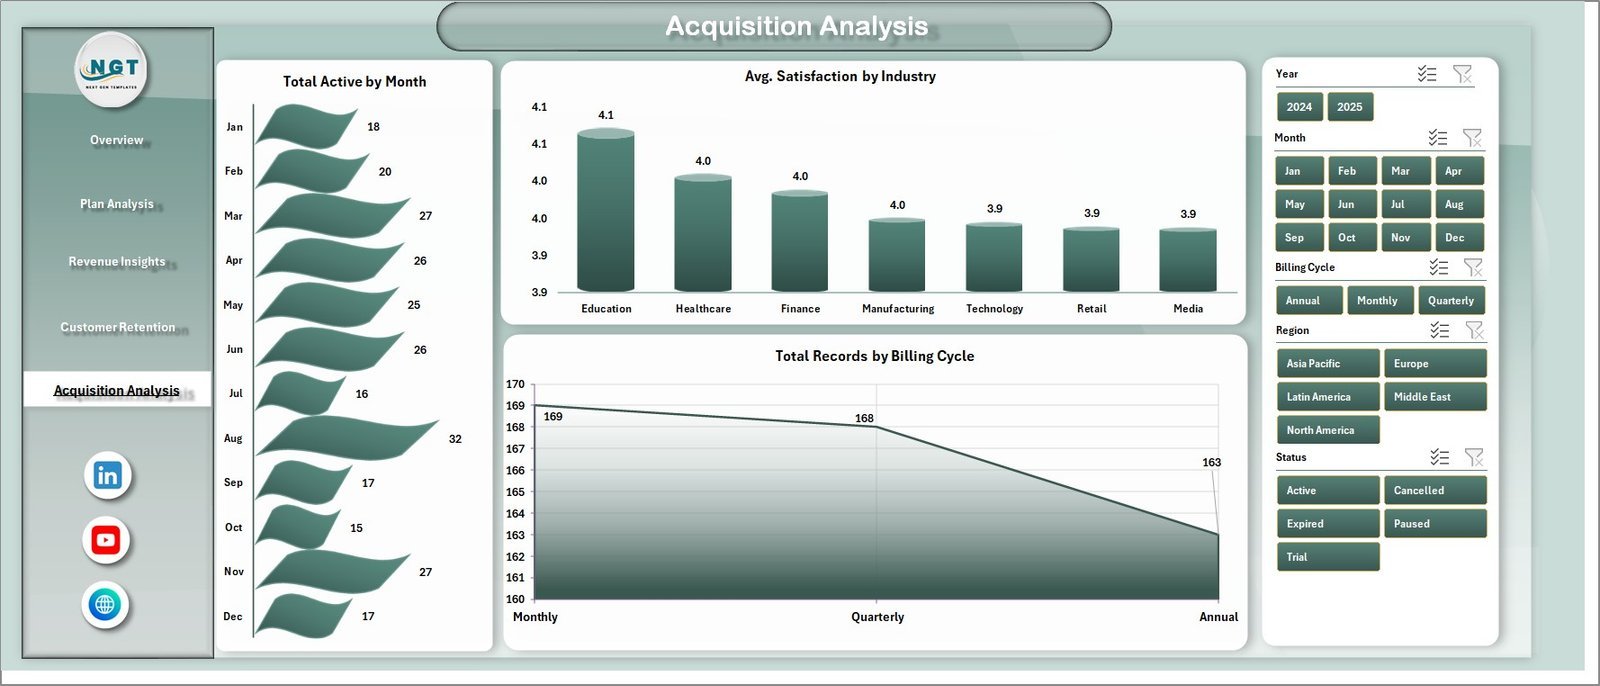
📊 Acquisition Analysis – Monitor Total Active by Month, Avg. Satisfaction by Industry, and Total Records by Billing Cycle to measure and optimize acquisition channels.
🔄 Fully Dynamic Pivot-Powered Engine – All charts and KPIs are powered by pivot tables in the Support Sheet. Simply update data and click Refresh All in the Data tab to update everything instantly.
 Subscription Business Dashboard in Excel
📦 What’s Inside the Subscription Business Dashboard in Excel
🔹 Overview Page – High-level KPI cards showing Total Revenue, Total Records, Total Active, Avg. Satisfaction, and Total Cancelled. Interactive charts display Total Revenue Vs Total Support Cost by Plan Type, Total Revenue by Region, Total Records by Month, and Total Active Vs Total Cancelled by Plan Type with multiple slicers for instant filtered analysis.
🔹 Plan Analysis Page – Deep dive into subscription plan performance with Total Revenue by Billing Cycle, Avg. Satisfaction by Plan Type, Avg. Duration by Plan Type, and Net Revenue by Region to understand which plans drive the most value and satisfaction.
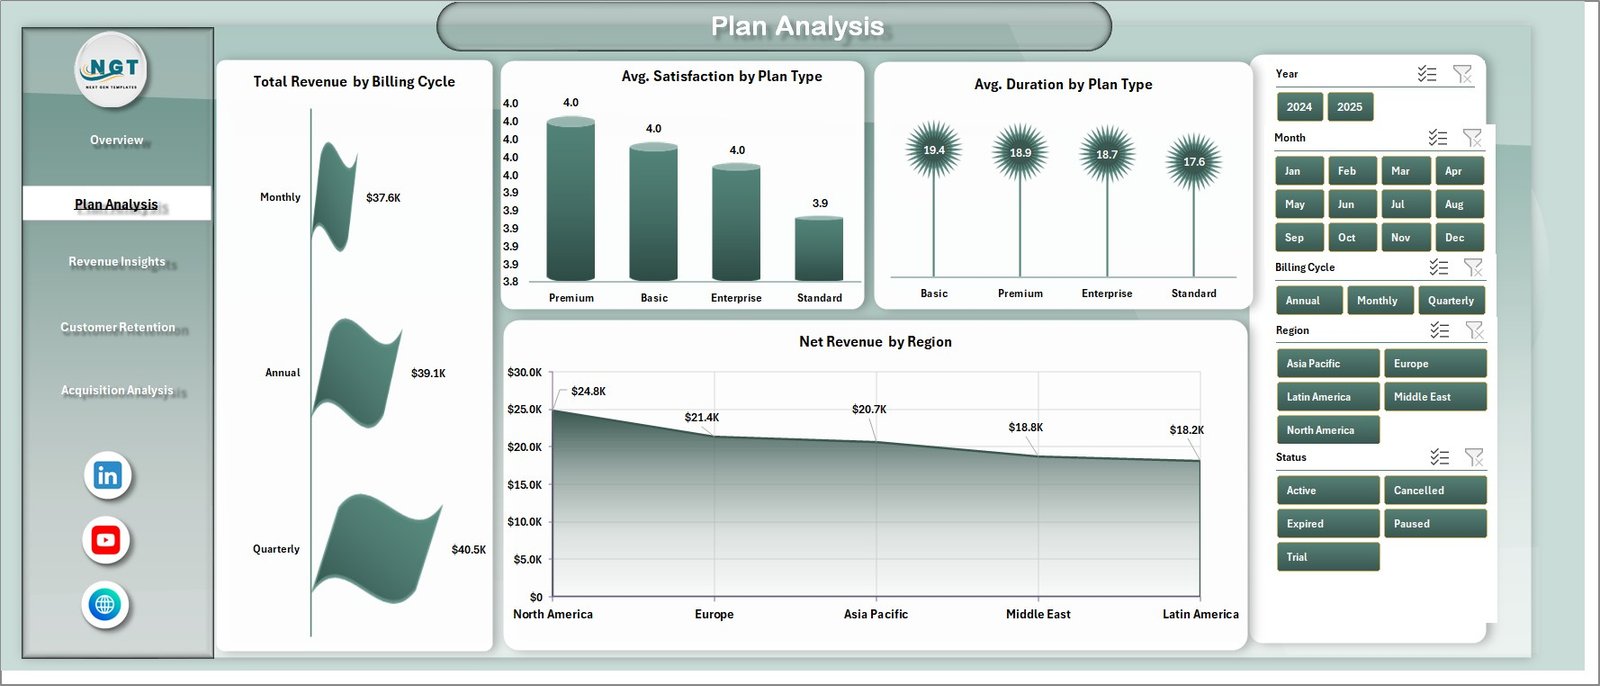 Plan Analysis
🔹 Revenue Insights Page – Comprehensive revenue analysis with Total Revenue by Industry, Total Revenue by Acquisition Channel, Total Revenue Vs Total Support Cost by Year, and Total Active Vs Total Cancelled by Region to identify revenue drivers and cost efficiency.
 Revenue Insights
🔹 Customer Retention Page – Understand and combat customer attrition with Churn Rate % by Industry, Total Active by Acquisition Channel, Total Records by Renewal Status, and Net Revenue by Acquisition Channel to proactively manage retention and reduce churn.
 Customer Retention
🔹 Acquisition Analysis Page – Track acquisition performance with Total Active by Month, Avg. Satisfaction by Industry, and Total Records by Billing Cycle to measure growth trajectory and identify high-potential acquisition channels.
 Acquisition Analysis
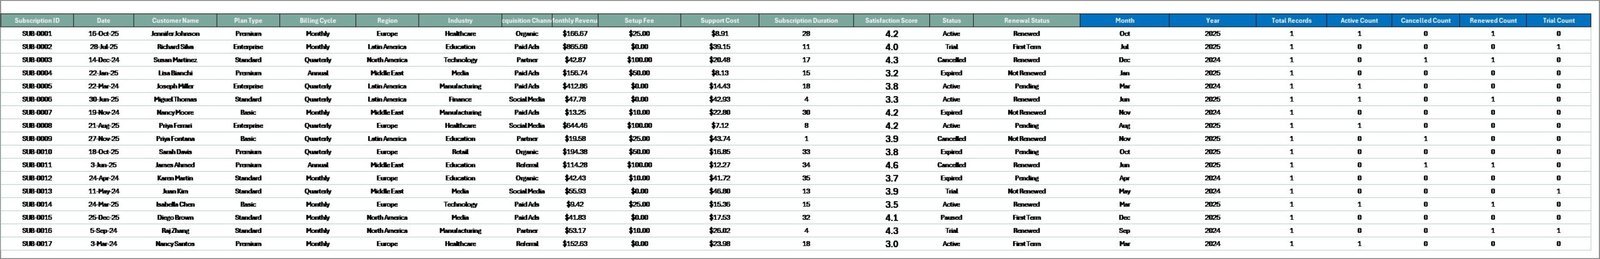
🔹 Data Sheet – This is your raw data input sheet. Add your subscription business data in the same format as the sample data provided. All dashboard pages pull from this sheet automatically.
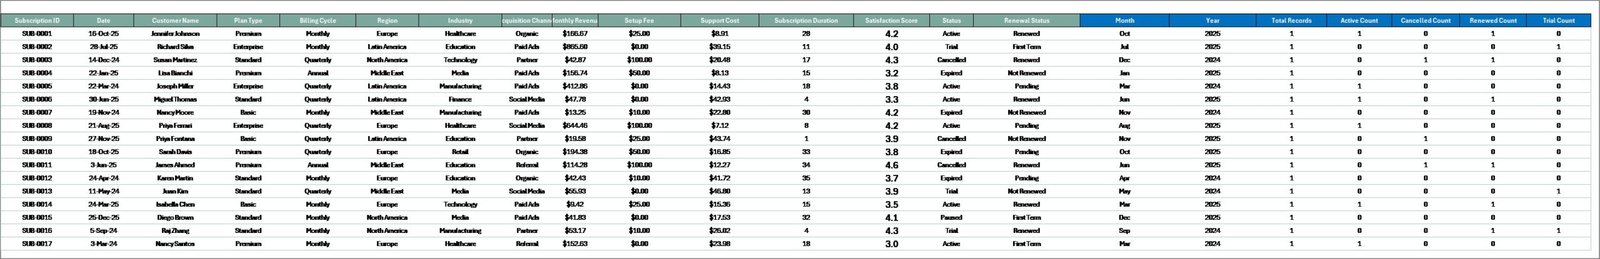 Data Sheet
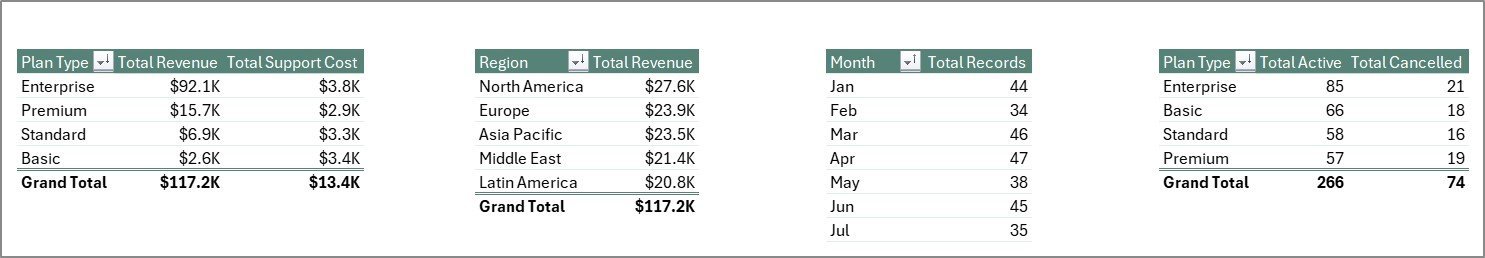
🔹 Support Sheet – Contains multiple pivot tables that power the entire dashboard dynamically. After updating data in the Data Sheet, go to the Data tab in Excel Ribbon and click Refresh All. All pivots and charts will refresh automatically. You can keep this sheet hidden during presentations.
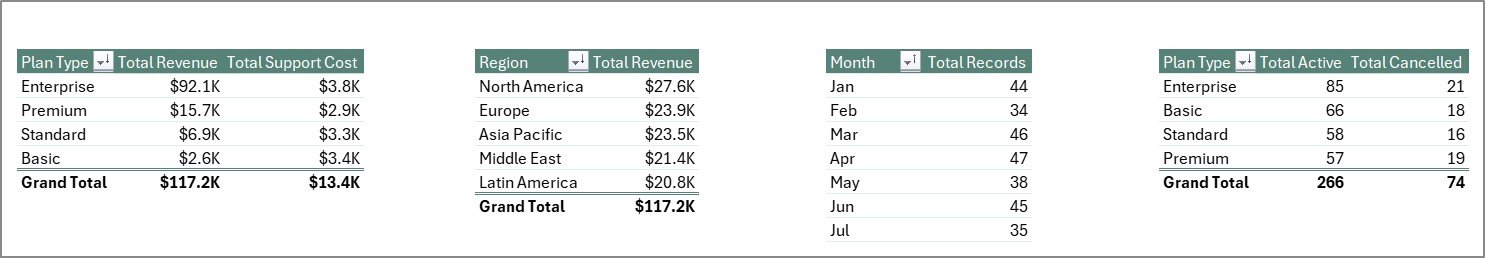 Support Sheet
⚙️ How to Use the Subscription Business Dashboard in Excel
1️⃣ Download and unzip the file to your computer.
2️⃣ Open the Excel file in Microsoft Excel (2016 or later recommended).
3️⃣ Explore the sample data across all 5 dashboard pages to understand the layout and available analysis.
4️⃣ Go to the Data Sheet tab and replace the sample data with your actual subscription business records.
5️⃣ Navigate to the Data tab in the Excel Ribbon and click Refresh All to update all pivot tables.
6️⃣ All charts, KPI cards, and slicers will update automatically with your data.
7️⃣ Use slicers and filters to drill down into specific plan types, regions, industries, or acquisition channels.
👥 Who Can Benefit from This Subscription Business Dashboard
🔹 Subscription Business Founders and CEOs – Monitor revenue, churn, retention, and customer satisfaction to track overall business health and growth trajectory.
🔹 Revenue Operations Managers – Analyze revenue by industry, acquisition channel, and billing cycle for data-driven sales optimization.
🔹 Customer Success Teams – Track churn rate, satisfaction scores, renewal status, and active customers to proactively manage customer relationships.
🔹 Finance and FP&A Teams – Use revenue trends, support cost analysis, and net revenue breakdowns for financial planning, forecasting, and investor reporting.
🔹 Marketing and Growth Teams – Evaluate acquisition channel performance, satisfaction by industry, and active subscriber trends to optimize marketing spend.
❓ Frequently Asked Questions
What KPIs does the Subscription Business Dashboard in Excel track?
The Subscription Business Dashboard in Excel tracks 5 key performance indicators including Total Revenue, Total Records, Total Active, Avg. Satisfaction, and Total Cancelled. It also provides detailed analysis across churn rate, revenue by industry, acquisition channel performance, plan type comparisons, and renewal status across 5 interactive dashboard pages.
Do I need advanced Excel skills to use this template?
No. Simply replace the sample data in the Data Sheet with your own subscription business data and click Refresh All in the Data tab. All pivot tables, charts, and KPI cards update automatically without any formula editing or VBA knowledge.
Can I track customer churn and retention with this dashboard?
Yes. The dedicated Customer Retention page shows Churn Rate % by Industry, Total Active by Acquisition Channel, Total Records by Renewal Status, and Net Revenue by Acquisition Channel. The Overview page also displays Total Active vs Total Cancelled for quick monitoring.
What is the best Excel template for tracking subscription business metrics?
The Subscription Business Dashboard in Excel is one of the best templates for tracking subscription metrics because it includes revenue tracking, churn analysis, customer retention monitoring, plan performance comparison, and acquisition channel analysis — all powered by dynamic pivot tables across 5 interactive pages.
Can I filter the dashboard by region or plan type?
Yes. The dashboard includes multiple slicers that let you instantly filter all charts and KPIs by plan type, region, industry, billing cycle, acquisition channel, and other dimensions for focused analysis.
How does the Support Sheet work?
The Support Sheet contains multiple pivot tables that serve as the calculation engine for all dashboard charts and KPI cards. When you update data in the Data Sheet and click Refresh All, every pivot table recalculates and all visuals update automatically. You can keep this sheet hidden during presentations.
🔗 Explore Related Templates
🔹 SaaS Metrics Dashboard in Excel – Track MRR, ARR, churn, retention, and expansion revenue with dynamic pivot-powered analytics for SaaS businesses.
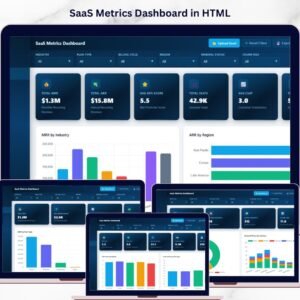
🔹 SaaS Metrics Dashboard in HTML – Monitor SaaS performance metrics in a browser-based interactive dashboard with zero installation.
🔹 Subscription Box KPI Scorecard in Excel – Track and optimize subscription box KPIs with MTD and YTD performance analysis.
Browse all Excel Dashboard Templates for more interactive analytics solutions.
📖 Click here to read the Detailed Blog Post
🎥 Visit our YouTube channel to learn step-by-step video tutorials
👉 YouTube.com/@NextGenTemplates


Reviews
There are no reviews yet.