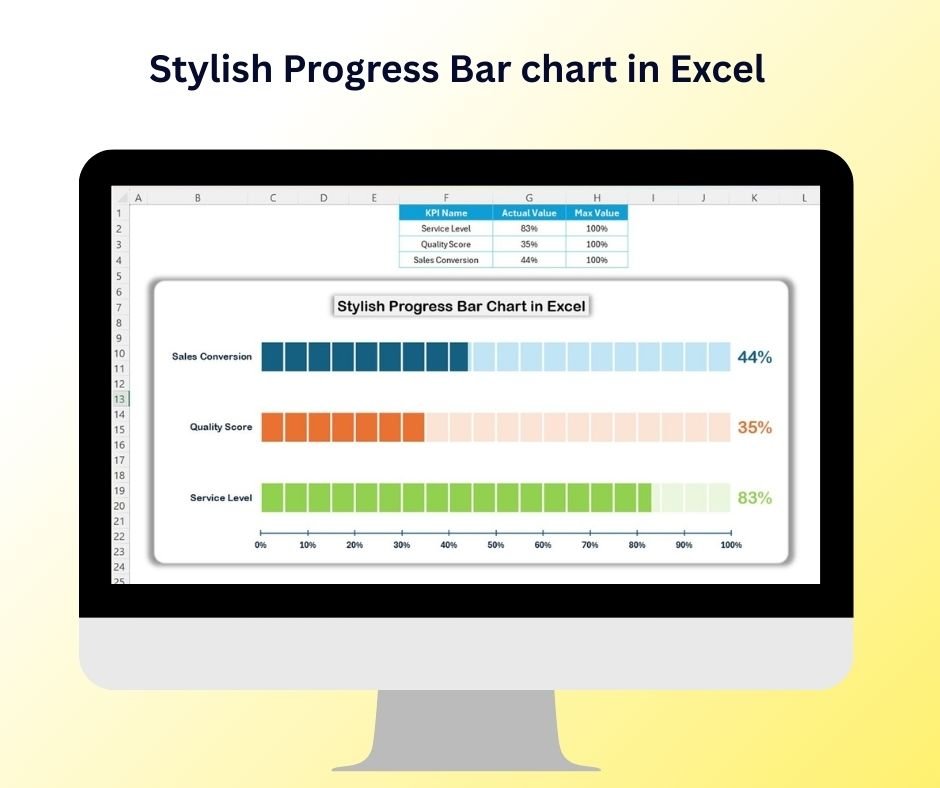
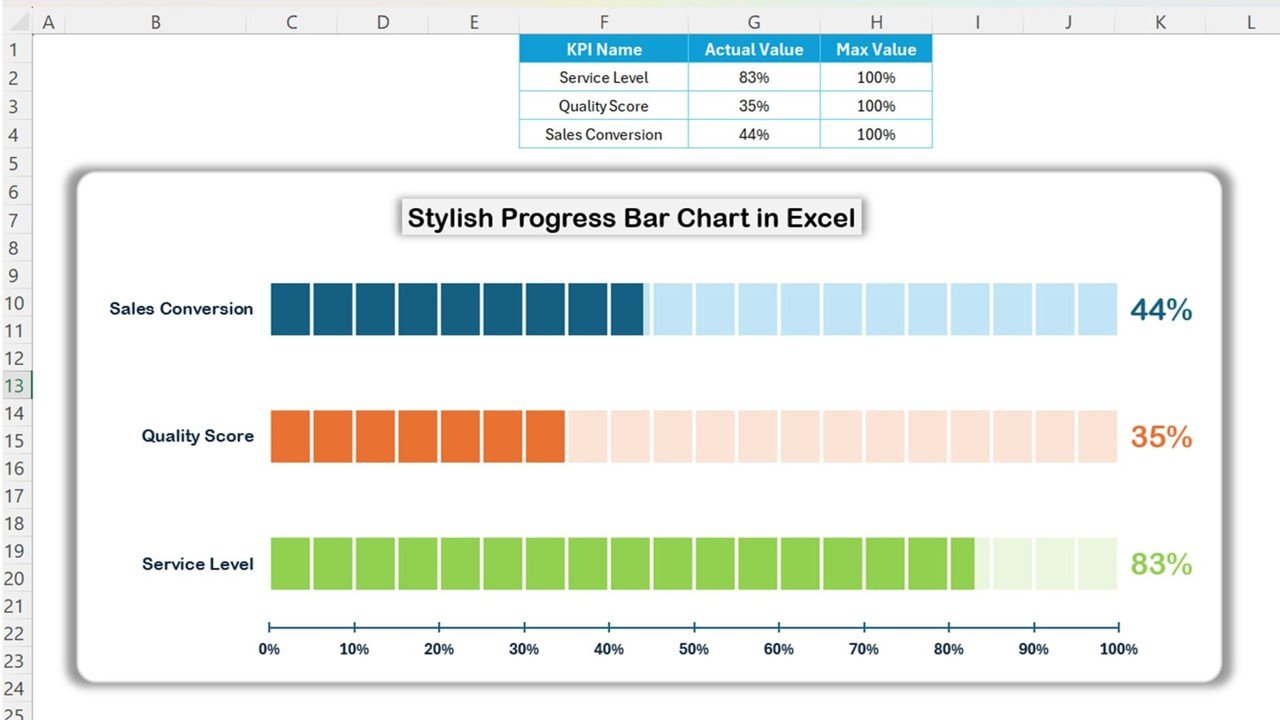
The Stylish Progress Bar Chart in Excel is a unique and visually appealing tool designed to help businesses and professionals track their progress in a visually engaging manner. Whether you’re monitoring project completion, sales targets, or employee performance, this dynamic and stylish progress bar chart allows you to represent data in an intuitive and impactful way.
This Excel-based tool combines the power of Excel’s data visualization capabilities with customizable design features to create an aesthetically pleasing progress chart. Perfect for managers, project leaders, or anyone in need of clear, visual progress tracking, this tool provides a quick, effective way to monitor progress and performance.
Key Features of the Stylish Progress Bar Chart in Excel:
📊 Visually Engaging Charts
Represent progress or completion percentages with stylish and colorful progress bar charts, adding a dynamic visual element to your presentations or reports.
📈 Real-Time Tracking
Track progress in real-time with up-to-date data entries. Whether it’s project completion, task tracking, or sales goals, your progress is automatically reflected in the chart.
🎯 Customizable Design
Fully customizable to suit your business needs, this chart allows you to adjust colors, labels, and progress indicators to match your project or organizational branding.
🛠 Simple Data Entry
Enter your data easily into the pre-designed fields, and the chart will automatically update to reflect the new data, saving time and effort in manual updates.
🔔 Multiple Data Tracking
Track multiple projects, goals, or KPIs in one chart with the ability to compare progress across different categories or departments.
💼 Professional Presentation
Enhance your presentations or reports with sleek, stylish charts that offer clear visual insights into performance and completion status.
🚀 Why You’ll Love the Stylish Progress Bar Chart in Excel:
✅ Clear and Intuitive Visualization – Represent progress, performance, or completion percentages with beautiful, easy-to-understand progress bars.
✅ Customizable to Fit Your Needs – Tailor the chart’s design, colors, and data inputs to fit your project or company’s needs.
✅ Ideal for Reports and Presentations – Add visually appealing charts to enhance presentations, meetings, and client reports.
✅ Quick and Easy Updates – Update data effortlessly, and the progress bar chart will automatically reflect the new numbers, streamlining your workflow.
✅ Time-Saving – Save time by avoiding the need to manually create or update charts. Simply input data and let Excel handle the visualization.
What’s Inside the Stylish Progress Bar Chart in Excel:
- Dynamic Progress Bars: Colorful and engaging progress bars that visually represent percentages or completion levels.
- Customizable Colors: Adjust the color of the progress bars to match your branding or project requirements.
- Multiple Categories: Track multiple goals, tasks, or KPIs with separate progress bars in a single chart.
- Data Labels: Add labels to each progress bar to show the percentage of completion or relevant data points.
- Conditional Formatting: Set rules to automatically change the appearance of progress bars based on thresholds (e.g., color change when a goal is met).
How to Use the Stylish Progress Bar Chart in Excel:
1️⃣ Download the Template – Access the Excel file instantly upon purchase.
2️⃣ Input Your Data – Enter data such as project completion percentages, sales figures, or employee progress into the pre-designed fields.
3️⃣ Customize the Chart – Adjust the color scheme, labels, and other chart elements to suit your business or project needs.
4️⃣ Track Progress – Watch your progress automatically update as you input data, giving you a real-time overview of your performance.
5️⃣ Use in Reports/Presentations – Easily integrate the progress bar chart into your reports, presentations, or dashboards.
Who Can Benefit from the Stylish Progress Bar Chart in Excel:
- Project Managers
- Sales Managers
- HR and Employee Performance Managers
- Business Analysts
- Marketing Teams
- Financial Analysts
- Entrepreneurs and Small Business Owners
The Stylish Progress Bar Chart in Excel is the perfect tool for anyone looking to visually track progress, goals, or performance. With its simple design and powerful features, you can efficiently monitor key metrics and present data in an attractive, professional manner.
Click here to read the Detailed blog post
https://www.pk-anexcelexpert.com/stylish-progress-bar-chart-in-excel/
Visit our YouTube channel to learn step-by-step video tutorials
Youtube.com/@PKAnExcelExpert


&url=https://nextgentemplates.com/product/spotlight-visualization-in-excel-part-2/&media=https://nextgentemplates.com/wp-content/uploads/2025/03/Spotlight-Visualization-in-Excel-Part-2.jpg)
&url=https://nextgentemplates.com/product/spotlight-visualization-in-excel-part-1/&media=https://nextgentemplates.com/wp-content/uploads/2025/03/Spotlight-Visualization-in-Excel-Part-1-1024x1024.jpg)
&url=https://nextgentemplates.com/product/info-graphics-with-column-chart-part-1/&media=https://nextgentemplates.com/wp-content/uploads/2025/03/Info-graphics-with-Column-chart-Part-1-1024x1024.jpg)
&url=https://nextgentemplates.com/product/analog-clock-in-excel-pie-chart-doughnut-chart/&media=https://nextgentemplates.com/wp-content/uploads/2025/03/Analog-Clock-in-Excel-Pie-Chart-Doughnut-Chart-1-1.jpg)
&url=https://nextgentemplates.com/product/info-graphics-with-column-chart-part-2/&media=https://nextgentemplates.com/wp-content/uploads/2025/03/Info-graphics-with-Column-chart-Part-2-1024x1024.jpg)
&url=https://nextgentemplates.com/product/informative-kpi-indicator-chart-version-1/&media=https://nextgentemplates.com/wp-content/uploads/2025/03/Informative-KPI-Indicator-Chart-Version-1-1024x1024.jpg)
&url=https://nextgentemplates.com/product/informative-kpi-indicator-chart-version-2/&media=https://nextgentemplates.com/wp-content/uploads/2025/03/Informative-KPI-Indicator-Chart-Version-2-1024x1024.jpg)
Reviews
There are no reviews yet.