Managing student exchange programs without structured insights can quickly turn complex. Applications increase, partnerships expand, budgets tighten, and leadership expects measurable outcomes. That is why institutions worldwide are shifting toward KPI-driven performance tracking.
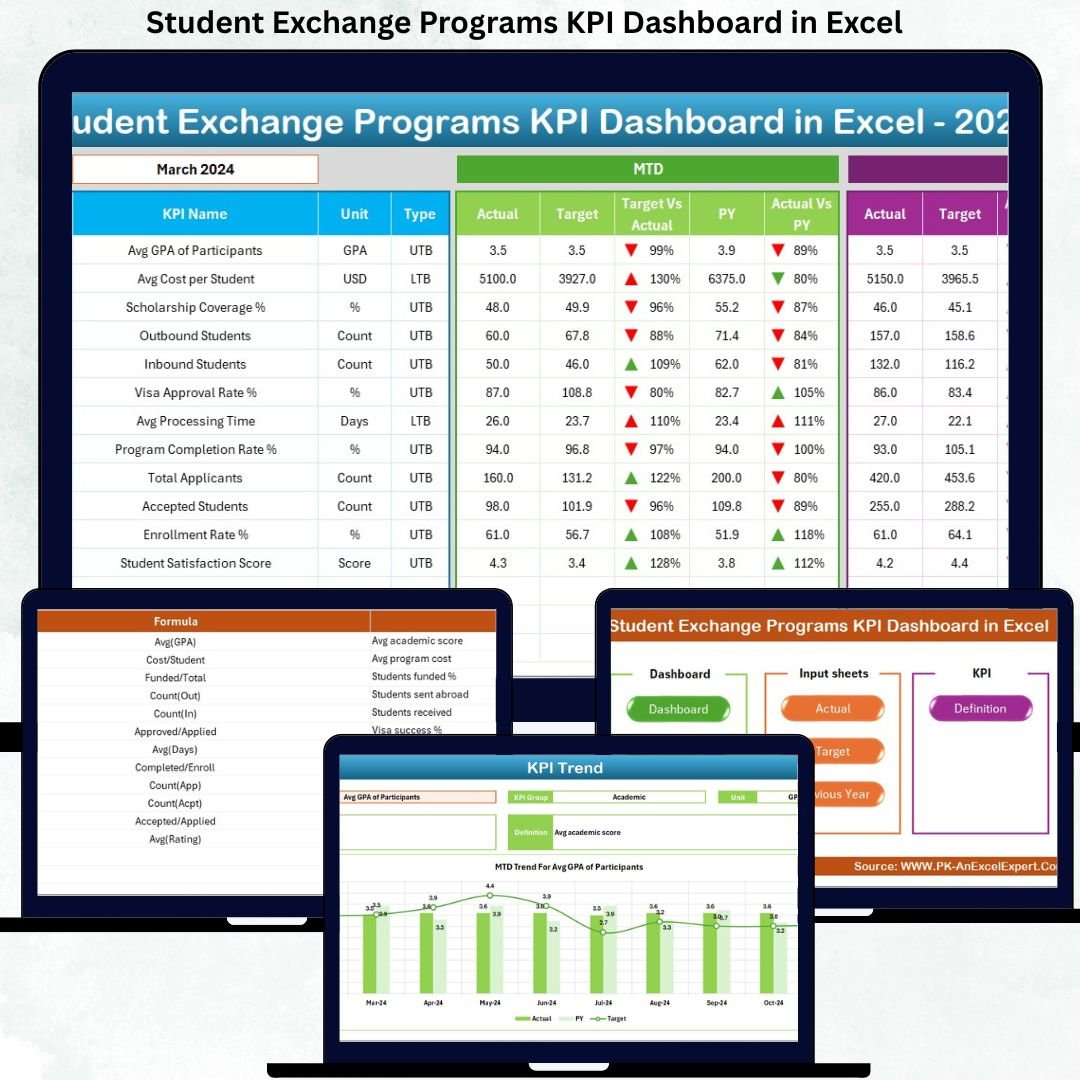
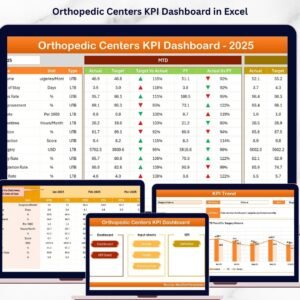
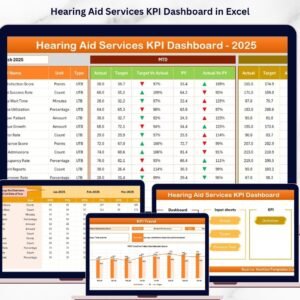
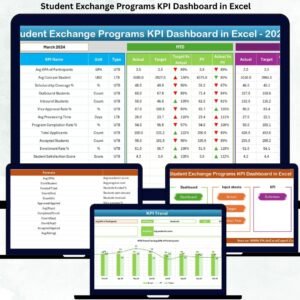
The Student Exchange Programs KPI Dashboard in Excel is a ready-to-use, professional, and highly visual performance management tool designed specifically for universities, colleges, and international education offices. This dashboard transforms scattered exchange data into clear, actionable insights—all within Excel.
Instead of relying on manual reports and fragmented sheets, this dashboard provides a single source of truth for tracking applications, participation, targets, trends, and year-over-year performance. Most importantly, it helps institutions make faster, smarter, and data-driven decisions.
🚀 Key Features of Student Exchange Programs KPI Dashboard in Excel
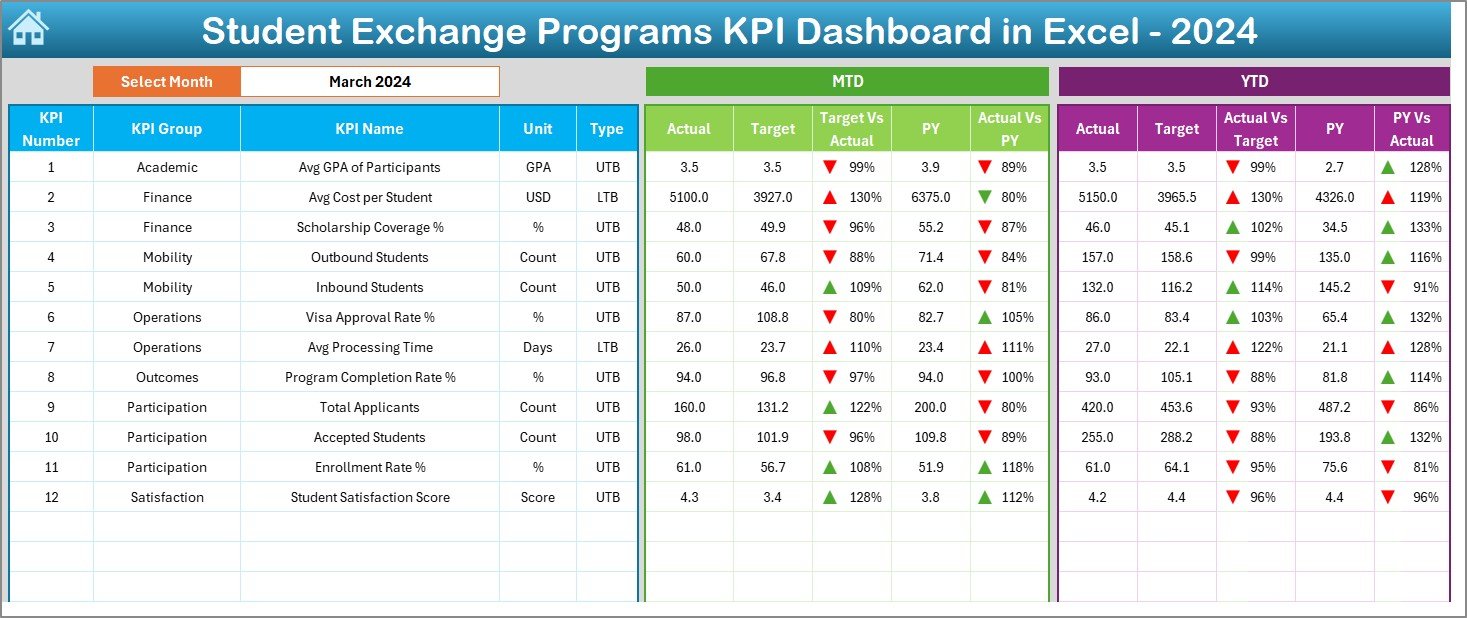
✅ Month-based KPI tracking with dynamic updates using simple drop-downs
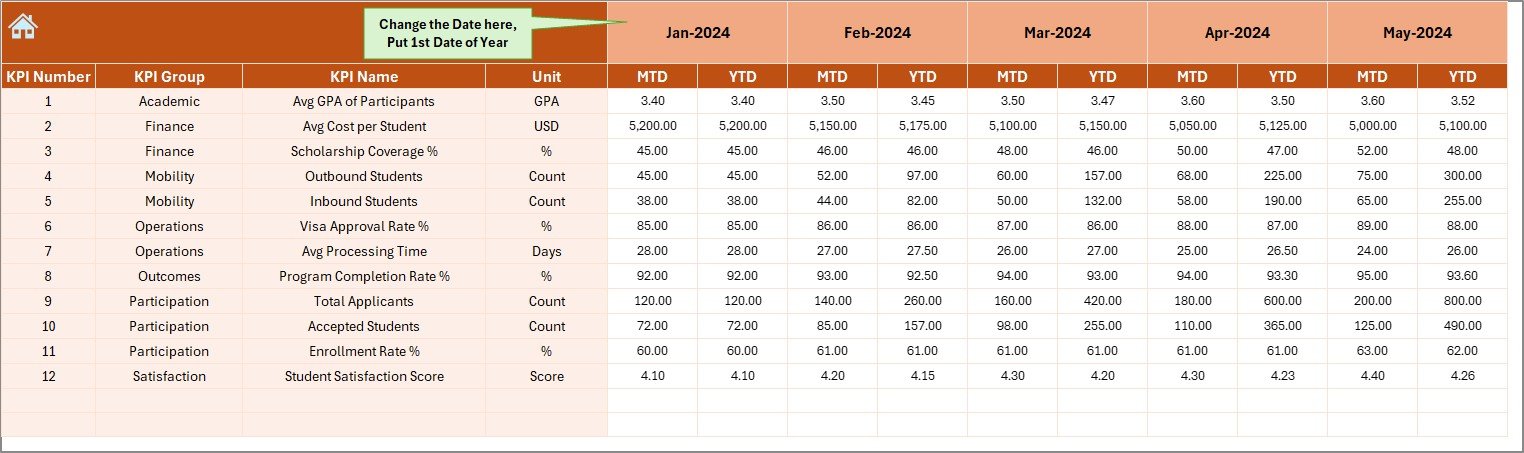
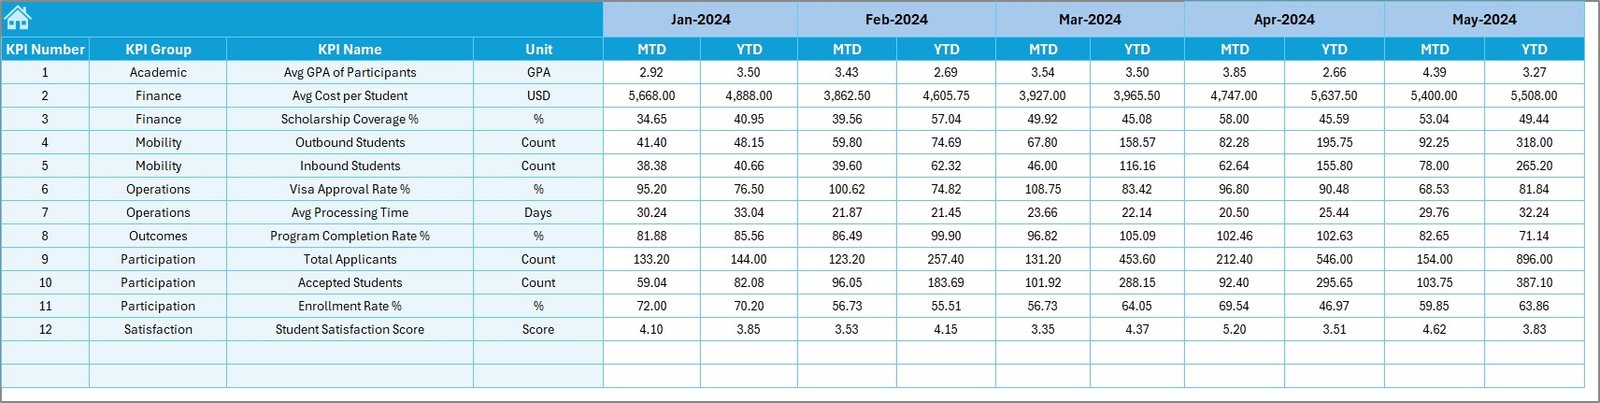
✅ MTD and YTD performance monitoring for complete visibility
✅ Target vs Actual analysis with automatic variance calculations
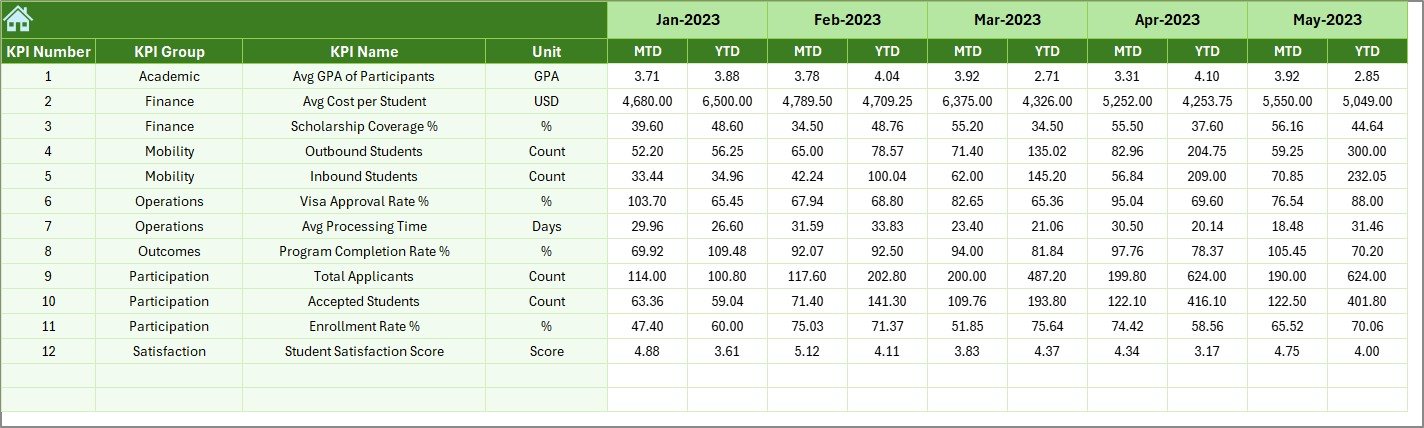
✅ Previous Year comparison to track long-term improvement
✅ Conditional formatting arrows to instantly identify performance direction
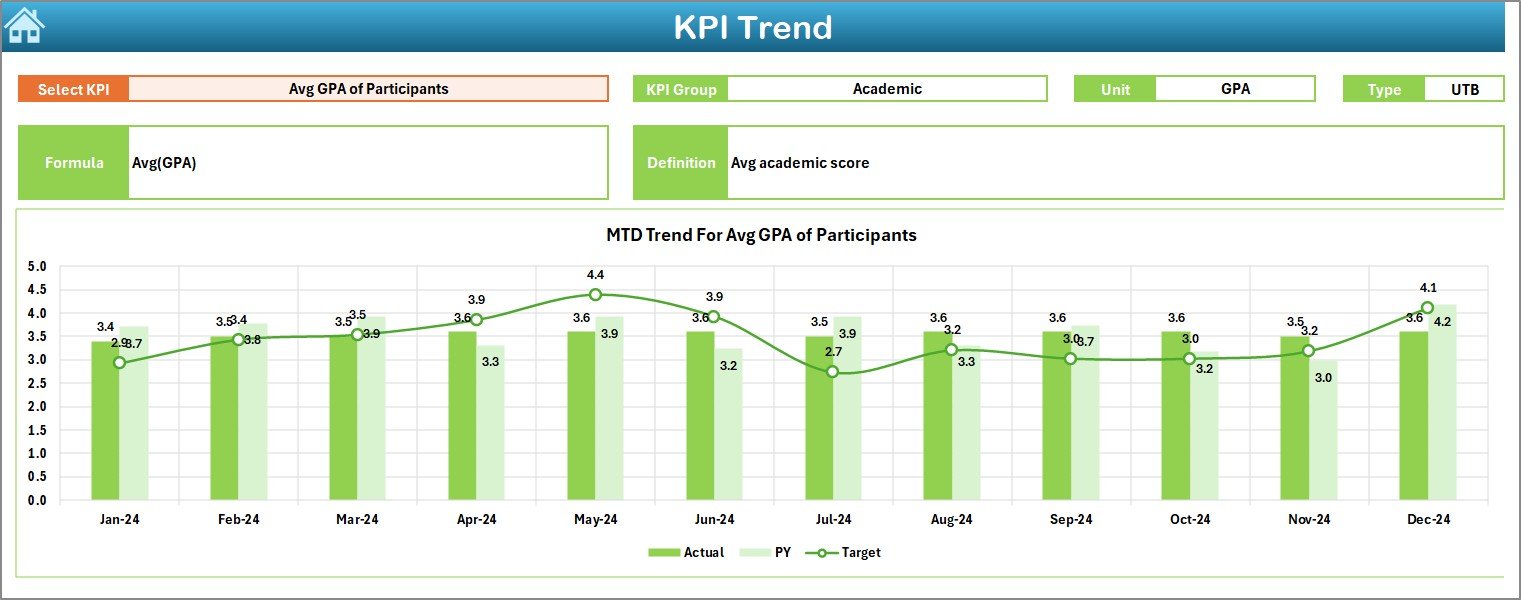
✅ Trend charts for deep KPI analysis and forecasting
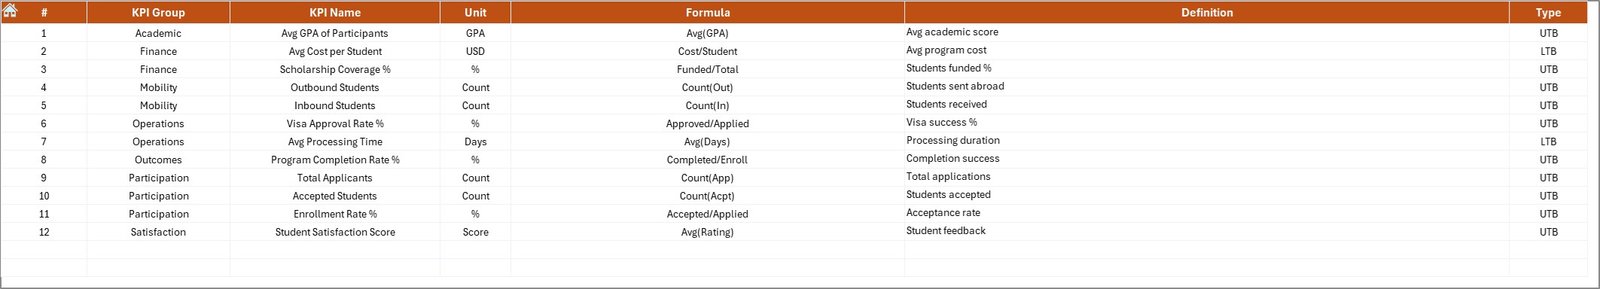
✅ Structured KPI Definition framework for consistency and accuracy
✅ 100% Excel-based solution—no Power BI or external tools required
This dashboard is built to save time, reduce errors, and deliver instant clarity.
📂 What’s Inside the Student Exchange Programs KPI Dashboard in Excel
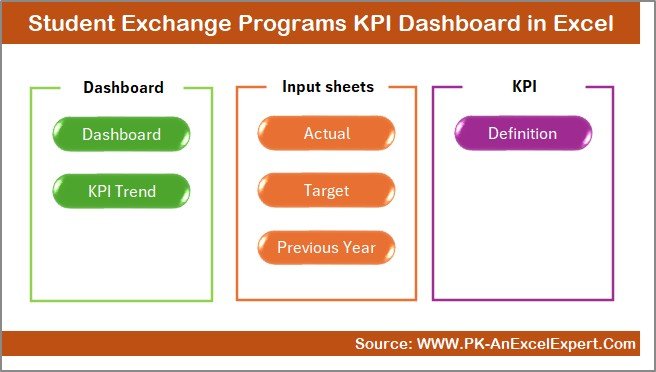
This digital product includes 7 professionally structured worksheets, each serving a critical role:
📌 Summary Page – A clean navigation hub with one-click access to all sheets
📌 Dashboard Sheet – The main analytical view with MTD & YTD KPIs and variance analysis
📌 Trend Sheet – Visual KPI trends showing Actual, Target, and Previous Year data
📌 Actual Numbers Input Sheet – Simple and controlled data entry for current performance
📌 Target Sheet – Monthly and YTD performance goal setting
📌 Previous Year Number Sheet – Historical benchmarking and comparison
📌 KPI Definition Sheet – Centralized KPI names, units, formulas, definitions, and types
Together, these sheets create a complete KPI management system for student exchange programs.
🛠️ How to Use the Student Exchange Programs KPI Dashboard in Excel
Using this dashboard is simple and user-friendly—even for non-technical users:
1️⃣ Define or review KPIs in the KPI Definition Sheet
2️⃣ Enter performance goals in the Target Sheet
3️⃣ Add last year’s data in the Previous Year Number Sheet
4️⃣ Input current month data in the Actual Numbers Input Sheet
5️⃣ Select the month using the drop-down
6️⃣ Instantly view results, variances, and trends on the Dashboard & Trend Sheets
No complex formulas, no VBA, and no advanced Excel skills required.
🎯 Who Can Benefit from This Student Exchange Programs KPI Dashboard in Excel
This dashboard is ideal for:
🎓 International Relations Offices managing exchange partnerships
🏫 University Administrators monitoring global program performance
📊 Exchange Program Coordinators tracking targets and outcomes
📈 Academic Leadership Teams reviewing trends and results
🧭 Strategic Planning Departments supporting data-driven decisions
Whether you manage a small exchange program or a large international portfolio, this dashboard adapts to your needs.


Reviews
There are no reviews yet.