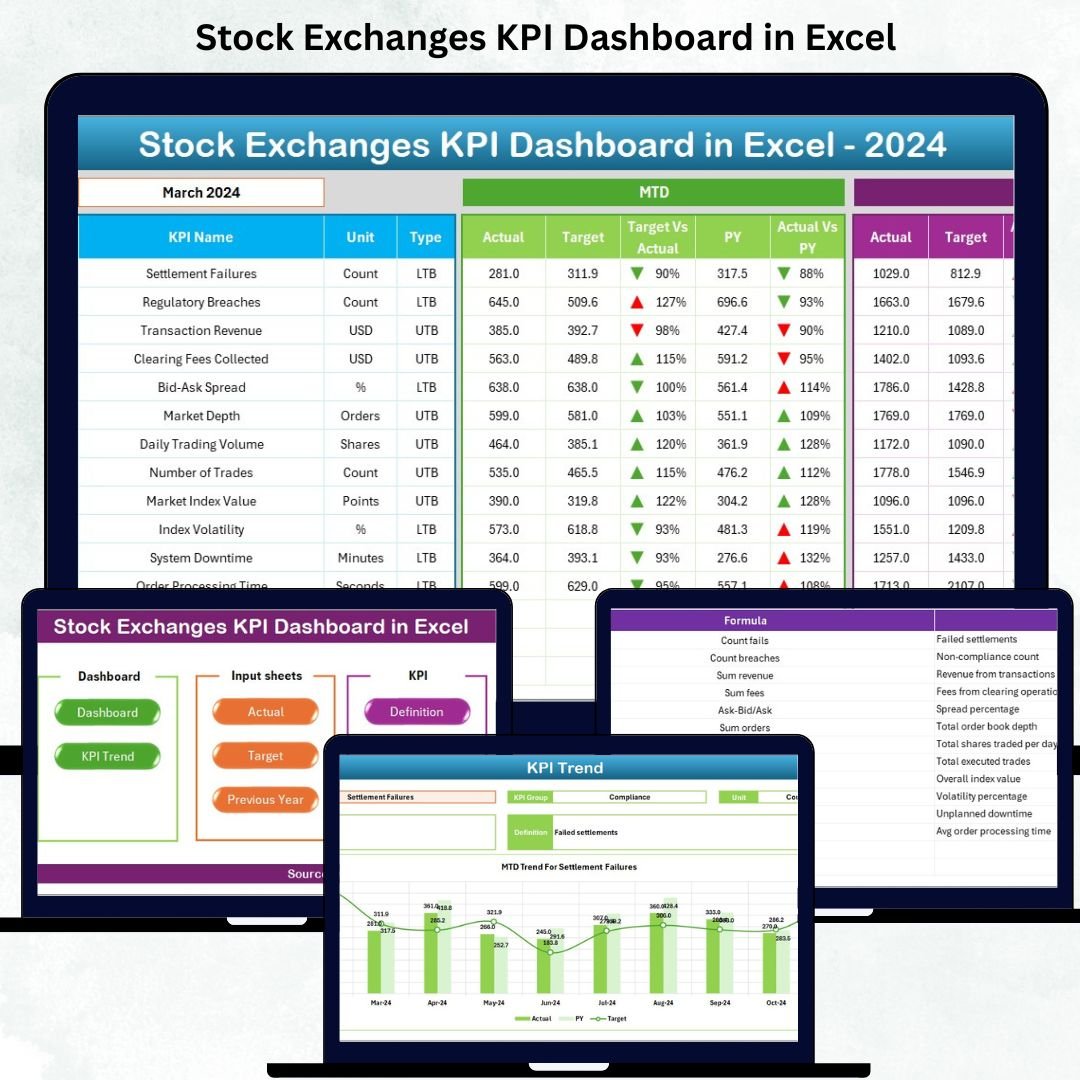
Managing a fast-moving stock market requires clarity, accuracy, and speed. Prices shift every second, trading activity fluctuates, and investor behavior changes instantly. That’s why every stock exchange team needs a reliable tool to monitor performance without confusion. Our Stock Exchanges KPI Dashboard in Excel is designed to simplify complex market data and convert it into clean, actionable insights. Whether you are an analyst, regulator, or market administrator, this dashboard gives you a complete view of key metrics in one interactive Excel file.Stock Exchanges KPI Dashboard in Excel
This professionally designed template helps you track essential KPIs such as trading volume, liquidity, market capitalization, transaction speed, settlement efficiency, system reliability, and more. With automated formulas, dropdown selections, conditional formatting, and charts, you can analyze Month-to-Date (MTD) and Year-to-Date (YTD) performance in seconds. It eliminates guesswork, reduces manual work, and provides instant market intelligence.
✨ Key Features of the Stock Exchanges KPI Dashboard in Excel
Our dashboard is built with precision and simplicity, ensuring you get the most accurate market insights with minimum effort.
🔹 Interactive Summary Page
Jump to any sheet instantly using navigation buttons.
🔹 Automated Dashboard View
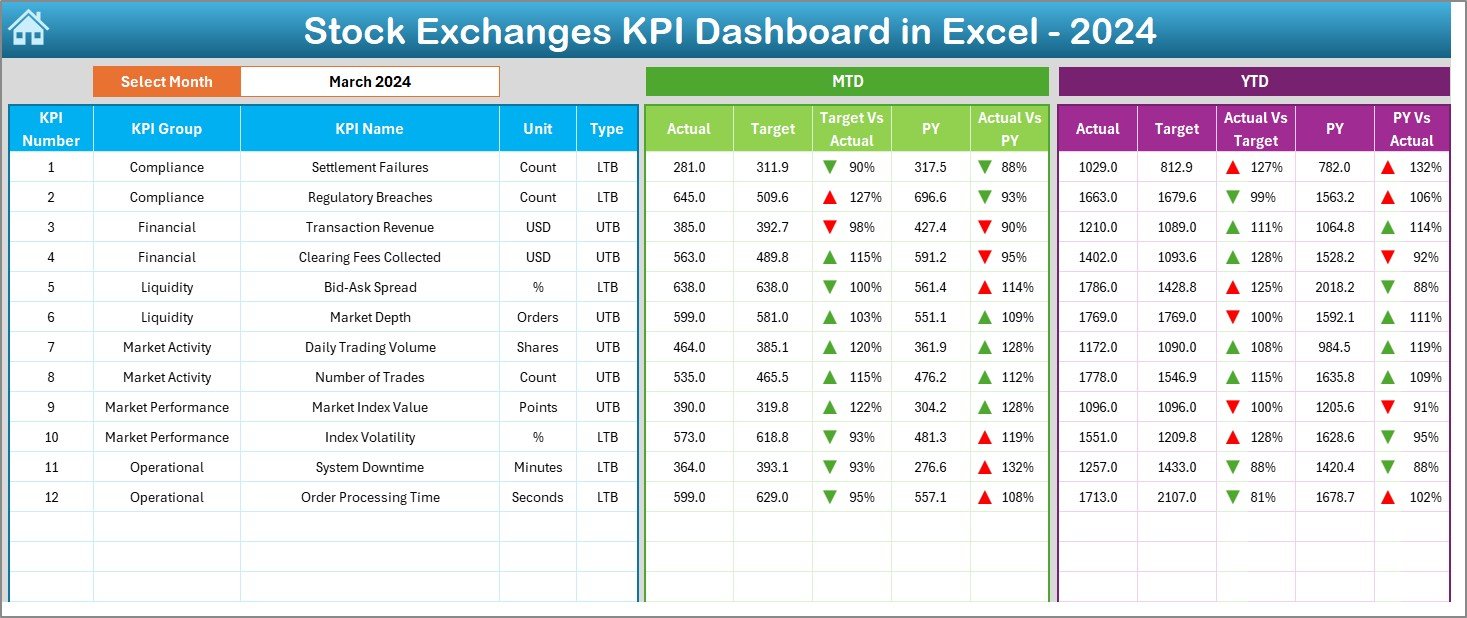
Select any month and watch the entire dashboard update automatically.
🔹 Trend Analysis Page
View KPI trends across months and compare Actual vs Target vs Previous Year.
🔹 Actual, Target & Previous Year Inputs
Enter all MTD, YTD, and historical data in organized input sheets.
🔹 KPI Definition Master
Maintain clarity with KPI formulas, units, definitions, and types (UTB/LTB).
🔹 Conditional Formatting
Instantly spot good or bad performance using ✓ arrows, icons, and color codes.
🔹 Fully Editable & Customizable
Modify KPIs, charts, targets, and structures based on your exchange’s needs.
📦 What’s Inside the Stock Exchanges KPI Dashboard in Excel
When you download this template, you receive a fully structured, ready-to-use Excel file containing:Stock Exchanges KPI Dashboard in Excel
✔️ Dashboard Page – one-click monthly market insights
✔️ Trend Analysis Page – graphical patterns for each KPI
✔️ Actual Numbers Sheet – MTD/YTD entry section
✔️ Target Sheet – monthly target inputs
✔️ Previous Year Data Sheet – for YoY comparison
✔️ KPI Definition Sheet – formulas, units, type, and definitions
✔️ Summary Page – smooth navigation with buttons
Every sheet is connected through formulas, meaning one update reflects across the entire dashboard instantly.
🛠️ How to Use the Stock Exchanges KPI Dashboard
You don’t need advanced Excel knowledge — the dashboard works smoothly with simple steps:
👉 Step 1: Enter MTD and YTD data in the Actual Numbers sheet
👉 Step 2: Add or modify KPI targets in the Targets sheet
👉 Step 3: Input previous year values for comparison
👉 Step 4: Use the month dropdown on the Dashboard page
👉 Step 5: Review trends in the Trend Analysis page
👉 Step 6: Update KPI definitions whenever you add new metrics
With this routine, your stock exchange gets a clear, accurate, and up-to-date performance report every month.
👥 Who Can Benefit from This Stock Exchanges KPI Dashboard
This powerful Excel tool is ideal for:Stock Exchanges KPI Dashboard in Excel
📌 Stock Exchange Officials
Monitor daily, monthly, or yearly market performance effortlessly.
📌 Market Analysts
Study trends, liquidity, spreads, order execution, and trading activity.
📌 Regulators & Compliance Teams
Ensure transparency, governance, and reporting accuracy.
📌 Brokers & Investment Platforms
Track execution quality, market conditions, and system reliability.
📌 Financial Researchers & Students
Learn how real-world stock exchanges measure performance using KPIs.
If your work involves understanding stock market performance, this dashboard is built for you.
### Click here to read the Detailed blog post
Watch the step-by-step video tutorial:


Reviews
There are no reviews yet.