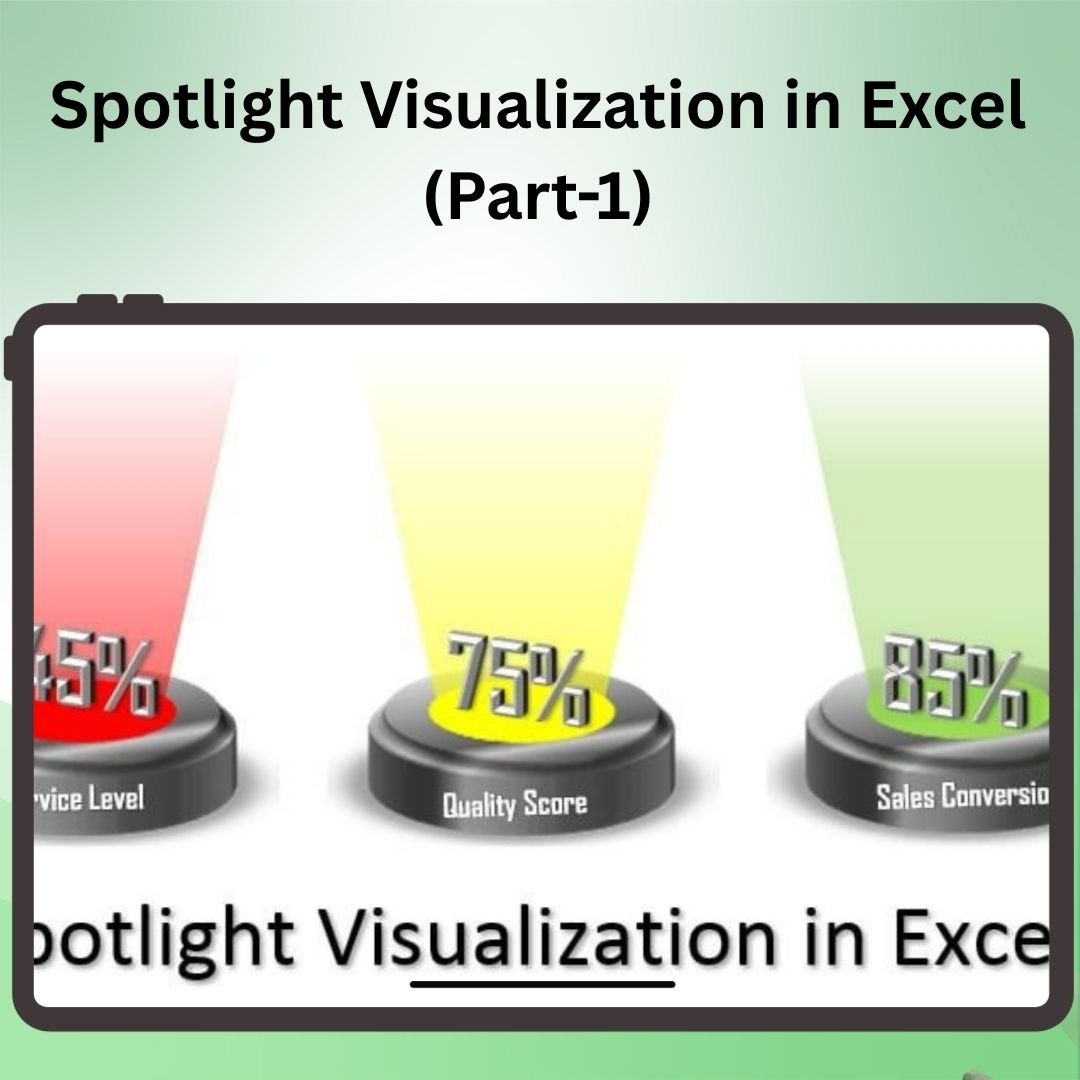
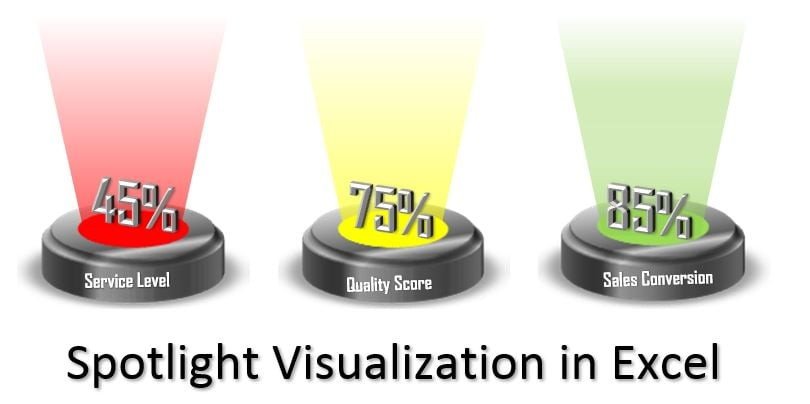
The Spotlight Visualization in Excel (Part 1) is a powerful and interactive tool that helps you emphasize key data points in your reports and dashboards. By applying a “spotlight” effect to important cells or ranges of data, this tool ensures that critical metrics or trends stand out visually, making it easier to draw attention to the most relevant information. Whether you’re analyzing sales figures, financial reports, or project performance, this spotlight effect adds a dynamic visual element to your Excel worksheets.
Part 1 of this tool focuses on setting up the basic spotlight effect using Excel’s conditional formatting features. With this tool, you can create a clean, focused view of your data, making it more digestible for stakeholders and team members. It’s ideal for business reports, presentations, and any situation where you need to highlight certain parts of your data for immediate attention.
Key Features of the Spotlight Visualization in Excel (Part 1):
💡 Emphasize Key Data Points
Apply a spotlight effect to specific cells or ranges in your Excel worksheet to draw attention to important data points, trends, or changes.
⚙️ Conditional Formatting Integration
Utilize Excel’s built-in conditional formatting tools to create the spotlight effect. Customize the formatting rules based on your data, such as highlighting values that meet specific conditions.
📊 Simple and Effective Setup
Part 1 of the Spotlight Visualization is designed to be simple to set up. Even if you’re not an Excel expert, you can easily create an interactive spotlight effect in just a few steps.
🎨 Customizable Spotlight Area
Select which data points, cells, or ranges should be spotlighted, and adjust the formatting style to match your reporting or presentation needs.
🔄 Dynamic and Real-Time Updates
The spotlight effect automatically updates when new data is entered or existing data is modified, ensuring your visualizations are always up to date.
Why You’ll Love the Spotlight Visualization in Excel (Part 1):
✅ Focus Attention on Key Data – Draw immediate attention to critical metrics, ensuring that your audience knows exactly where to look for important insights. ✅ Easy to Implement – Set up the spotlight effect with minimal effort using Excel’s conditional formatting tools. ✅ Customizable for Your Needs – Choose which data to spotlight and tailor the formatting to match your preferences. ✅ Real-Time Updates – The spotlight automatically updates as new data is entered, keeping your reports and presentations current. ✅ Perfect for Reports and Presentations – Highlight key insights in business reports, financial analysis, and presentations to make them more engaging and easier to understand.
What’s Inside the Spotlight Visualization in Excel (Part 1):
- Spotlight Effect Setup – Apply a spotlight to key data points in your Excel worksheet.
- Conditional Formatting – Use Excel’s conditional formatting tools to create the spotlight effect based on specific conditions.
- Customizable Design – Adjust the spotlight to fit your report or presentation style, choosing which cells or ranges to spotlight.
- Real-Time Data Integration – Automatically update the spotlight effect as new data is entered or existing data is modified.
How to Use the Spotlight Visualization in Excel (Part 1):
1️⃣ Download the Template – Access the Excel file immediately after purchase. 2️⃣ Input Your Data – Enter the data you want to analyze or present. 3️⃣ Set Up the Spotlight Effect – Use conditional formatting to spotlight specific cells or ranges of data. 4️⃣ Customize Your Spotlight – Adjust the formatting style, data range, and rules to match your needs. 5️⃣ Monitor Changes in Real-Time – Watch as the spotlight effect updates automatically as you modify or add new data.
Who Can Benefit from the Spotlight Visualization in Excel (Part 1):
- Business Analysts
- Data Analysts
- Project Managers
- Financial Analysts
- Marketing Teams
- Anyone creating reports or presentations with Excel data
The Spotlight Visualization in Excel (Part 1) is the perfect tool for anyone who wants to enhance their Excel reports and dashboards by drawing attention to important data points. With minimal setup and real-time updates, this tool makes data visualization more effective and engaging, helping you communicate key insights with clarity and impact.
Click here to read the Detailed blog post
https://www.pk-anexcelexpert.com/spotlight-visualization-in-excel-part-1/


Reviews
There are no reviews yet.