


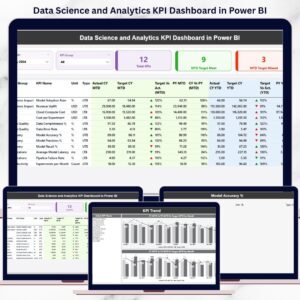
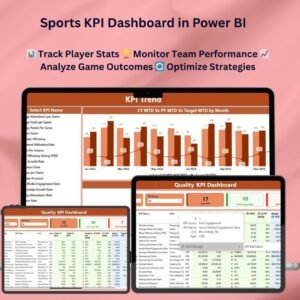
The Sports KPI Dashboard in Power BI is a powerful tool designed to help sports teams, coaches, and managers track, analyze, and visualize key performance indicators (KPIs) related to player performance, team efficiency, and match outcomes. This customizable dashboard enables real-time monitoring of individual player stats, team performance, and game results, providing invaluable insights to help optimize strategies and improve overall performance.
Whether you’re tracking scoring averages, player efficiency ratings, or team dynamics, this Power BI dashboard gives you a clear, interactive view of the essential metrics, enabling better decision-making and performance analysis.’

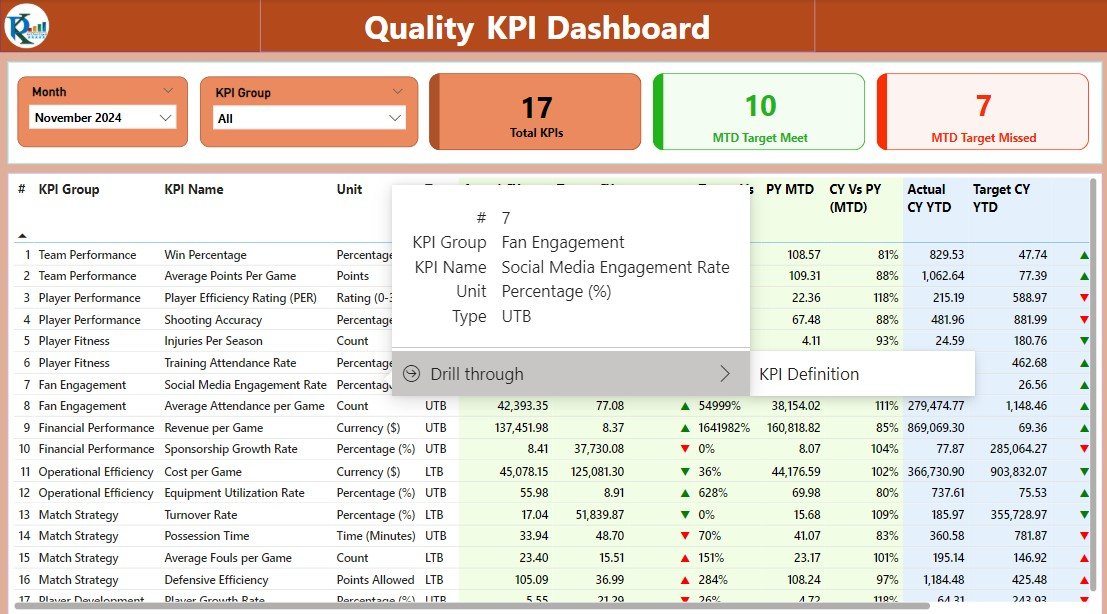
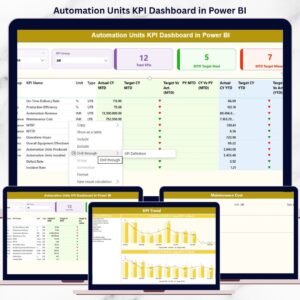
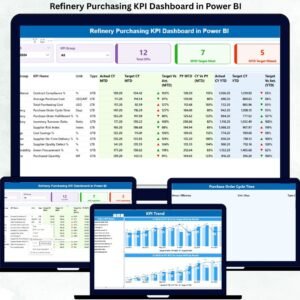
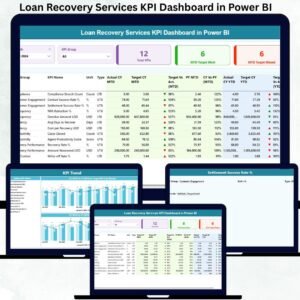
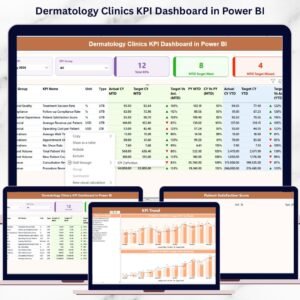
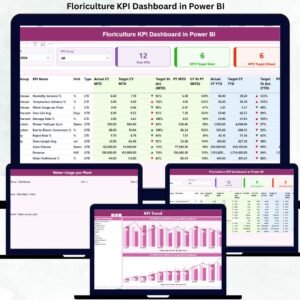
Key Features of the Sports KPI Dashboard in Power BI
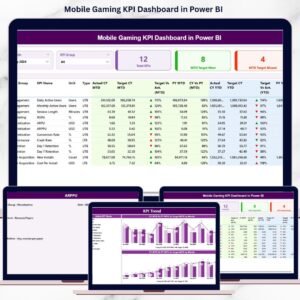
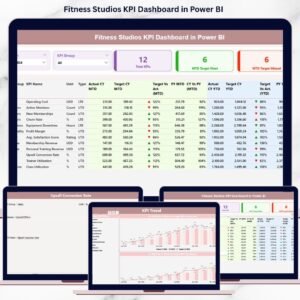
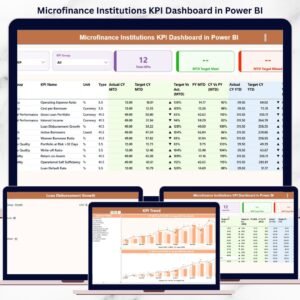
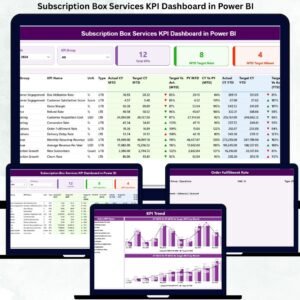
📊 Real-Time Data Visualization: Track key metrics such as player performance, match scores, and team efficiency in real-time.
⚙️ Customizable KPIs: Adapt the dashboard to monitor specific sports metrics, such as goals, assists, rebounds, shooting percentage, and more.
📈 Player Performance Analysis: Dive deep into individual player stats to evaluate performance and areas for improvement.
📅 Time-Based Insights: Analyze performance trends over time to assess improvements and changes in team dynamics.
📉 Comparative Data: Compare team performance across different games, seasons, or against opponents to identify strengths and weaknesses.
🔄 Interactive Dashboard: Use interactive filtering to explore specific metrics and uncover insights.
🧑💼 User-Friendly Interface: A simple, intuitive design ensures that coaches, managers, and analysts can easily navigate and use the dashboard.
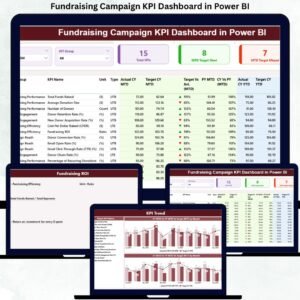
Why You’ll Love the Sports KPI Dashboard in Power BI
✅ Optimizes Team Performance: Quickly identify key performance areas for individual players and the team as a whole.
✅ Data-Driven Strategy: Make informed decisions based on real-time data to improve game strategies and player training.
✅ Customizable to Your Sport: Tailor the dashboard to your specific sport, whether it’s soccer, basketball, or any other team sport.
✅ Increases Competitive Advantage: Analyze competitor performance and compare against your own team to gain a competitive edge.
✅ Easy-to-Use: Designed for coaches and analysts at all levels, no technical expertise required.
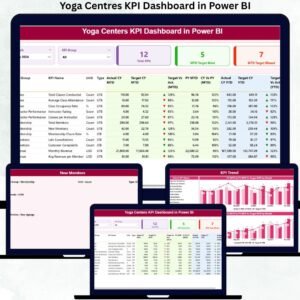
What’s Inside the Sports KPI Dashboard in Power BI?
📊 Player Statistics Monitoring: Track individual player performance, including scoring, assists, and defensive stats.
⚙️ Team Performance Analysis: Monitor overall team performance metrics such as win rates, shooting accuracy, and match efficiency.
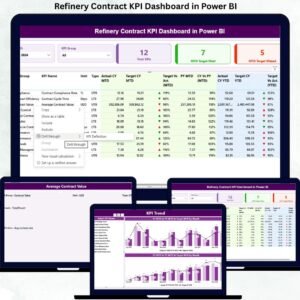
📈 Comparative Game Performance: Compare performance across different matches, seasons, or against opponents.
📅 Time-Based Trends: Track how player and team performance evolves over different time periods.
🔄 Interactive Features: Use filters and drill-down features to analyze specific game moments, players, or statistics.
How to Use the Sports KPI Dashboard in Power BI
1️⃣ Download the Dashboard Template – Get instant access to the Power BI file upon purchase.
2️⃣ Customize the KPIs: Modify the dashboard to track sport-specific metrics and KPIs for your team.
3️⃣ Input Your Data: Link your sports performance data to the Power BI dashboard for seamless tracking.
4️⃣ Analyze and Monitor: Use the dashboard to track performance and make data-driven decisions.
5️⃣ Generate Reports: Produce detailed reports to present key insights to team members and management.
Who Can Benefit from the Sports KPI Dashboard in Power BI?
🔹 Coaches
🔹 Team Managers
🔹 Sports Analysts
🔹 Athletes
🔹 Performance Coaches
🔹 Sports Organizations
🔹 Data Analysts in Sports
Enhance team management, track player performance, and make data-driven decisions to improve outcomes with this comprehensive Sports KPI Dashboard in Power BI.
Click here to read the detailed blog post
Visit our YouTube channel to learn step-by-step video tutorials


Reviews
There are no reviews yet.