Managing sports equipment manufacturing is no longer simple. Modern factories produce fitness machines, cricket gear, football equipment, athletic footwear, and gym accessories at high speed. However, as production grows, tracking performance becomes increasingly complex.
Manufacturers must simultaneously monitor production efficiency, product quality, workforce productivity, inventory flow, delivery timelines, and financial performance. When data exists in multiple spreadsheets, decision-making becomes slow and unclear.
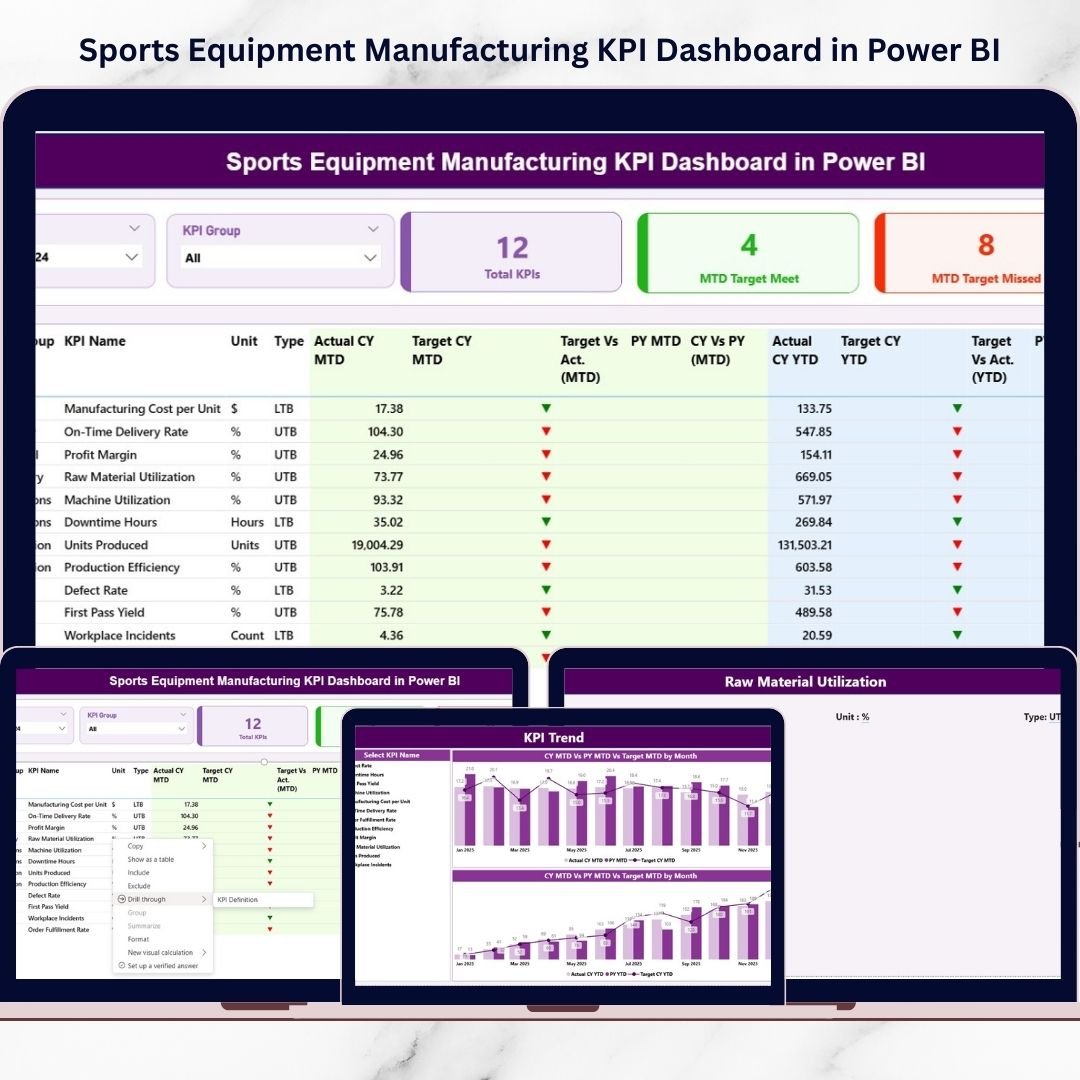
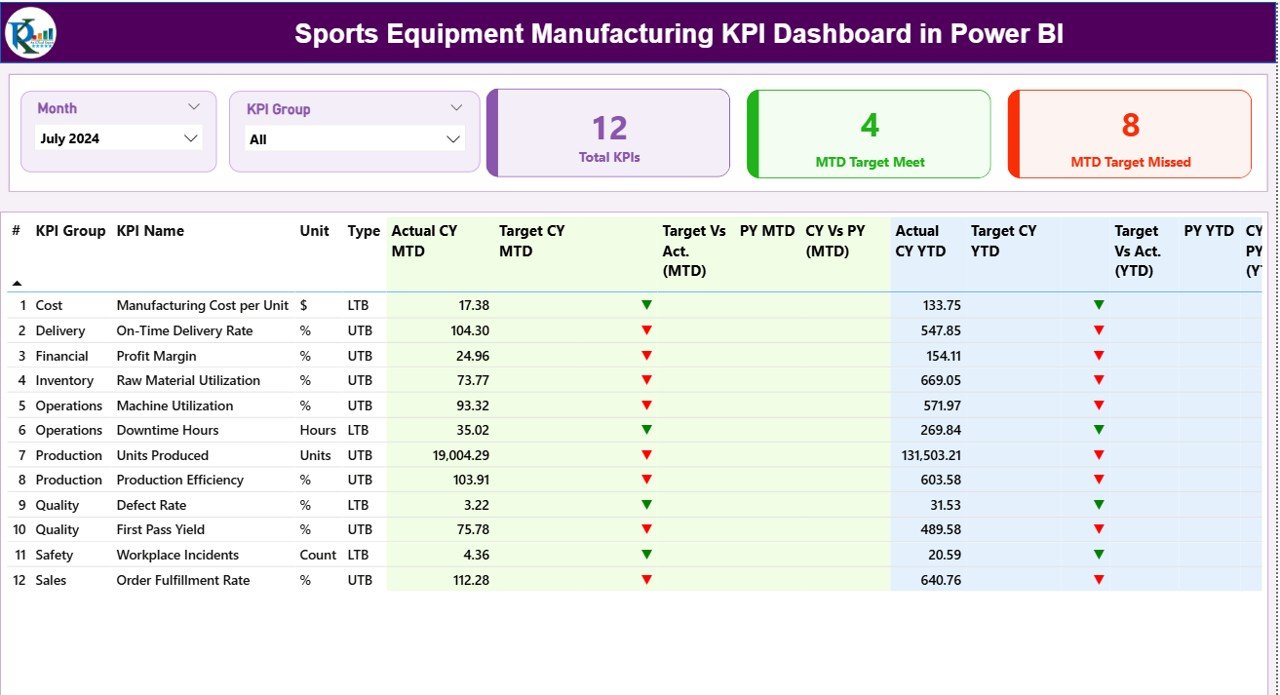
🚀 The Sports Equipment Manufacturing KPI Dashboard in Power BI solves this challenge by transforming raw Excel data into powerful, interactive business insights.
Instead of spending hours preparing reports, this ready-to-use dashboard allows managers to instantly visualize KPIs, compare targets with actual performance, and identify operational gaps using dynamic Power BI visuals.
Designed for both technical and non-technical users, this dashboard helps organizations shift from manual reporting to smart, data-driven manufacturing management.
## 🔥 Key Feature of Sports Equipment Manufacturing KPI Dashboard in Power BI
✅ Interactive KPI Monitoring – Track all manufacturing KPIs from one centralized dashboard.
📊 MTD & YTD Performance Analysis – Monitor Month-To-Date and Year-To-Date results automatically.
🎯 Actual vs Target Comparison – Instantly evaluate whether performance meets business goals.
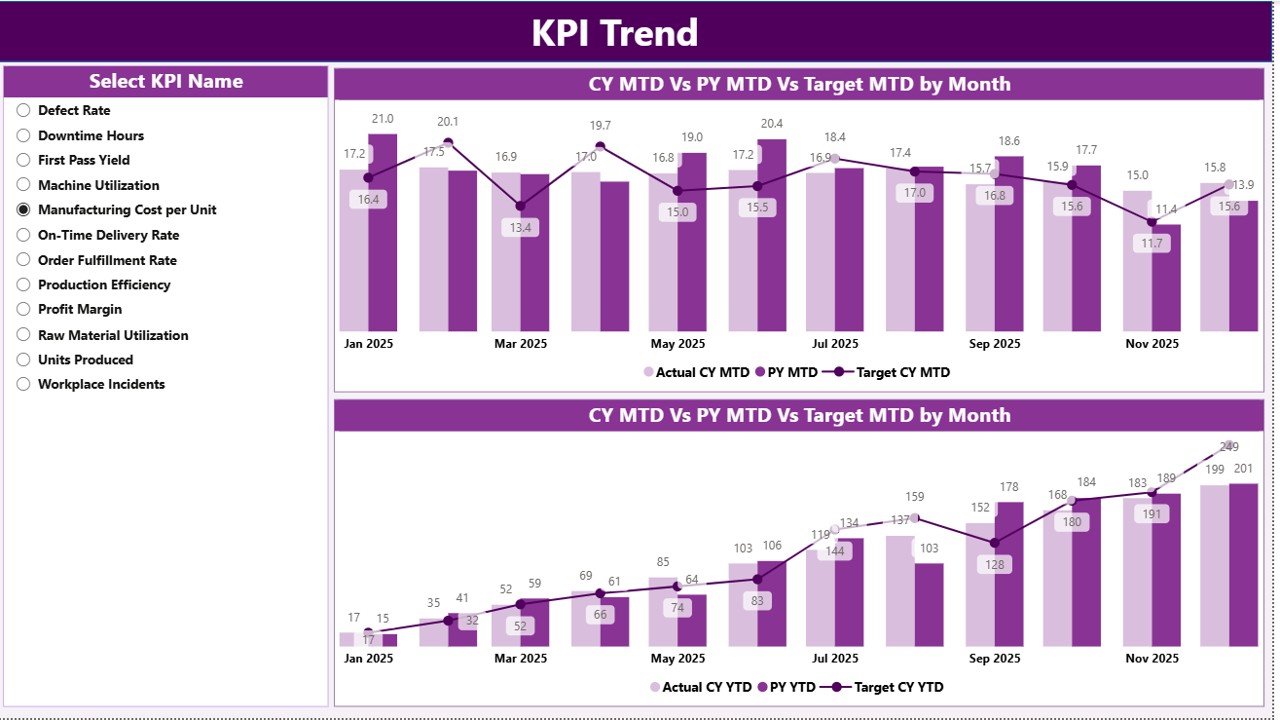
📈 Trend Analysis Visualization – Identify growth patterns, seasonal changes, and performance issues.
⚡ Automated Calculations – Power BI performs all KPI calculations without manual effort.
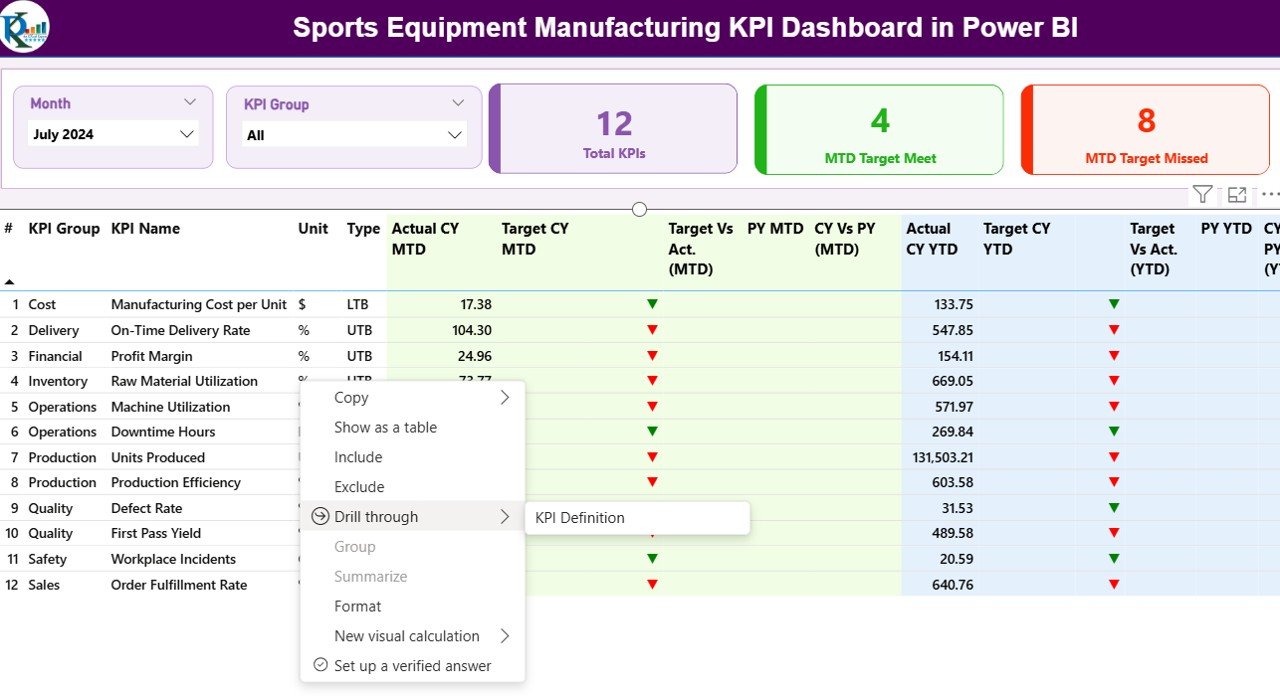
🧩 Drill-Through KPI Definitions – Click any KPI to view formulas, logic, and definitions.
🔎 Dynamic Filters & Slicers – Analyze data by Month or KPI Group instantly.
📉 Previous Year Comparison – Understand performance improvement with CY vs PY analysis.
👨💼 User-Friendly Interface – Easy navigation suitable for managers and executives.
## 📦 What’s Inside the Sports Equipment Manufacturing KPI Dashboard in Power BI
This ready-to-use solution includes a professionally designed Power BI dashboard supported by structured Excel data files.
Inside the product, you get:
📄 Summary Page
-
Complete KPI performance overview
-
KPI health cards (Total KPIs, Target Met, Target Missed)
-
Detailed KPI performance table
📊 KPI Trend Page
-
Interactive KPI selector
-
Combo charts comparing Actual, Target, and Previous Year
-
MTD & YTD performance visualization
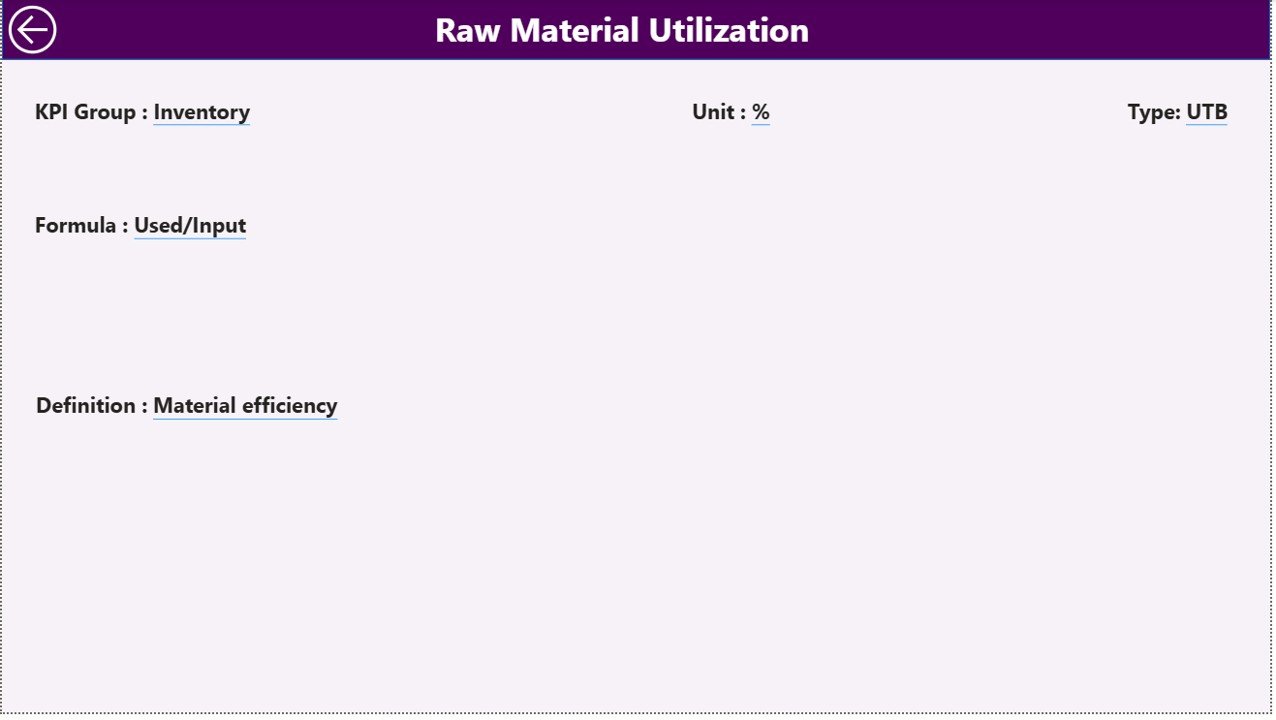
📘 KPI Definition Page
-
KPI formulas and measurement logic
-
LTB (Lower the Better) & UTB (Upper the Better) classification
-
Drill-through navigation
📁 Excel Data Source
-
Input Actual Sheet
-
Input Target Sheet
-
KPI Definition Sheet
Simply update Excel data and refresh Power BI — the dashboard updates automatically.
## ⚙️ How to Use the Sports Equipment Manufacturing KPI Dashboard in Power BI
Using this dashboard requires minimal technical knowledge.
1️⃣ Define manufacturing KPIs relevant to your operations.
2️⃣ Enter Actual and Target values in Excel sheets.
3️⃣ Connect or refresh the Power BI file.
4️⃣ Select Month or KPI Group using slicers.
5️⃣ Monitor performance using visuals and trend charts.
Within minutes, you gain a complete manufacturing performance overview without manual reporting.
## 👥 Who Can Benefit from This Sports Equipment Manufacturing KPI Dashboard in Power BI
This dashboard is ideal for professionals involved in manufacturing performance management:
🏭 Manufacturing Managers
📊 Operations Heads
✅ Quality Control Managers
🚚 Supply Chain Analysts
📈 Business Executives
👨💼 Plant Supervisors
📉 Performance Analysts
Whether you run a small manufacturing unit or a large production facility, this dashboard helps improve visibility, accountability, and decision-making.
By implementing this dashboard, organizations can:
✔ Reduce reporting time
✔ Improve operational transparency
✔ Detect performance issues early
✔ Enhance productivity and quality
✔ Make faster data-driven decisions
In today’s competitive manufacturing industry, businesses that use data effectively outperform competitors. This Power BI dashboard empowers your team with actionable insights that drive measurable results.
Click here to read the Detailed blog post
Watch the step-by-step video tutorial:


