Space technology operations demand absolute precision, real-time visibility, and performance accountability. Every satellite launch, mission milestone, R&D initiative, and operational system must perform exactly as planned. However, when KPI data is scattered across spreadsheets and static reports, leaders lose clarity and reaction time.
That is exactly why the Space Technology KPI Dashboard in Power BI is a must-have performance management solution for modern space organizations.
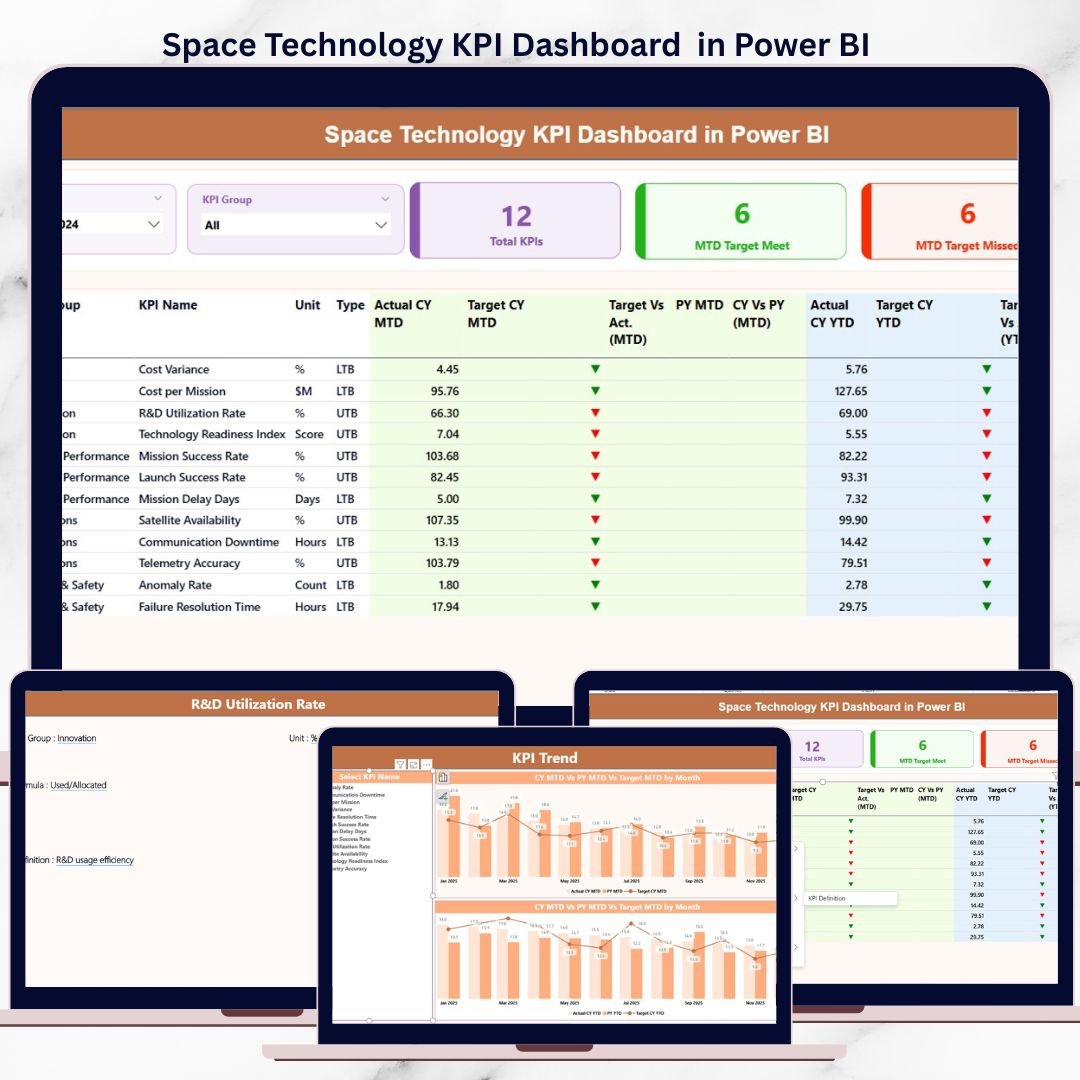
This ready-to-use dashboard converts complex KPI data into a single, interactive, and decision-ready view. Instead of manually tracking performance, teams can instantly monitor mission health, operational efficiency, and strategic progress—powered by Power BI visuals and a simple Excel data source.
🚀 Key Features of Space Technology KPI Dashboard in Power BI
🔹 Three Interactive Power BI Pages
Designed for executive overview, trend analysis, and KPI clarity—each page serves a clear analytical purpose.
🔹 Excel-Based Data Input
Update actuals, targets, and KPI definitions easily using Excel—no advanced technical skills required.
🔹 MTD & YTD Performance Tracking
Track Month-to-Date and Year-to-Date performance simultaneously for accurate short-term and long-term evaluation.
🔹 Target vs Actual Comparison
Instantly identify gaps using percentage variance calculations and visual indicators.
🔹 Current Year vs Previous Year Analysis
Measure improvement and regression with built-in year-over-year performance comparisons.
🔹 Visual Status Indicators
Green and red icons instantly highlight KPI performance—making risks visible at a glance.
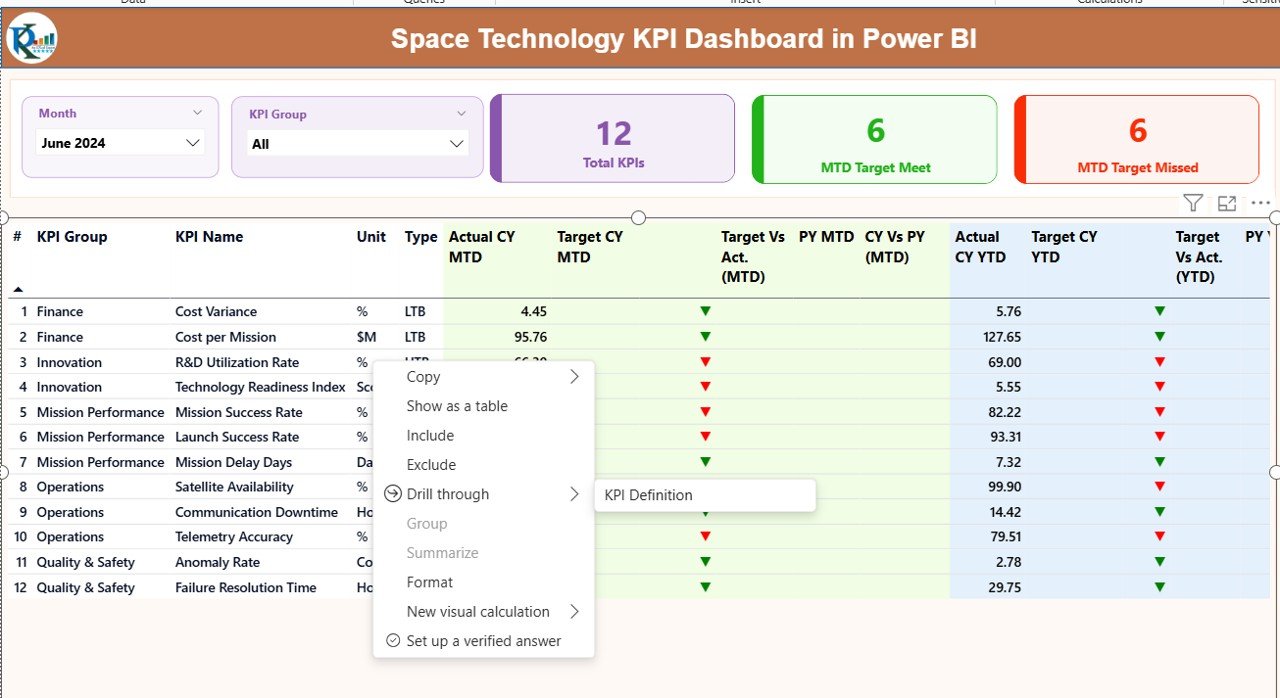
🔹 Drill-Through KPI Definitions
Maintain consistency with a dedicated KPI Definition page accessible directly from the dashboard.
📦 What’s Inside the Space Technology KPI Dashboard in Power BI
This digital product includes a professionally structured Power BI file connected to a clean Excel data model.
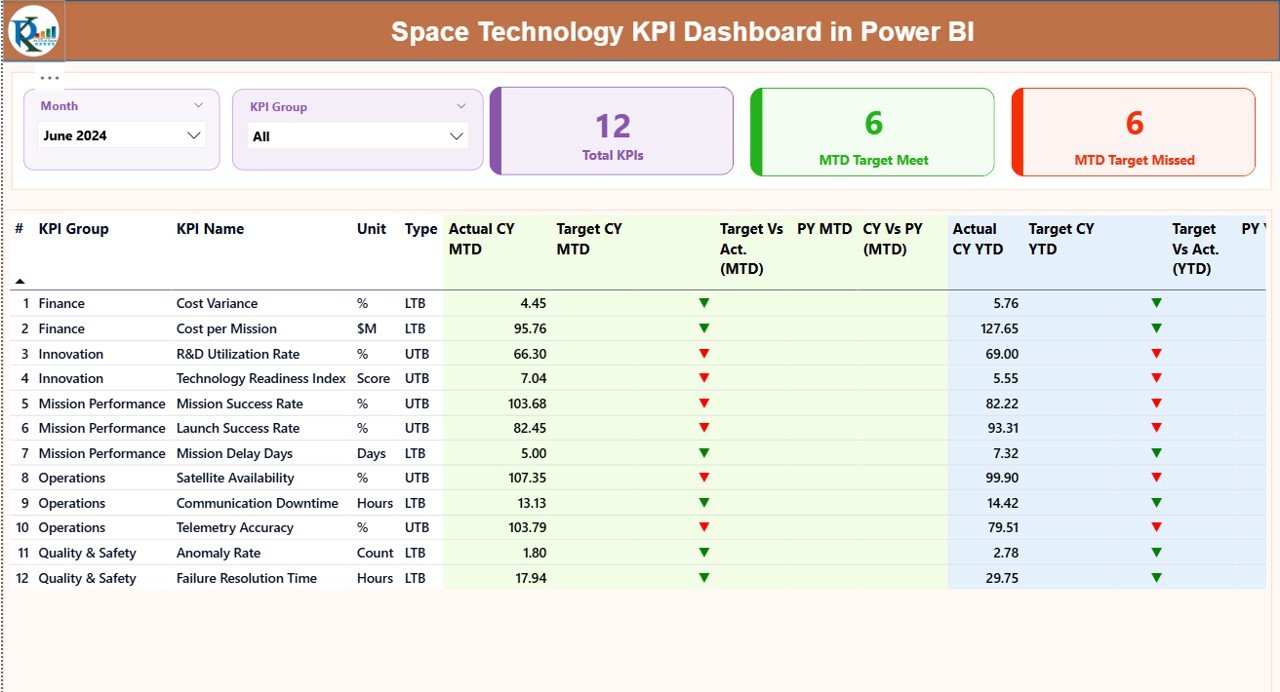
📊 Summary Page (Command Center)
-
Month and KPI Group slicers
-
KPI cards showing total KPIs, targets met, and targets missed
-
Detailed KPI table with MTD and YTD actuals, targets, previous year values, and variance percentages
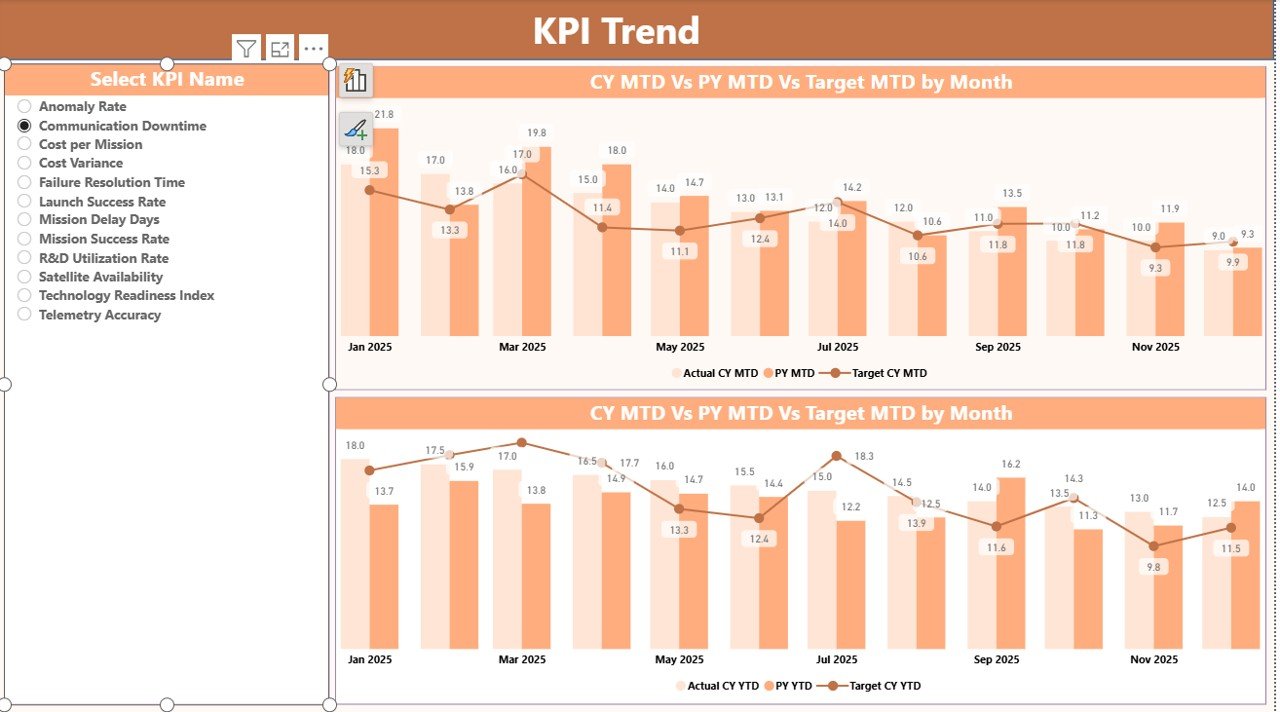
📈 KPI Trend Page
-
MTD and YTD combo charts
-
Current Year vs Previous Year vs Target comparison
-
KPI selection slicer for focused analysis
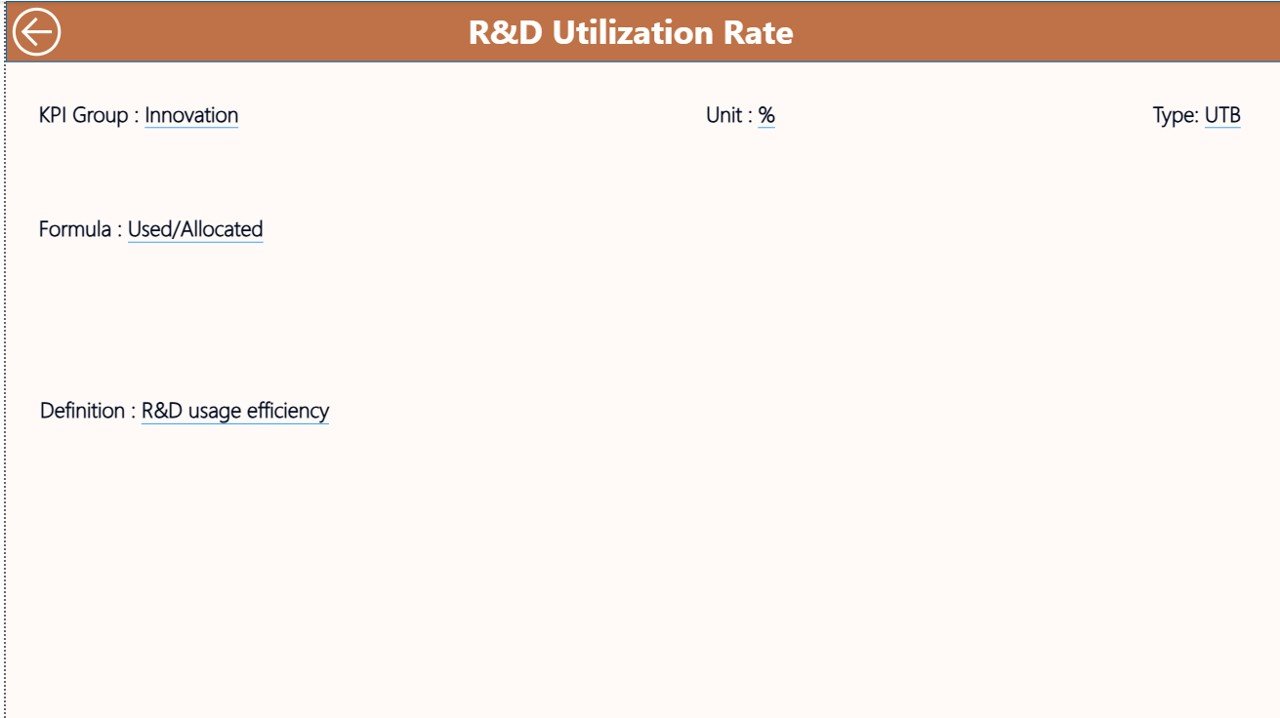
📘 KPI Definition Page
-
KPI formula, definition, unit, and KPI type (LTB / UTB)
-
Accessible via drill-through for full transparency
📂 Excel Data Source (3 Sheets)
-
Input_Actual – MTD & YTD actual performance
-
Input_Target – MTD & YTD targets
-
KPI Definition – KPI structure, grouping, and logic
🧭 How to Use the Space Technology KPI Dashboard in Power BI
1️⃣ Enter or update KPI data in the Excel input sheets
2️⃣ Refresh the Power BI dashboard
3️⃣ Select reporting month and KPI group using slicers
4️⃣ Review KPI status, trends, and variances instantly
5️⃣ Drill into KPI definitions for clarity and alignment
Because the dashboard automates calculations and visuals, reporting becomes faster, accurate, and repeatable.
👨🚀 Who Can Benefit from This Space Technology KPI Dashboard
This dashboard is ideal for:
🚀 Space agency leadership and executives
📡 Mission control and satellite operations teams
🧪 R&D and innovation managers
📊 Operations and performance analysts
📅 Program and portfolio management offices
Both technical and non-technical users can use it confidently.
Click here to read the Detailed blog post
Watch the step-by-step video tutorial:
Visit our YouTube channel to learn step-by-step video tutorials:
YouTube.com/@PKAnExcelExpert


Reviews
There are no reviews yet.