Space agencies operate at the edge of innovation. Satellite launches, deep-space missions, research breakthroughs, and billion-dollar budgets demand flawless execution. Space Research Agencies KPI Dashboard in Excel but while missions aim for the stars, performance tracking often stays stuck in scattered spreadsheets.
Manual consolidation. Delayed reporting. Limited visibility.
Meanwhile, leadership demands real-time insights. Stakeholders expect measurable progress. Project managers need clear mission control.
What if you could monitor mission performance, budget utilization, R&D progress, and operational efficiency — all inside one structured Excel system?
Space Research Agencies KPI Dashboard in Excel That’s exactly what the Space Research Agencies KPI Dashboard in Excel delivers. 🌌
This ready-to-use Excel dashboard helps agencies track MTD (Month-to-Date) and YTD (Year-to-Date) performance, compare Actual vs Target, analyze Previous Year trends, and visualize progress — all in a professional, centralized format.
No expensive systems. No complex integration. Just powerful mission tracking.
🚀 Key Feature of Space Research Agencies KPI Dashboard in Excel
This professionally designed dashboard includes 7 fully integrated worksheets for complete performance monitoring.
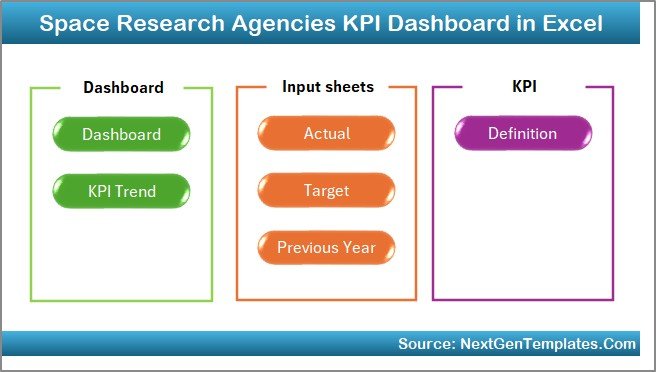
🏠 Home Sheet – Smart Navigation Hub
6 interactive buttons let you jump instantly to:
Dashboard | KPI Trend | Actual Input | Target Sheet | Previous Year | KPI Definition
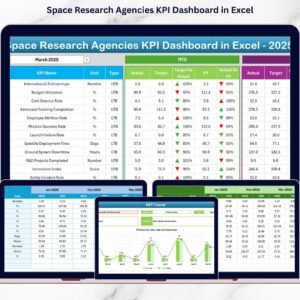
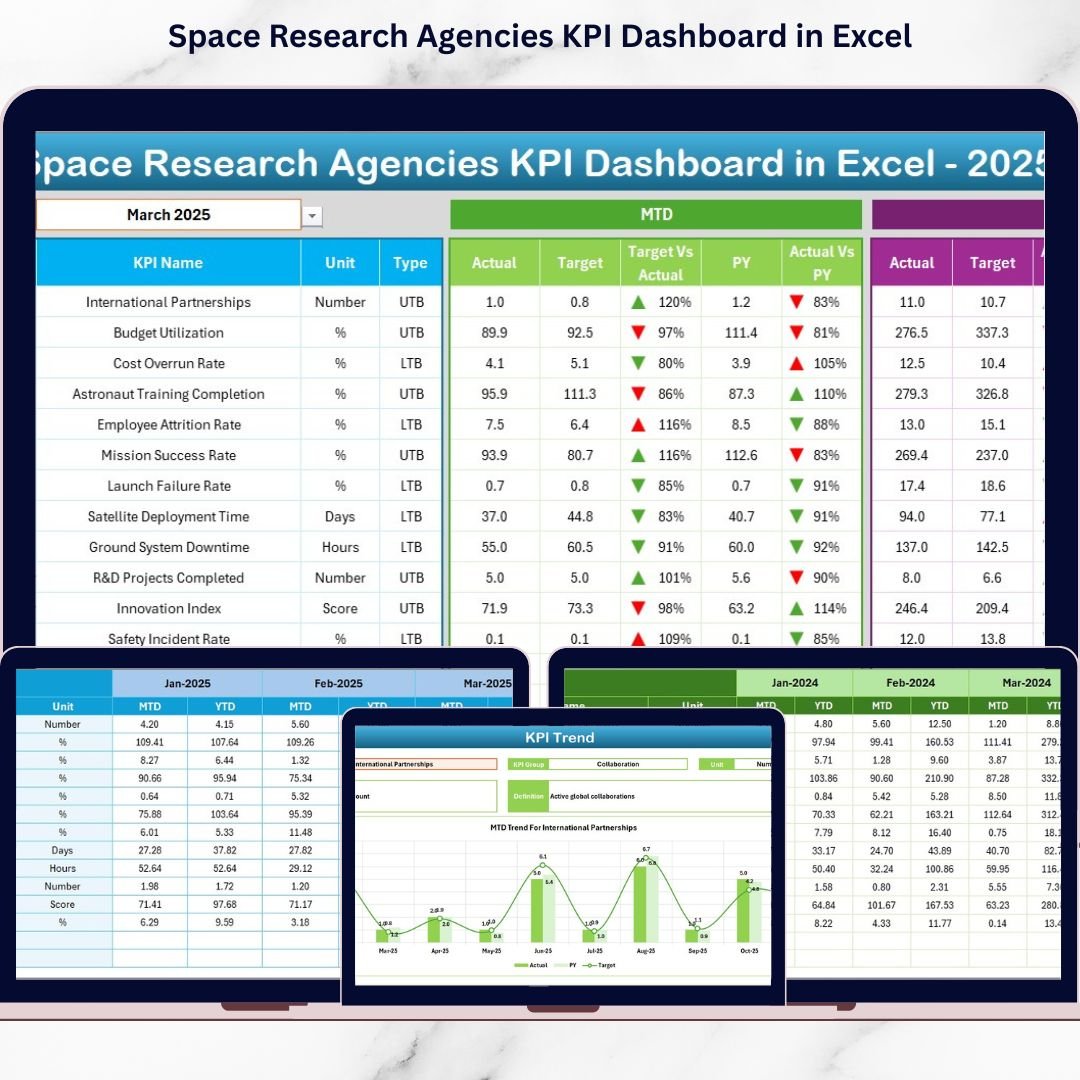
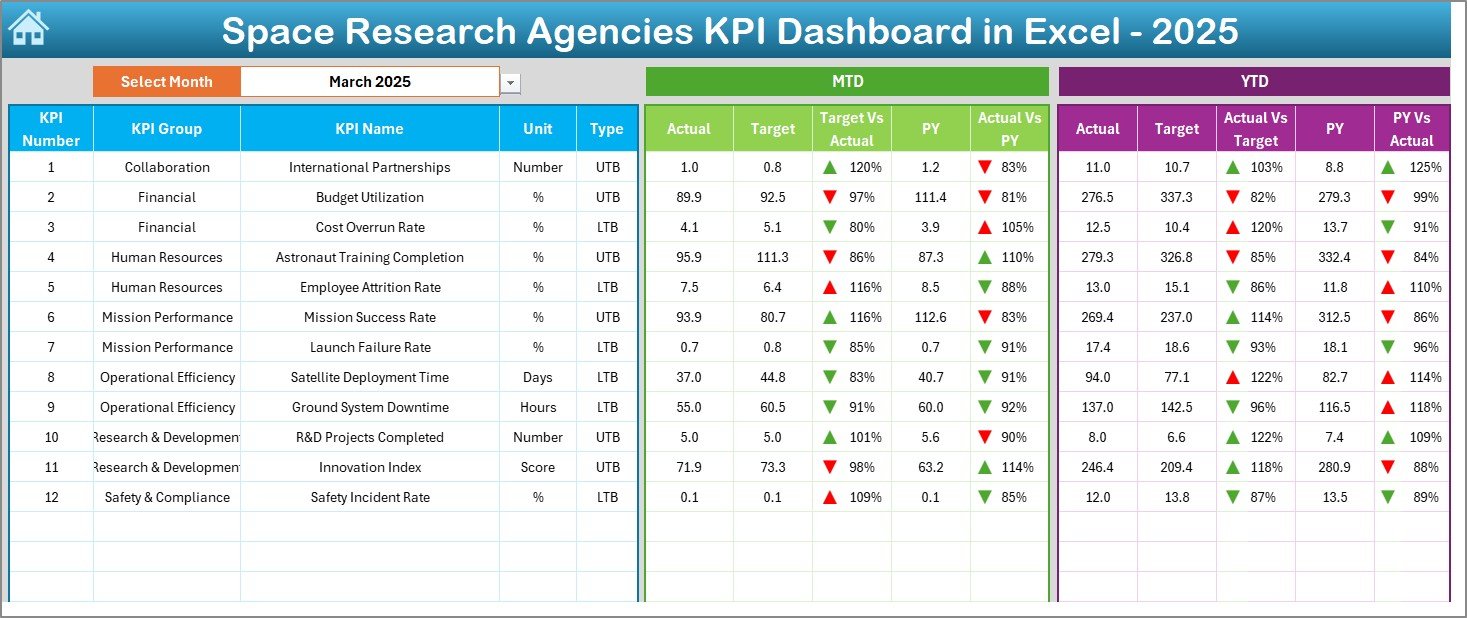
📊 Dashboard Sheet – Mission Control Center
Select Month in cell D3 and the entire dashboard updates automatically.
✔ MTD Actual vs Target
✔ YTD Actual vs Target
✔ Previous Year Comparison
✔ Target vs Actual Variance
✔ PY vs Actual Growth %
✔ ▲ Green / ▼ Red Performance Indicators
Instantly detect underperformance and success areas.
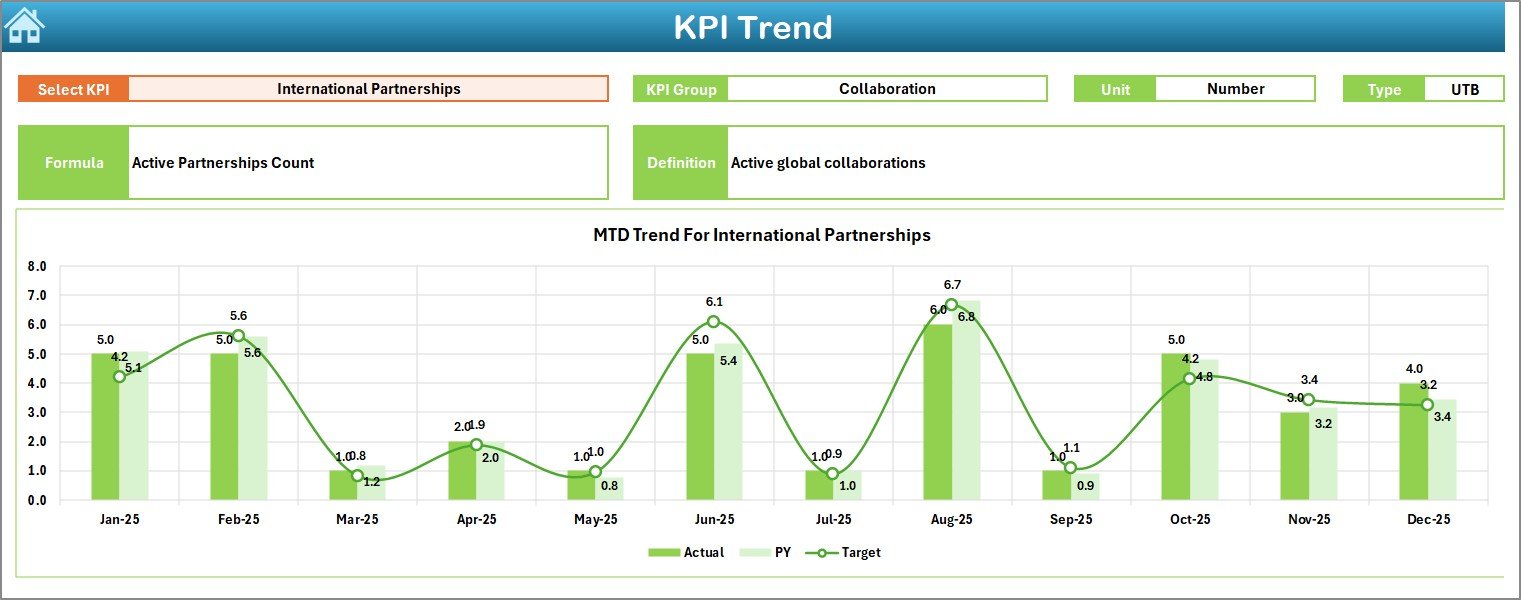
📈 KPI Trend Sheet – Performance Over Time
Select KPI in cell C3 and analyze:
✔ KPI Group & Unit
✔ KPI Type (LTB / UTB)
✔ Formula & Definition
✔ MTD Trend Chart (Actual vs Target vs PY)
✔ YTD Trend Chart (Actual vs Target vs PY)
Understand patterns, seasonal performance, and long-term growth.
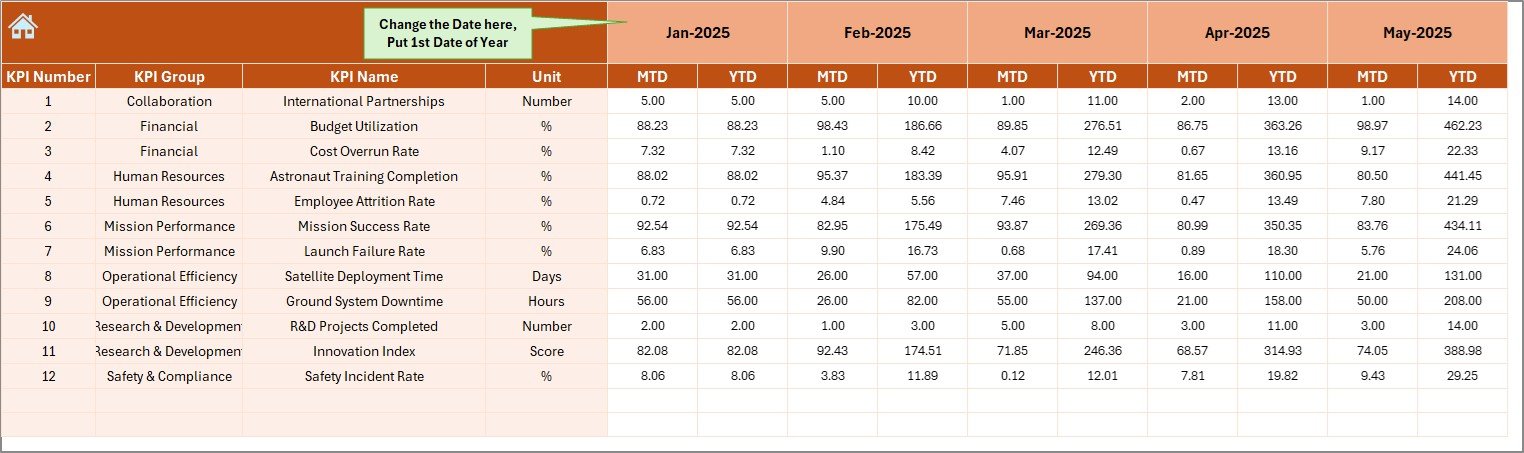
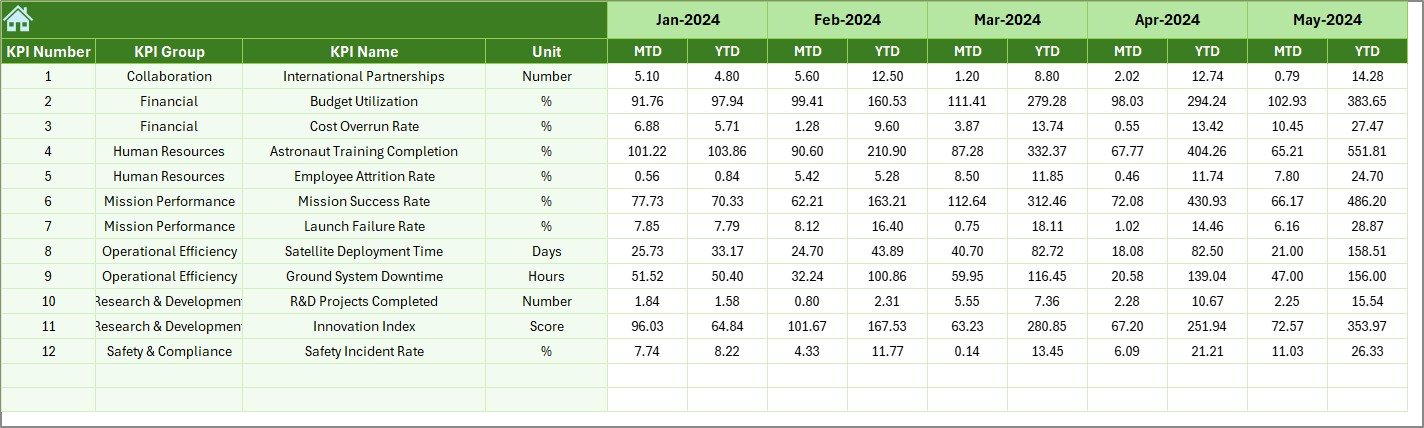
📝 Actual Numbers Input Sheet
Enter MTD and YTD data monthly. All calculations update automatically.
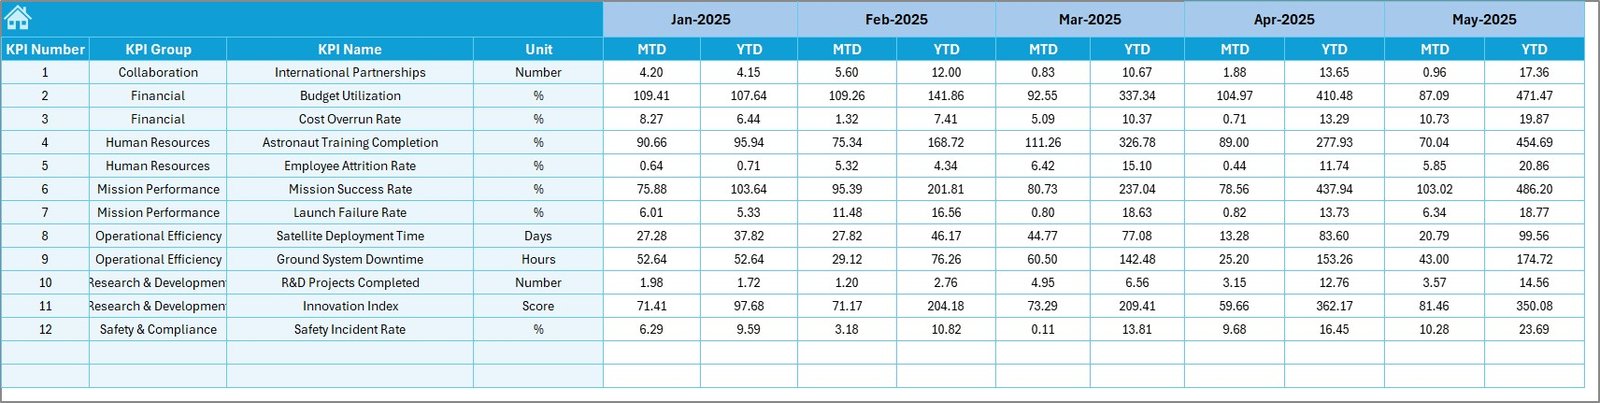
🎯 Target Sheet
Define performance goals for accountability and direction.
📅 Previous Year Sheet
Benchmark current performance against historical data.
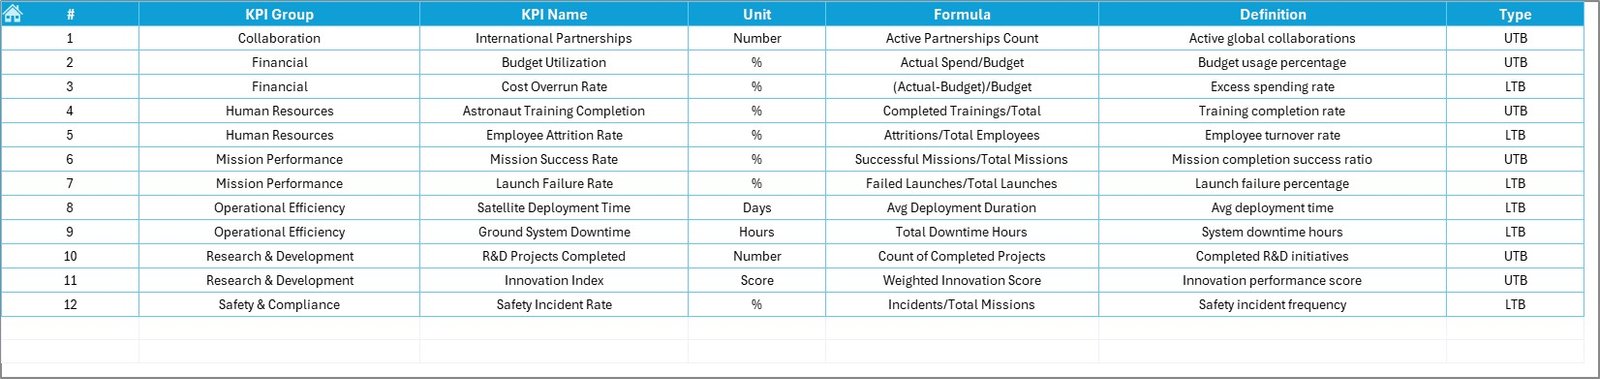
📘 KPI Definition Sheet
Standardize KPI logic and ensure clarity across departments.
Everything connects dynamically — update once, analyze everywhere.
📦 What’s Inside the Space Research Agencies KPI Dashboard in Excel
When you purchase this dashboard, you receive:
✔ 7 structured Excel worksheets
✔ Automated MTD & YTD calculations
✔ Actual vs Target comparison logic
✔ Previous Year benchmarking system
✔ Trend charts for deep analysis
✔ Conditional performance arrows
✔ Centralized KPI documentation
✔ Easy dropdown-based month selection
This is not just a spreadsheet — it’s a structured mission performance management system.
🛠 How to Use the Space Research Agencies KPI Dashboard in Excel
Getting started is simple:
1️⃣ Enter current year MTD & YTD numbers in the “Actual Input” sheet.
2️⃣ Define targets in the “Target Sheet.”
3️⃣ Add previous year data in the “Previous Year Sheet.”
4️⃣ Go to the Dashboard and select the Month.
The dashboard instantly displays:
• Mission performance metrics
• Budget utilization comparisons
• Growth vs last year
• Visual performance indicators
For deeper insights:
Open KPI Trend → Select KPI → Analyze performance charts.
No advanced Excel skills required.
🌌 Who Can Benefit from This Space Research Agencies KPI Dashboard in Excel
This dashboard is ideal for:
🚀 National Space Agencies
🛰 Satellite Development Programs
🔬 Research & Development Departments
💼 Aerospace Finance Teams
📊 Executive Leadership & Strategy Teams
🏢 Private Space Technology Companies
Whether managing 5 missions or 50 projects, this dashboard ensures structured visibility.
The Space Research Agencies KPI Dashboard in Excel helps you:
✔ Improve mission visibility
✔ Strengthen budget control
✔ Detect performance risks early
✔ Enhance cross-department alignment
✔ Increase stakeholder confidence
✔ Support data-driven strategic decisions
Instead of reacting to delays, you take proactive control.
If you want structured, professional, and measurable mission tracking, this Excel dashboard becomes your essential management tool.
Click here to read the Detailed blog post
Visit our YouTube channel to learn step-by-step video tutorials:
👉 https://youtube.com/@PKAnExcelExpert