Are you still managing solar manufacturing performance using static spreadsheets and delayed reports? In today’s fast-growing renewable energy industry, real-time insights are no longer optional — they are essential for maintaining efficiency, quality, and profitability.
The Solar Panel Manufacturing KPI Dashboard in Power BI is a powerful, interactive analytics solution designed to help solar panel manufacturers monitor production performance, analyze KPIs dynamically, and make faster data-driven decisions.
Instead of struggling with disconnected Excel files and manual calculations, this professionally designed Power BI dashboard transforms raw manufacturing data into clear visual intelligence. With automated calculations, interactive filters, and trend analysis, decision-makers gain complete operational visibility in one centralized platform.
Whether you manage silicon processing, cell production, module assembly, testing, or packaging operations, this dashboard provides actionable insights that improve productivity and operational control.
🚀 Key Features of Solar Panel Manufacturing KPI Dashboard in Power BI
✅ Interactive KPI monitoring with dynamic slicers
✅ Real-time performance tracking using Power BI visuals
✅ MTD and YTD performance comparison indicators
✅ Target vs Actual and Current Year vs Previous Year analysis
✅ Automated KPI calculations and performance metrics
✅ Drill-through KPI definition insights
✅ Trend analysis with combo charts
✅ Scalable and customizable dashboard structure
Visual indicators and performance icons instantly highlight achievements and risks, enabling managers to respond proactively.
📦 What’s Inside the Solar Panel Manufacturing KPI Dashboard in Power BI
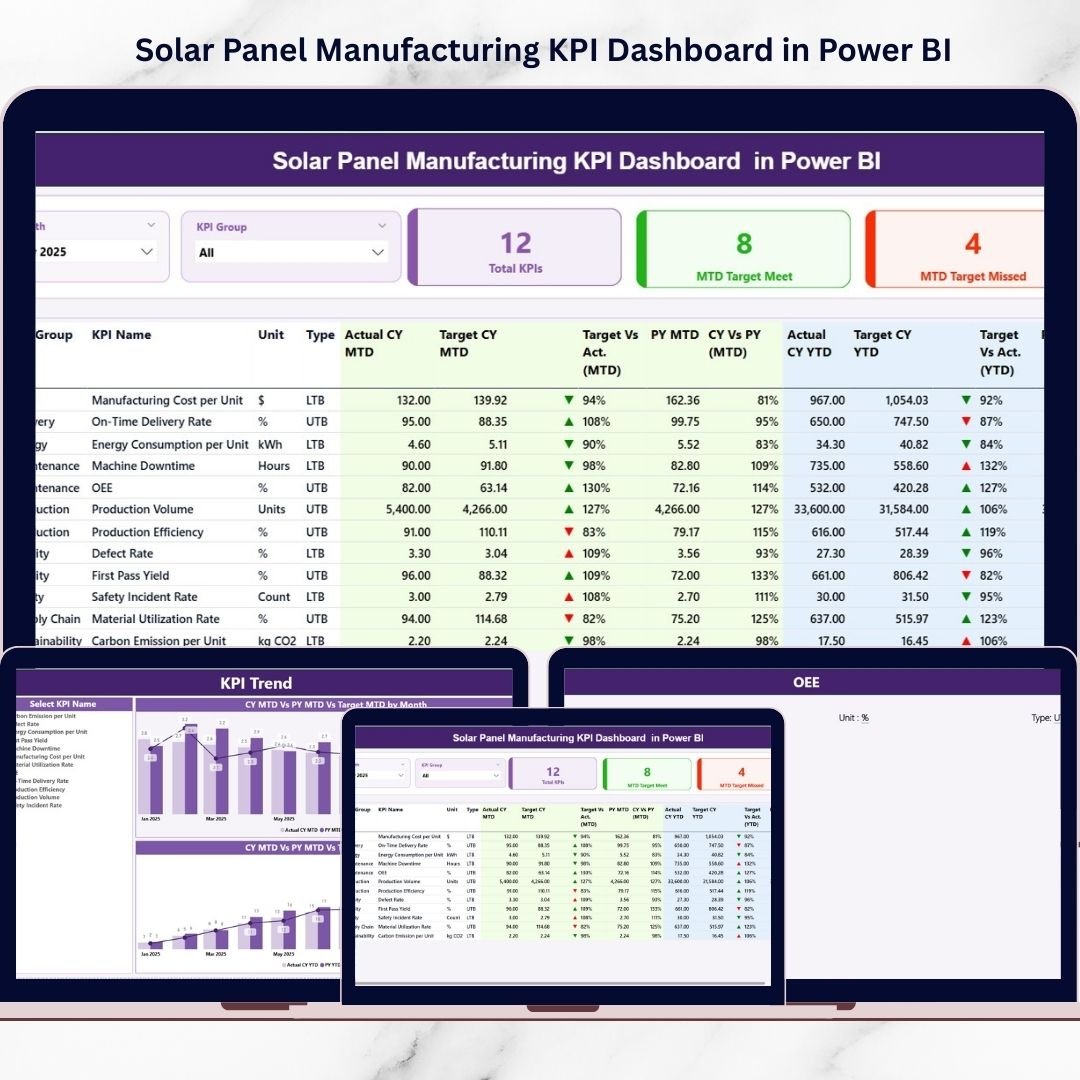
This ready-to-use dashboard contains three powerful analytical pages:
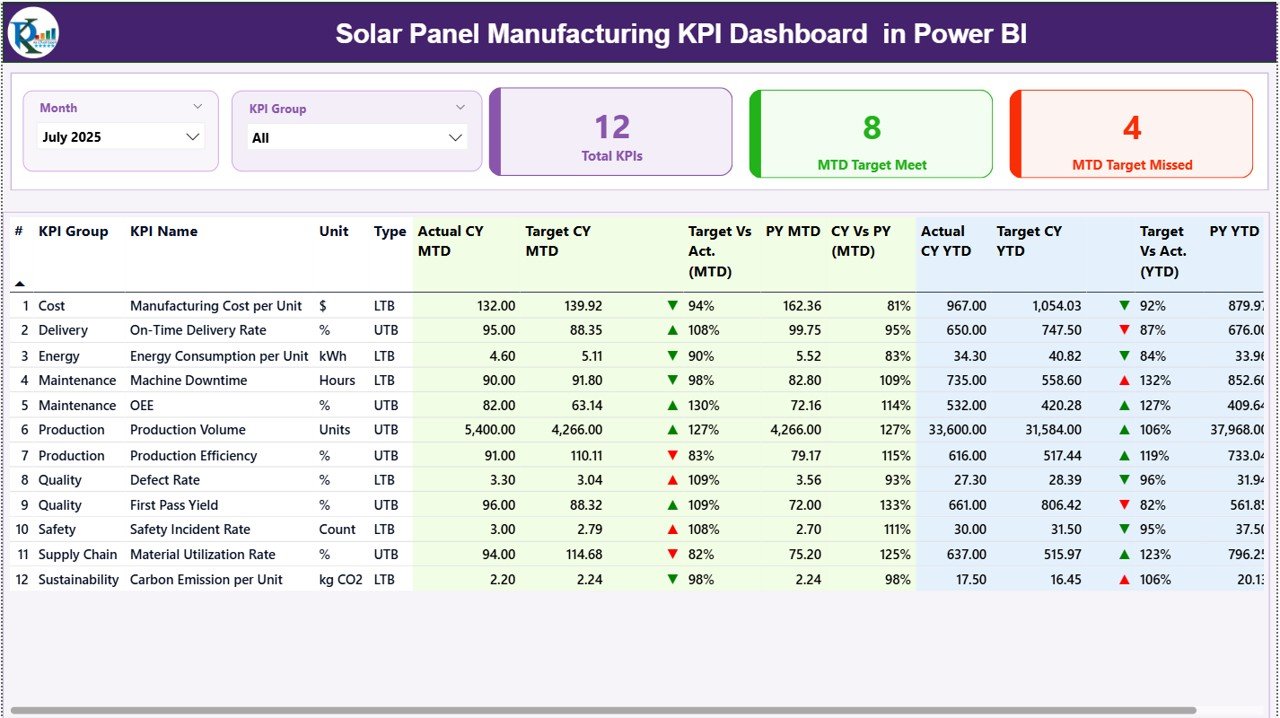
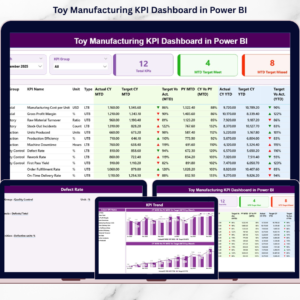
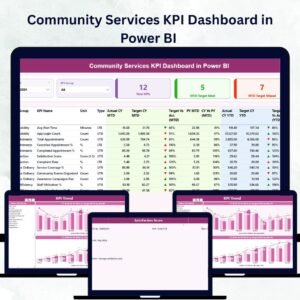
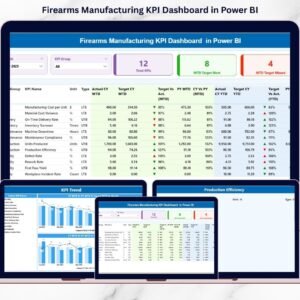
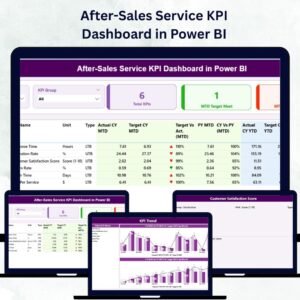
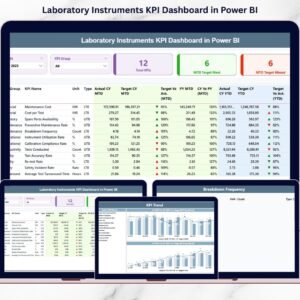
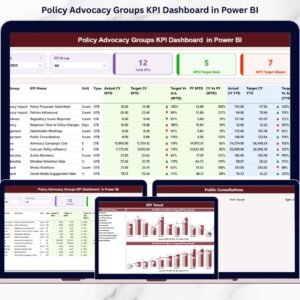
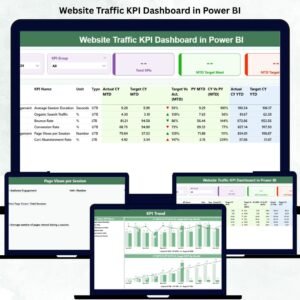
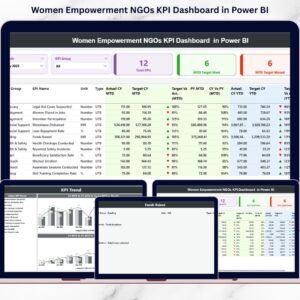
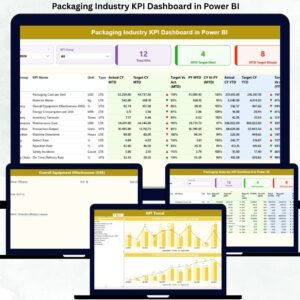
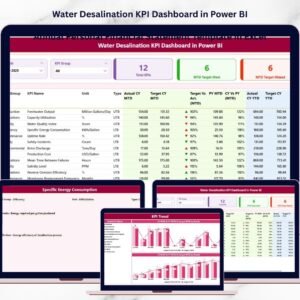
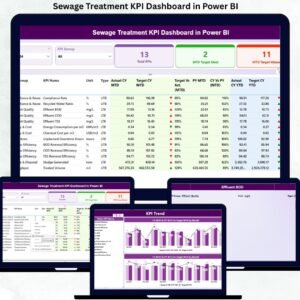
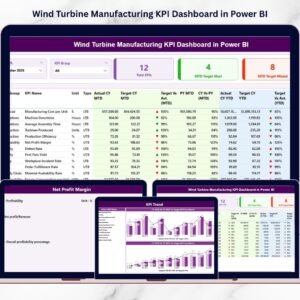
📊 Summary Page — KPI Control Center
Displays KPI performance cards, filters, and a detailed KPI performance table with monthly and yearly comparisons.
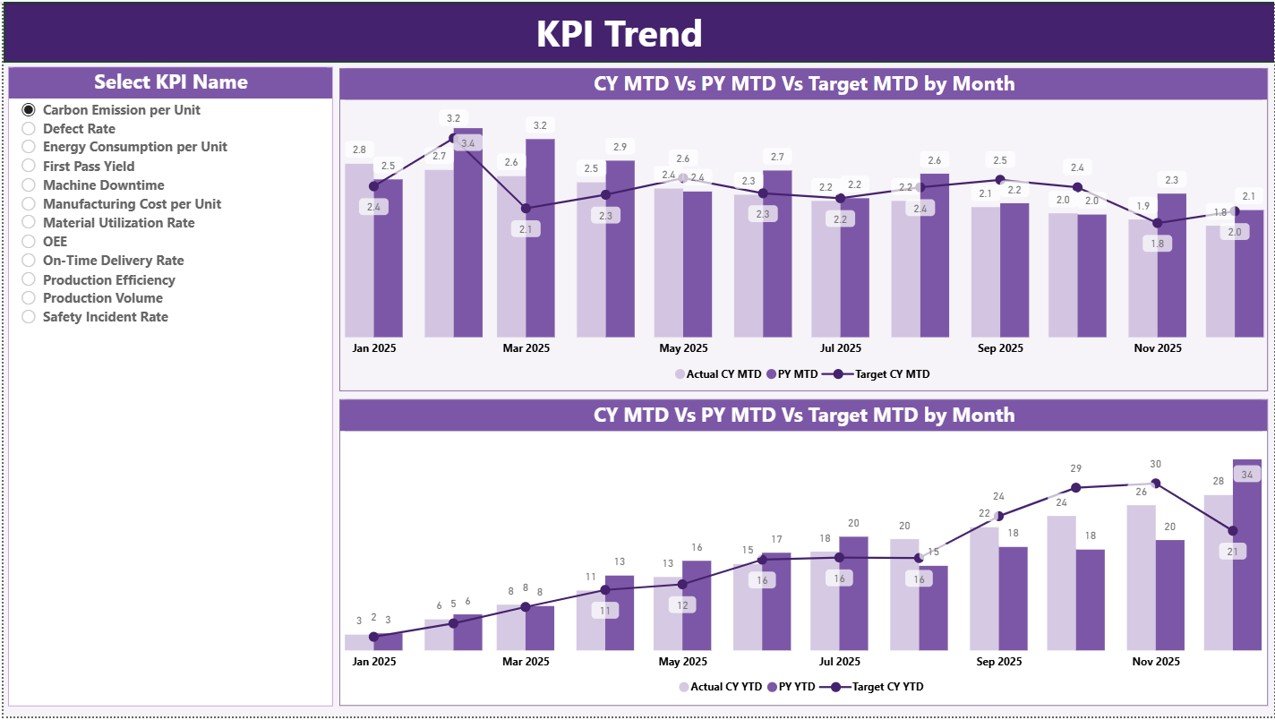
📈 KPI Trend Page — Performance Visualization
Dynamic charts analyze MTD and YTD trends comparing Actual, Target, and Previous Year values.
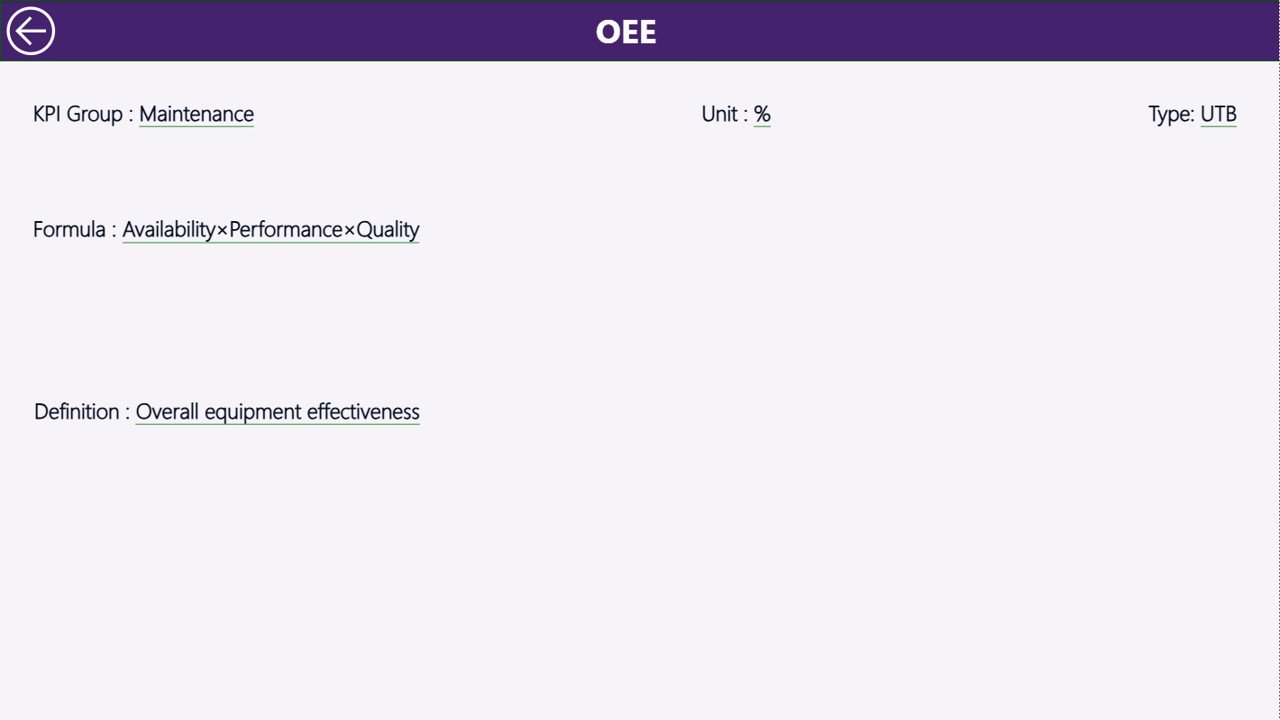
📘 KPI Definition Page — Drill-Through Insights
Provides KPI formulas, definitions, measurement logic, and KPI types for complete transparency.
Additionally, the dashboard connects seamlessly with structured Excel data sources for easy implementation.
🛠️ How to Use the Solar Panel Manufacturing KPI Dashboard in Power BI
Getting started is simple and requires minimal technical expertise:
1️⃣ Define KPIs using the Definition sheet
2️⃣ Enter Actual performance data in Excel source file
3️⃣ Add monthly and yearly targets
4️⃣ Import data into Power BI Desktop
5️⃣ Refresh the dashboard model
6️⃣ Use slicers to analyze performance instantly
All charts and metrics update automatically, eliminating manual reporting efforts.
👥 Who Can Benefit from This Solar Panel Manufacturing KPI Dashboard in Power BI
This dashboard is designed for multiple roles across manufacturing organizations:
👨🏭 Manufacturing Managers monitoring production efficiency
🏭 Plant Supervisors tracking operational performance
🔍 Quality Engineers analyzing defect and yield metrics
📊 Business Analysts evaluating trends and KPIs
📈 Operations Leaders improving productivity strategies
⚡ Renewable Energy Companies scaling analytics capabilities
Because of its intuitive interface, both technical and non-technical users can operate the dashboard easily.
By centralizing manufacturing KPIs into one interactive platform, organizations gain real-time insights, improve accountability, and accelerate decision-making. Instead of compiling reports manually, teams focus on performance improvement and strategic growth.
The Solar Panel Manufacturing KPI Dashboard in Power BI enables manufacturers to modernize reporting, enhance operational transparency, and build a strong foundation for Industry 4.0 analytics.
## Click here to read the Detailed blog post
Visit our YouTube channel to learn step-by-step video tutorials
👉 https://youtube.com/@PKAnExcelExpert