Managing the fast-growing smart home business requires clear visibility, accurate data, and timely decisions. From device installations to energy usage, customer service issues, app performance, sales goals, and automation behavior—every detail matters. The Smart Home Industry KPI Scorecard in Excel is designed to give you a complete 360° view of your operations using a clean, interactive, and ready-to-use Excel dashboard.
Built for managers, analysts, and decision-makers, this scorecard transforms raw KPI data into meaningful insights with zero coding and minimal effort. Whether you’re tracking device uptime, installation quality, or customer satisfaction, this powerful Excel template allows you to measure what truly matters—quickly, accurately, and visually.
✨ Key Features of the Smart Home Industry KPI Scorecard in Excel
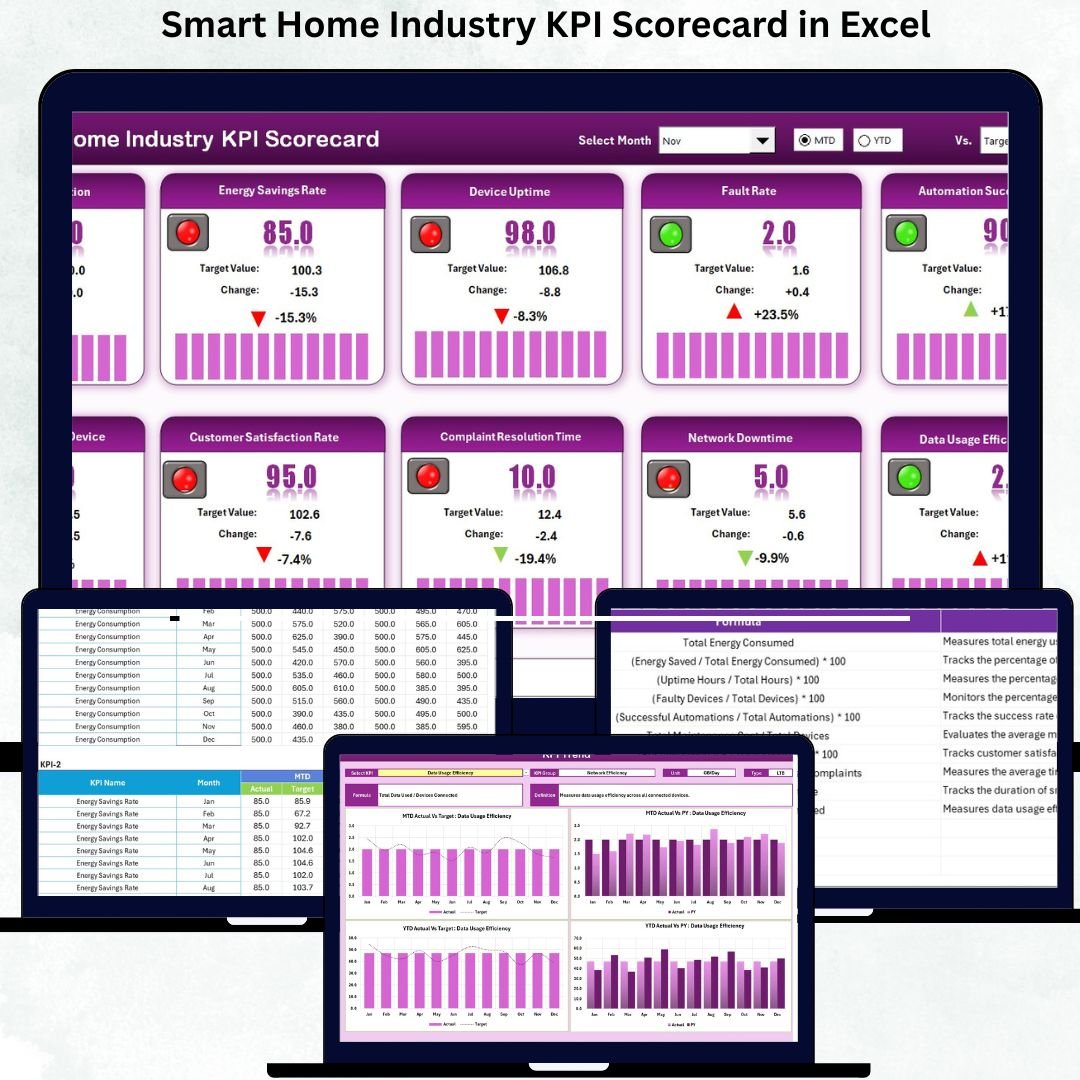
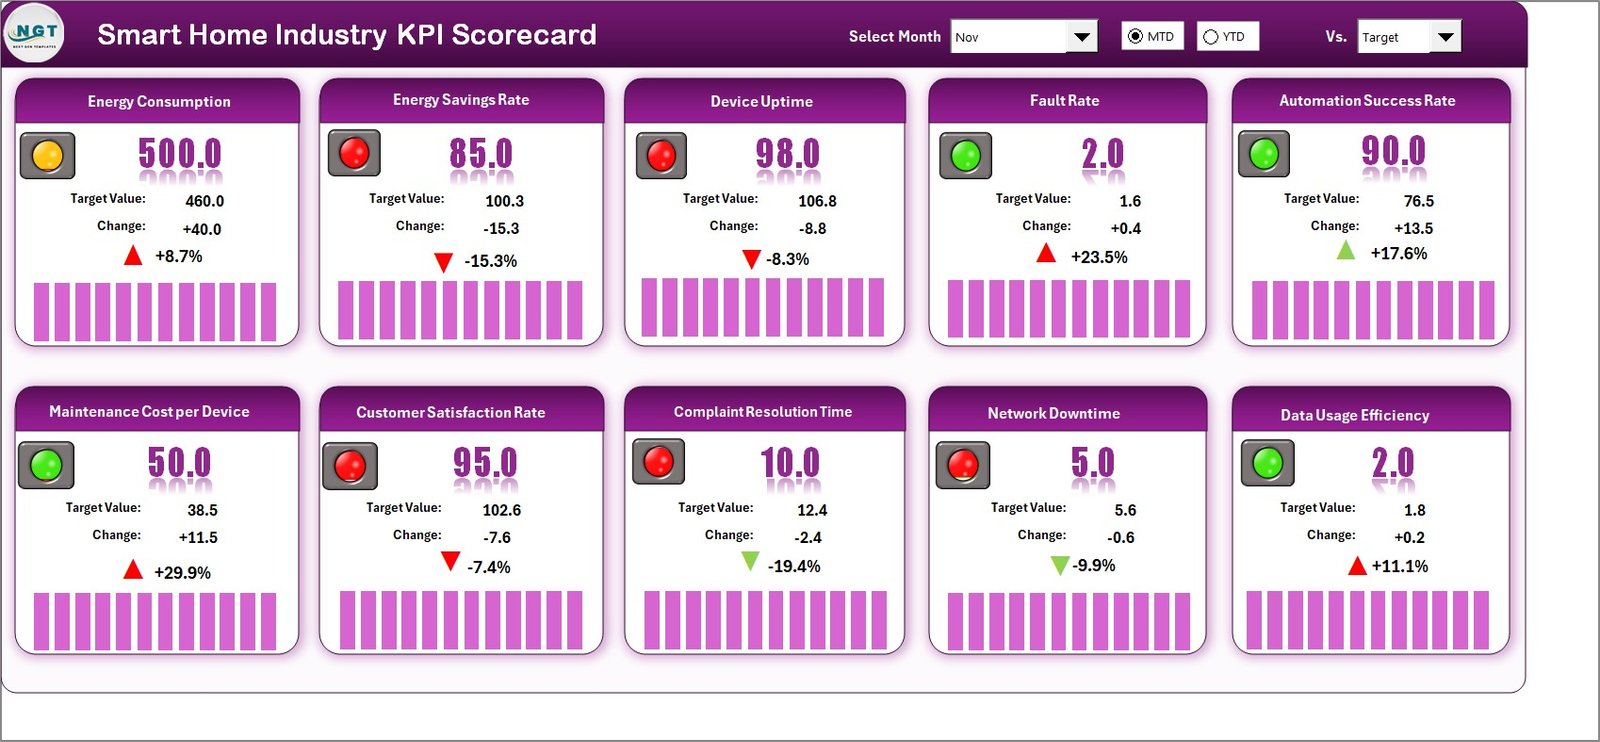
📊 Smart Scorecard Dashboard (Main Interface)
The dashboard displays everything you need in one place—KPI values, actual vs target comparison, color-coded indicators, and month-wise performance.
🔽 Dropdown-Based Insights
Switch between Month, MTD, and YTD in seconds using built-in dropdowns. No manual filtering needed.
🎯 Actual vs Target Tracking
Instantly see how your KPIs are performing against the targets you set—perfect for performance reviews and strategic planning.
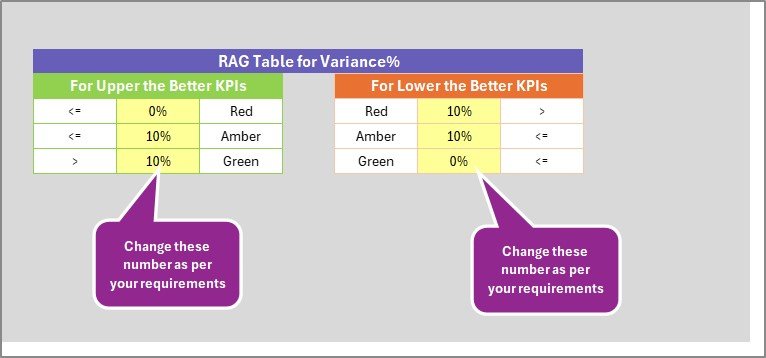
🚦 Color-Coded Visual Indicators
✔ Green = Achieved
⚠ Yellow = Needs Attention
✘ Red = Underperforming
These make it extremely easy to understand the status of every KPI.
📈 MTD & YTD Trend Analysis
Two dedicated trend charts automatically update to show Actual vs Target vs Previous Year performance.
🧠 Complete KPI Information
View KPI Group, Unit, Formula, Definition, and Type (UTB/LTB) with a single click.
📘 What’s Inside the Smart Home Industry KPI Scorecard in Excel
1️⃣ Scorecard Sheet – Main Dashboard
This is your high-impact KPI summary area. It includes:
-
KPI list with MTD/YTD values
-
Actual vs Target numbers
-
Visual indicators
-
Month selection
-
KPI group visibility
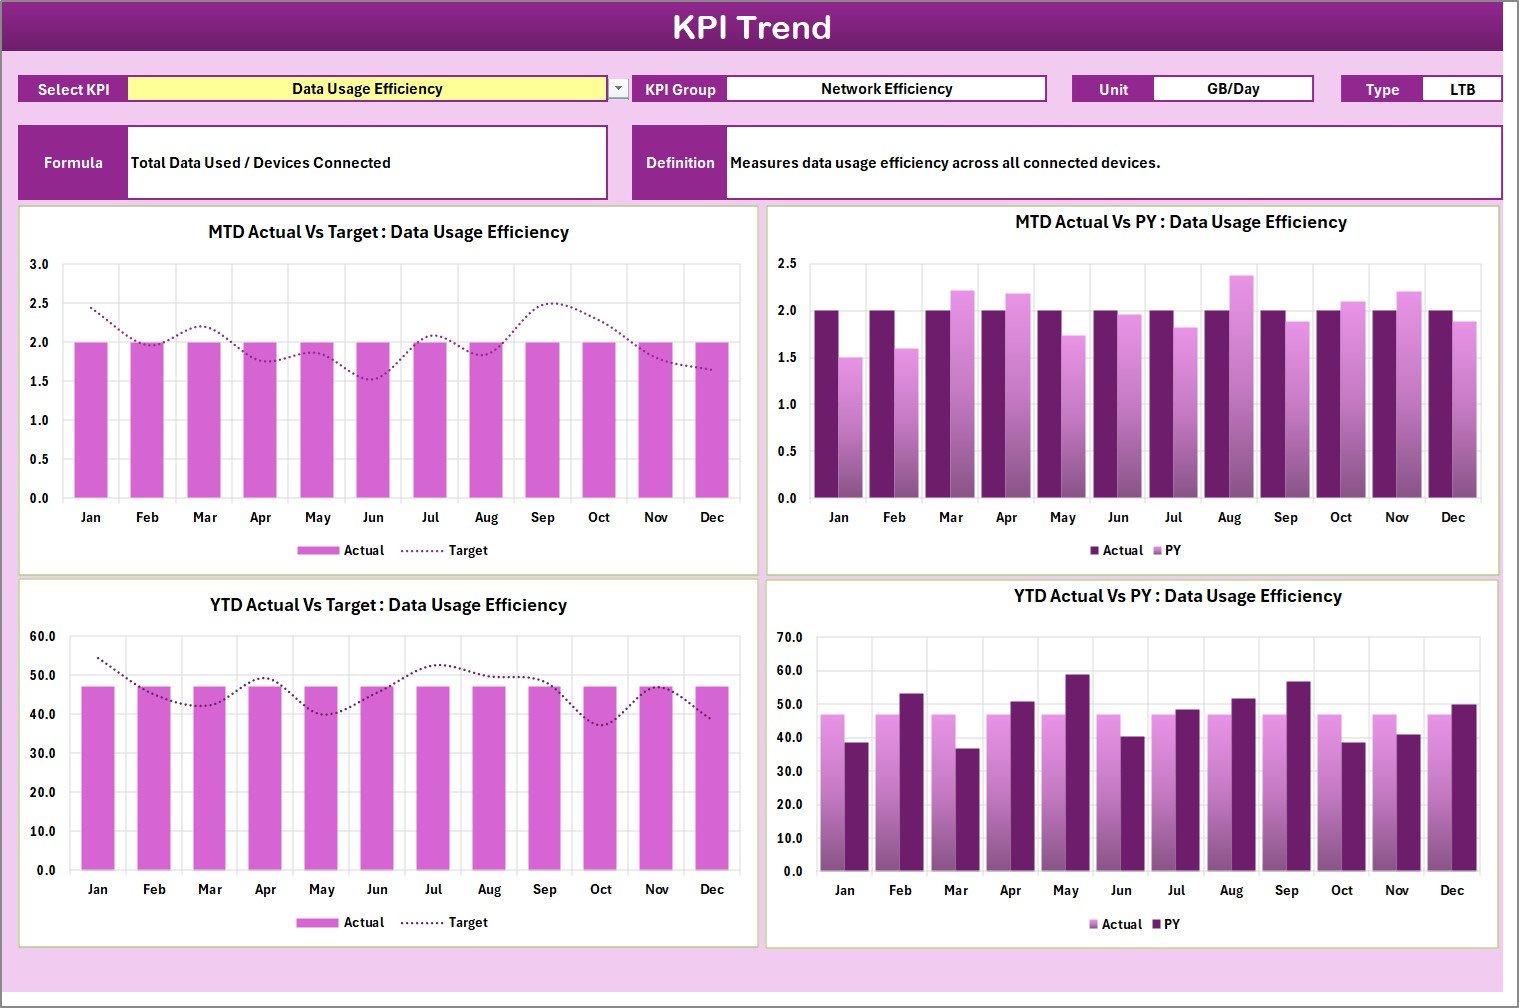
2️⃣ KPI Trend Sheet
Analyze the performance of each KPI over time with:
-
KPI dropdown in cell C3
-
MTD and YTD trend charts
-
Previous year comparison
-
KPI information block with definition & formula
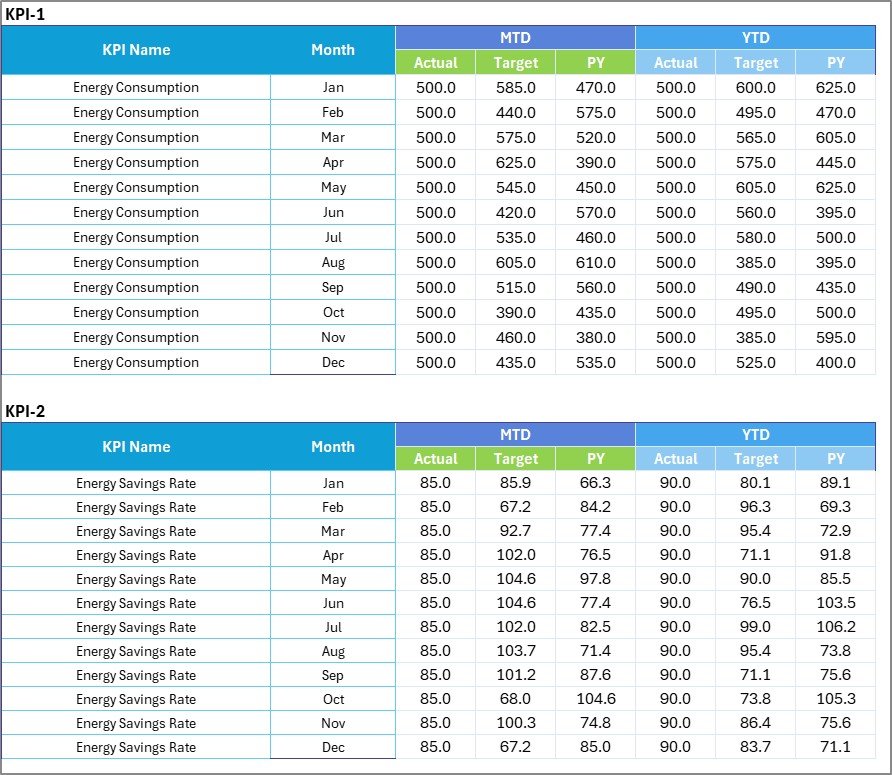
3️⃣ Input Data Sheet
Enter your data here—simple columns, fixed structure, and automatically linked formulas. Add:
-
Month
-
KPI values
-
Target values
-
Previous Year numbers
The moment you update this sheet, the dashboard refreshes with accurate visuals.
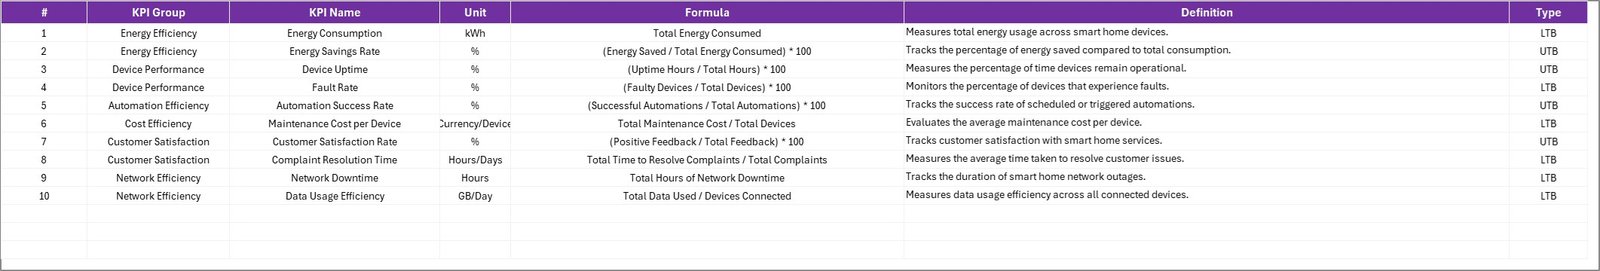
4️⃣ KPI Definition Sheet
Document all your KPIs in one place with:
-
KPI Name
-
Unit
-
KPI Group
-
Formula
-
Definition
This ensures clarity and consistency across teams.
🛠 How to Use the Smart Home Industry KPI Scorecard in Excel
Step 1: Update Input Data
Enter your monthly KPI values, targets, and previous year numbers. Do not change headers or formulas.
Step 2: Refresh All
Go to the Data tab → Click Refresh All.
Your dashboard updates instantly.
Step 3: Use the Scorecard Sheet
Select Month, MTD, or YTD from dropdowns to view performance.
Step 4: Analyze Trends
Open the KPI Trend Sheet → Select a KPI → View long-term performance patterns.
Step 5: Update KPI Definitions (Optional)
Add new KPIs anytime by updating the Definition Sheet and Input Data.
🎯 Who Can Benefit from This Smart Home Industry KPI Scorecard
👨💼 Smart Home Business Owners
Track installation efficiency, device performance, and customer satisfaction in one place.
🧑💻 IoT Product Teams
Measure energy efficiency, uptime %, automation success rates, and technical stability.
👩🔧 Installation & Service Teams
Monitor first-time fix rate, technician response time, service requests, and warranty claims.
📞 Customer Experience Teams
Track satisfaction scores, retention %, response time, and issue resolution speed.
🎯 Sales & Strategy Teams
Review sales performance, product usage trends, and revenue-impacting KPIs.
📊 Data Analysts & Reporting Teams
Use the ready-made dashboard to save hours of manual reporting every month.
Anyone involved in managing smart home operations, performance, or customer service can benefit from this scorecard.
### Click here to read the Detailed blog post
Visit our YouTube channel to learn step-by-step video tutorials


Reviews
There are no reviews yet.