Modern cities generate massive amounts of data from infrastructure projects, sustainability initiatives, digital governance systems, and urban development programs. However, managing dozens of smart city initiatives across departments, regions, and budgets becomes extremely challenging without a centralized monitoring system.
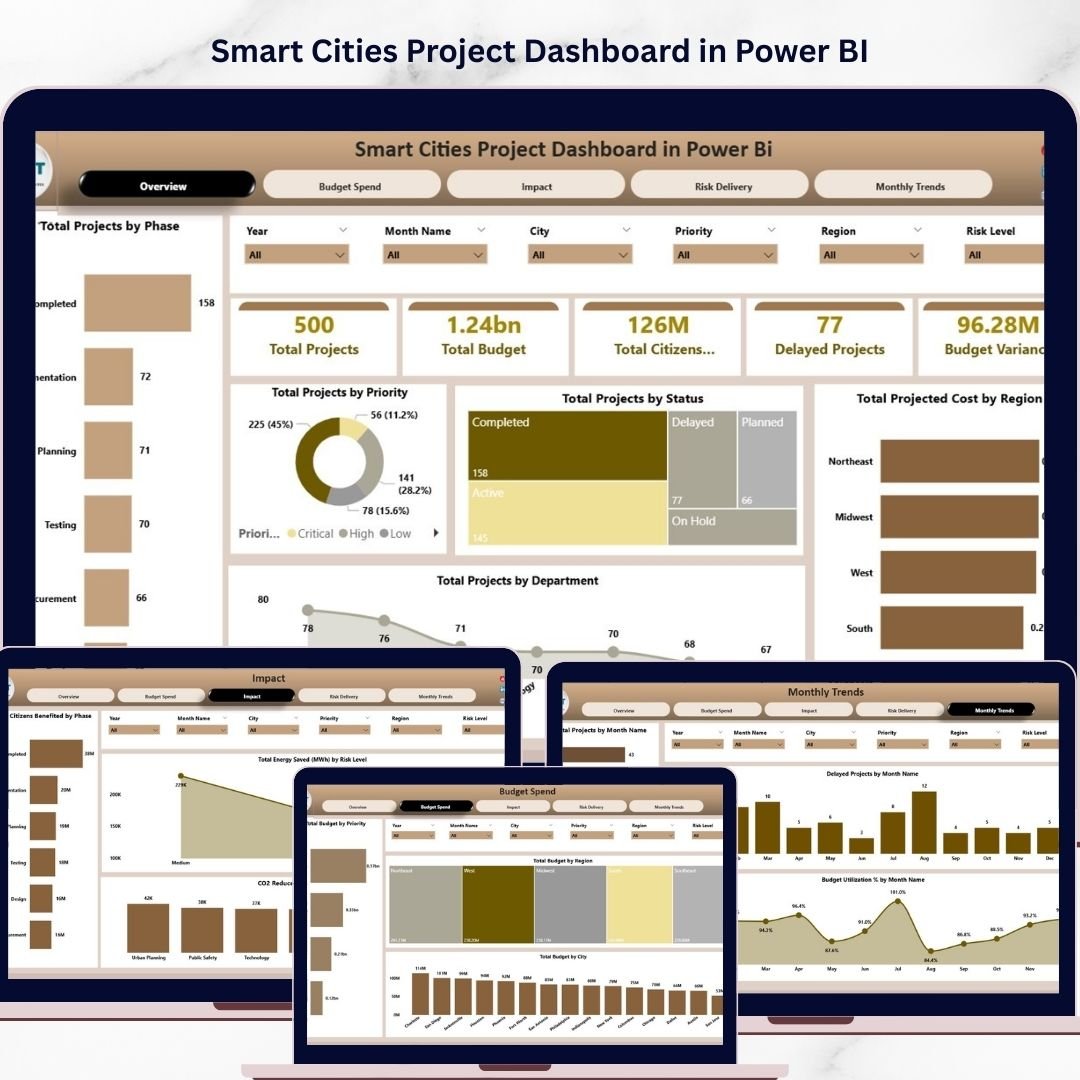
The Smart Cities Project Dashboard in Power BI is a powerful analytics solution designed to help governments, urban planners, and infrastructure organizations monitor project performance in one place. This ready-to-use Power BI dashboard transforms complex project data into interactive visual insights, enabling decision-makers to track budgets, monitor project progress, evaluate environmental impact, and measure citizen benefits.
With advanced visualizations, KPI indicators, and dynamic slicers, administrators can instantly analyze project performance, identify delays, and monitor sustainability outcomes.
If your organization manages multiple smart city initiatives, this dashboard becomes an essential decision-making tool for improving transparency, operational efficiency, and long-term urban development planning.
🚀 Key Features of Smart Cities Project Dashboard in Power BI
The dashboard contains five powerful analytics pages, each designed to analyze smart city projects from different operational perspectives.
📊 Interactive Overview Dashboard
The Overview Page provides a complete snapshot of smart city project performance.
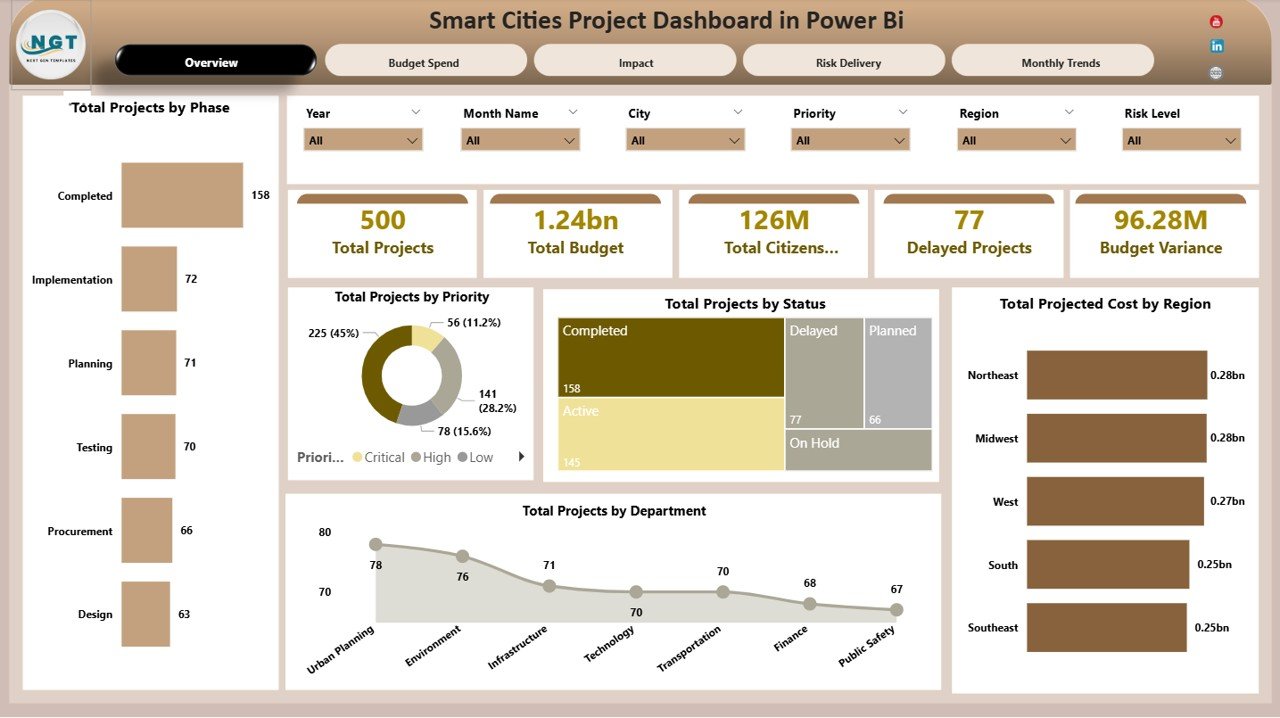
Key KPI Cards included:
📌 Total Projects – Displays the total number of smart city initiatives.
📌 Total Budget – Shows the overall allocated budget.
📌 Total Citizens Benefited – Measures the number of citizens impacted.
📌 Delayed Projects – Tracks projects that exceed planned timelines.
📌 Budget Variance – Highlights differences between planned and actual spending.
The page also includes powerful charts:
📈 Total Projects by Phase
📈 Total Projects by Priority
📈 Total Projects by Status
📈 Total Projected Cost by Region
📈 Total Projects by Department
These insights allow administrators to instantly evaluate the status and distribution of development projects.
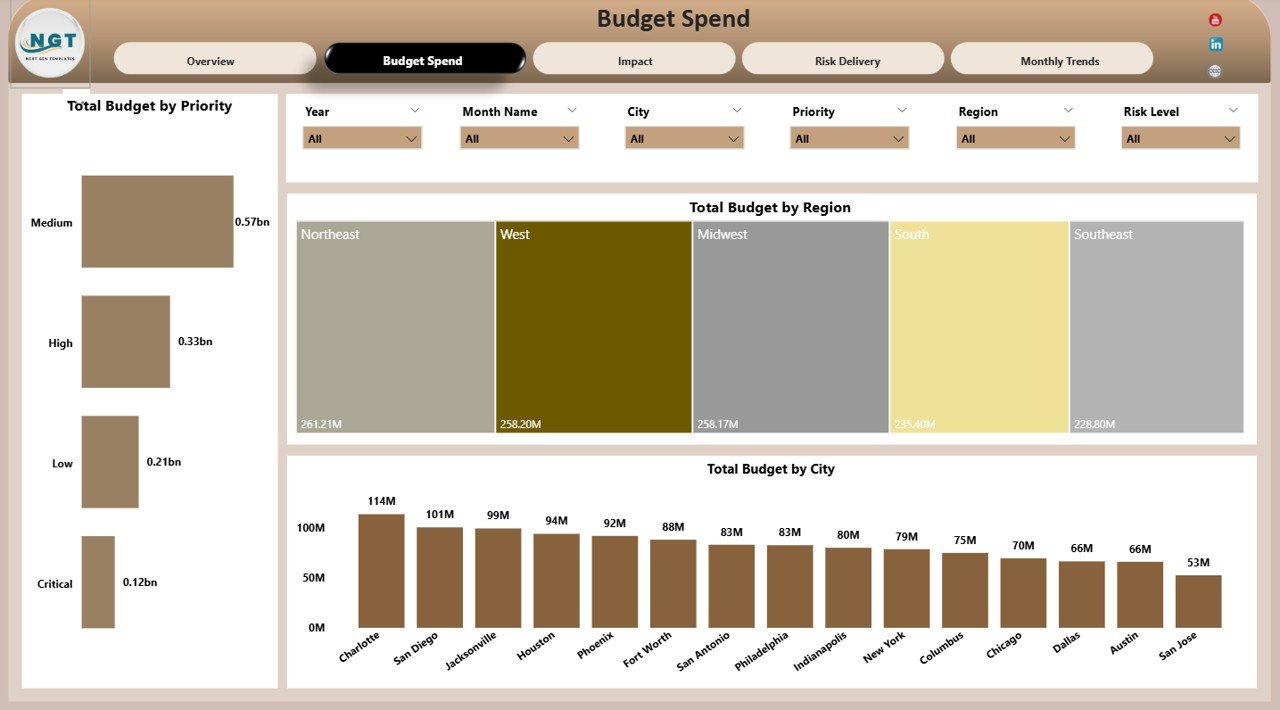
💰 Budget Spend Analysis Page
Financial transparency is critical in government initiatives. The Budget Spend Analysis page helps users analyze funding allocation and spending patterns.
Charts included:
💵 Total Budget by Priority – Understand how funding supports priority projects.
🌍 Total Budget by Region – Track regional budget allocation.
🏙 Total Budget by City – Compare spending across cities.
This page enables better financial planning and budget control.
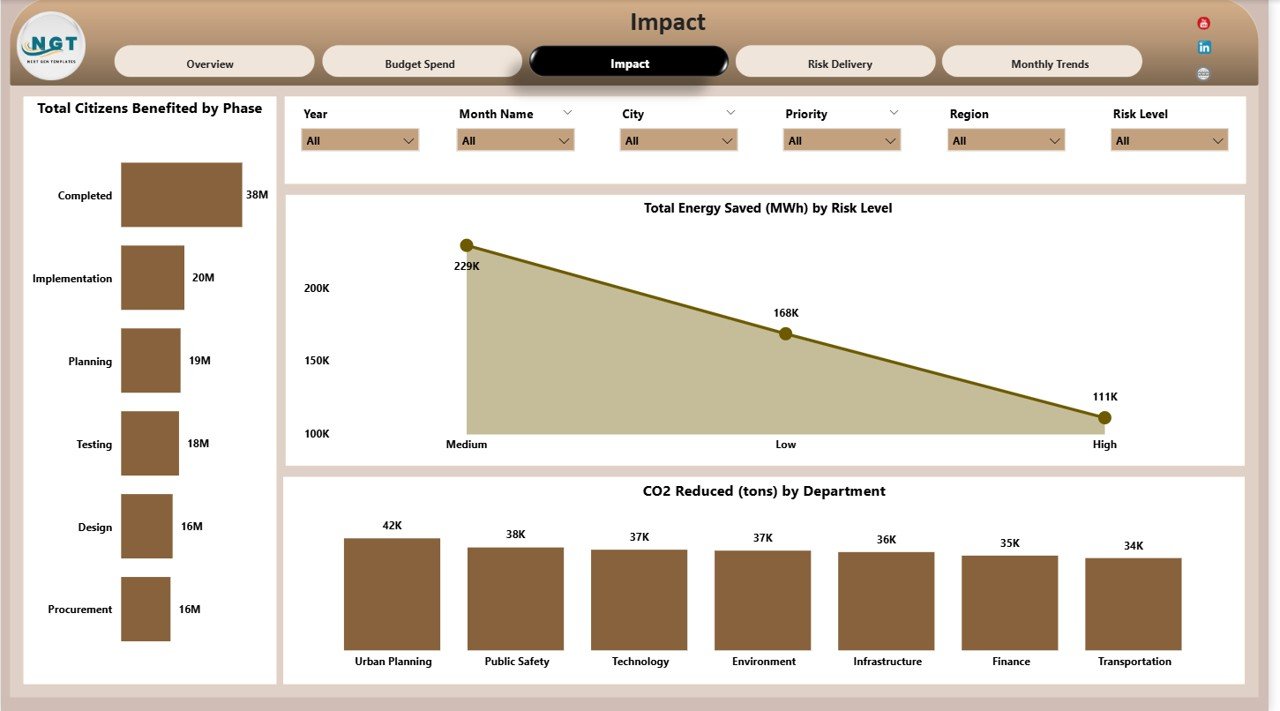
🌱 Impact Analysis Page
Smart city initiatives aim to improve citizen welfare and environmental sustainability.
This page evaluates the real-world impact of projects through charts such as:
👨👩👧 Total Citizens Benefited by Phase – Measures citizen impact across project stages.
⚡ Total Energy Saved (MWh) by Risk Level – Tracks sustainability improvements.
🌍 CO₂ Reduced (Tons) by Department – Monitors environmental impact.
These insights help governments measure the success of sustainability programs.
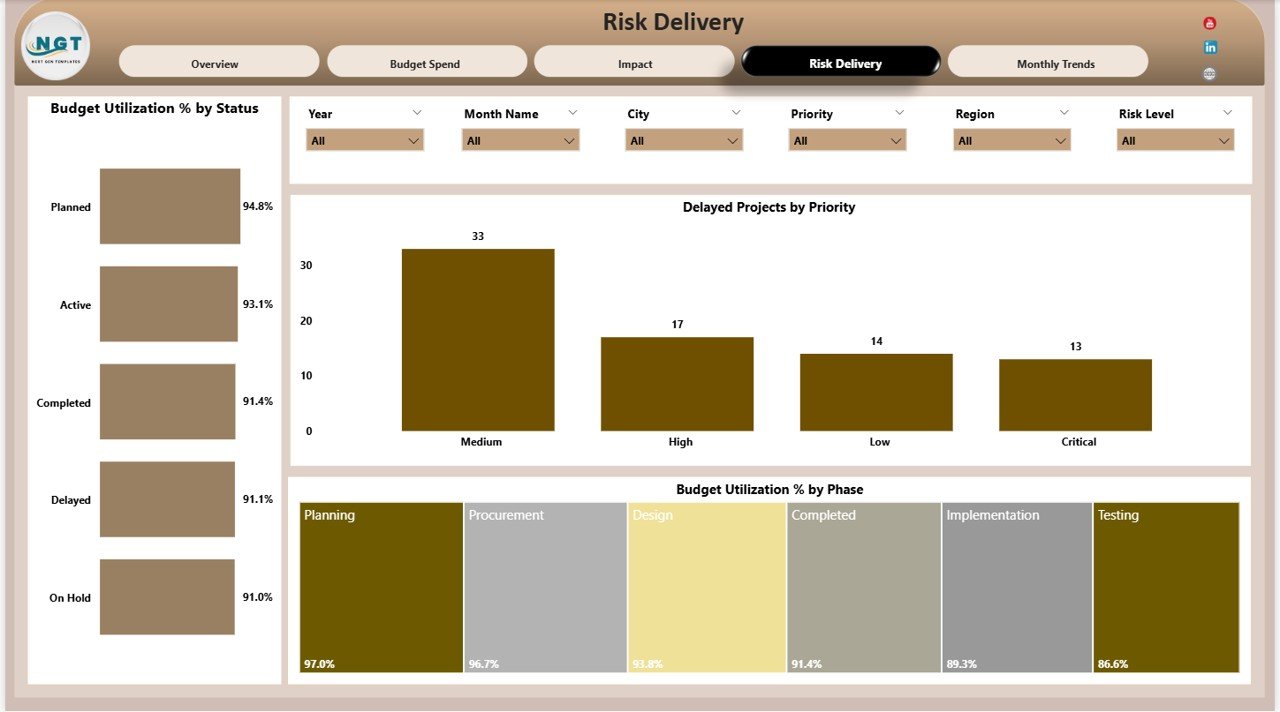
⚠️ Risk Delivery Analysis Page
Projects often face operational risks and delivery delays. The Risk Delivery Analysis page helps project managers identify risks early.
Charts included:
📉 Budget Utilization % by Status – Measures spending efficiency.
⏳ Delayed Projects by Priority – Identifies high-priority project delays.
📊 Budget Utilization % by Phase – Evaluates spending patterns during project stages.
These insights allow teams to take corrective actions before delays escalate.
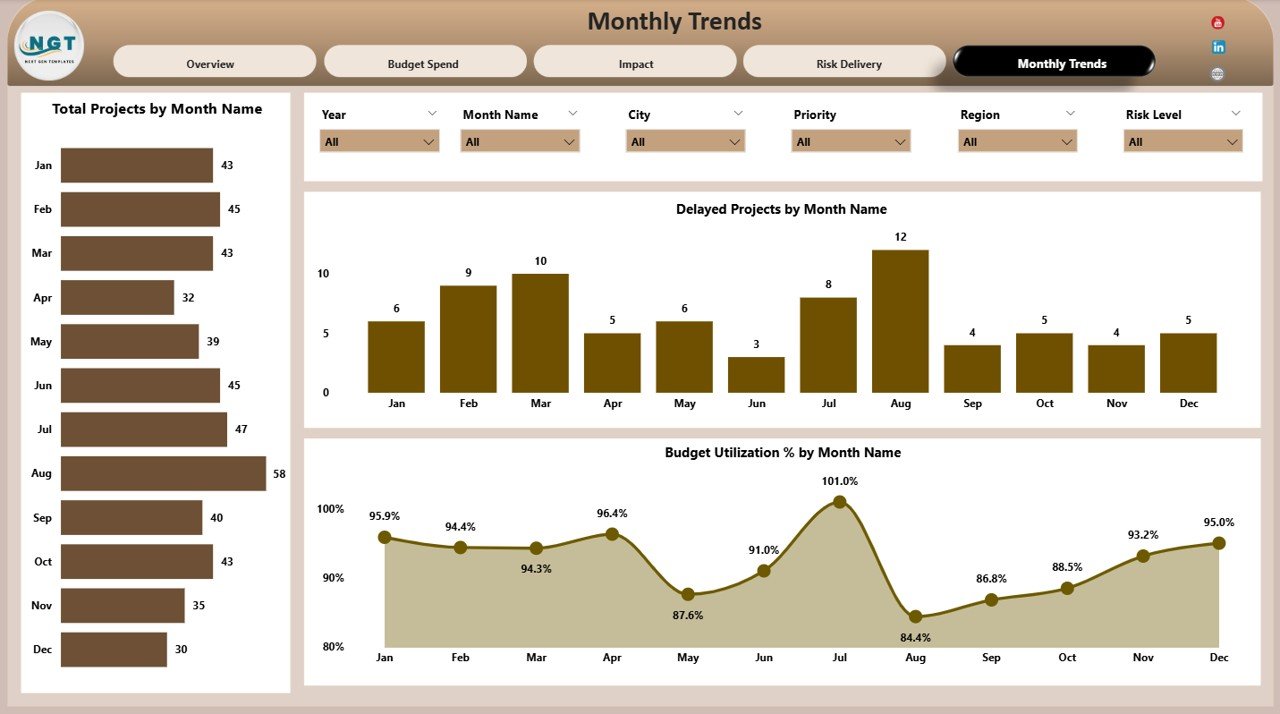
📅 Monthly Trends Page
Urban development evolves over time. The Monthly Trends page helps organizations monitor project progress throughout the year.
Charts include:
📆 Total Projects by Month – Tracks project execution trends.
📉 Delayed Projects by Month – Identifies periods with higher delays.
💰 Budget Utilization % by Month – Monitors monthly financial efficiency.
These insights help administrators optimize planning and resource allocation.
📦 What’s Inside the Smart Cities Project Dashboard in Power BI
This ready-to-use Power BI template includes everything needed to start monitoring smart city initiatives immediately.
📊 Fully Designed Power BI Dashboard File
📑 Five Interactive Dashboard Pages
📈 Multiple Charts and Data Visualizations
🎛 Dynamic Filters and Slicers for Data Analysis
📉 KPI Cards for Quick Performance Monitoring
📂 Structured Data Model for Project Tracking
⚡ Easy-to-Customize Layout
Simply connect your project data and begin analyzing performance instantly.
🛠 How to Use the Smart Cities Project Dashboard in Power BI
Using this dashboard is simple and requires only basic Power BI knowledge.
Step 1 – Import Your Data
Load your smart city project data into the Power BI model.
Step 2 – Refresh the Dashboard
Power BI automatically updates all visuals and KPI indicators.
Step 3 – Use Interactive Filters
Apply slicers to analyze projects by department, region, priority, or phase.
Step 4 – Monitor Performance
Use charts and KPIs to track budgets, sustainability impact, and project delays.
Step 5 – Make Data-Driven Decisions
Leverage insights to improve project planning and resource allocation.
Within minutes, decision-makers gain clear visibility into complex urban development programs.
👥 Who Can Benefit from This Smart Cities Project Dashboard
This dashboard supports a wide range of organizations involved in urban development.
🏛 Government Agencies managing smart city programs
🏙 Urban Development Authorities monitoring infrastructure projects
📊 City Administrators analyzing project performance
👷 Project Managers tracking delivery timelines
🌱 Sustainability Organizations monitoring environmental impact
🏗 Infrastructure Companies managing large development initiatives
📈 Consultants & Analysts evaluating urban planning data
Any organization working on smart infrastructure, sustainability programs, or urban development can benefit from this analytics solution.
Why This Dashboard is a Must-Have Tool
✅ Centralized project monitoring
✅ Real-time performance insights
✅ Improved budget transparency
✅ Early risk detection
✅ Better sustainability tracking
✅ Faster decision-making
If your city runs multiple development initiatives, this dashboard will transform the way you monitor and manage projects.
Click here to read the Detailed blog post
Visit our YouTube channel to learn step-by-step video tutorials
https://youtube.com/@PKAnExcelExpert


