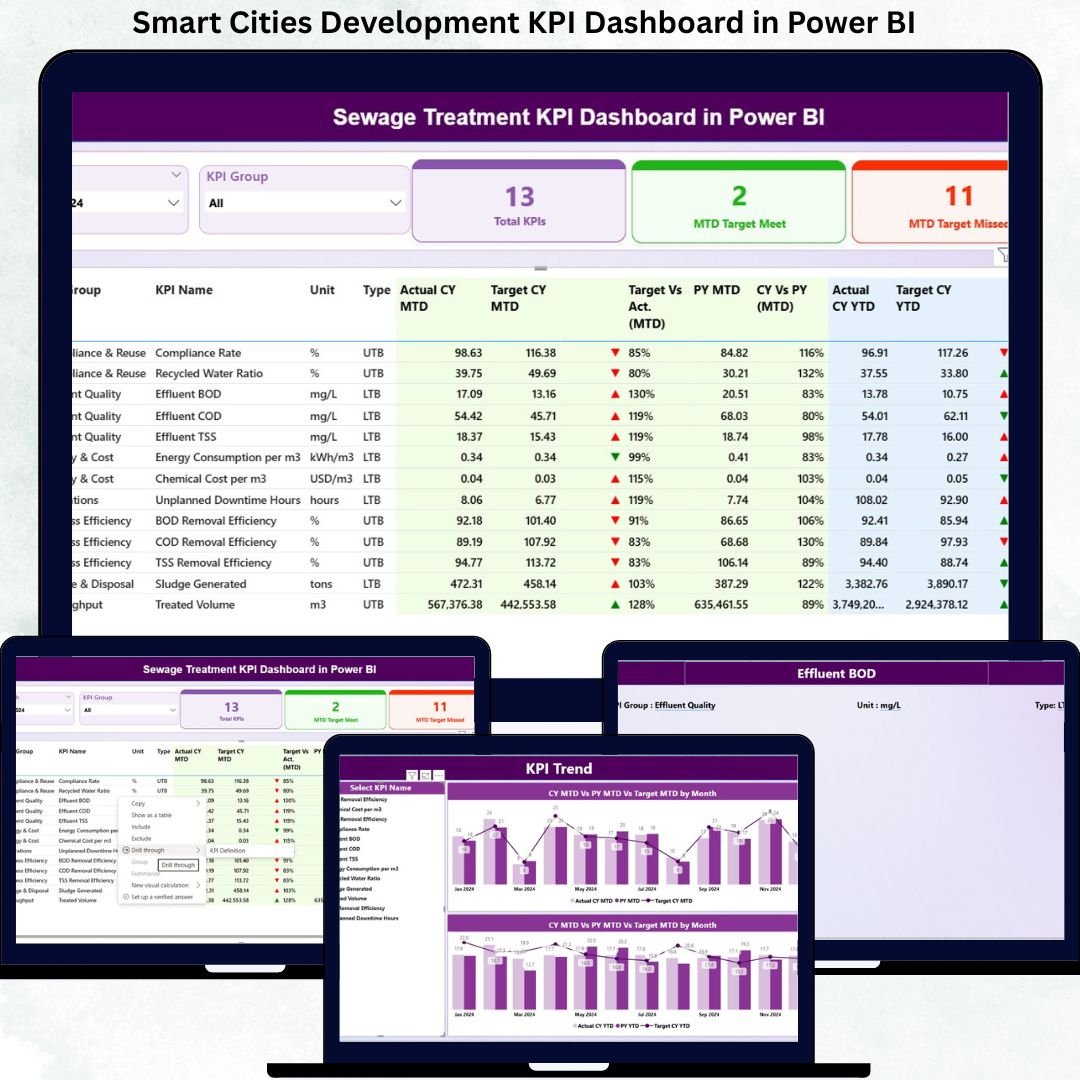
Smart cities demand clarity, accountability, and measurable progress. However, when urban development data remains scattered across Excel files, static reports, and disconnected systems, decision-makers lose visibility and control. That is exactly why the Smart Cities Development KPI Dashboard in Power BI is a must-have analytics solution for modern city governance.
This ready-to-use Power BI dashboard converts complex smart city performance data into a clean, interactive, and decision-ready system. Instead of spending time compiling reports, city planners and smart city mission teams can instantly track progress, identify gaps, and evaluate outcomes using structured KPIs. Designed for simplicity and impact, this dashboard helps cities move from reactive reporting to proactive governance.
Whether you are monitoring infrastructure development, digital services adoption, sustainability goals, or citizen outcomes, this dashboard provides real-time insights without technical complexity.
🔑 Key Features of Smart Cities Development KPI Dashboard in Power BI
📊 Centralized KPI Monitoring – Track all smart city KPIs in one structured Power BI report
📅 Month & KPI Group Slicers – Filter performance by time period and KPI category instantly
🎯 MTD & YTD Performance Tracking – Monitor short-term execution and long-term progress together
📈 Target vs Actual Analysis – Identify performance gaps clearly with calculated ratios
🔁 Previous Year Comparison – Measure growth or decline using CY vs PY metrics
🚦 Visual Performance Indicators – Green/red arrows highlight success and risk areas
📊 KPI Trend Analysis – Analyze historical patterns using dynamic combo charts
📘 Drill-Through KPI Definitions – Access formulas, units, and definitions instantly
⚙ Excel-Based Data Input – Simple data updates without complex databases
📈 Scalable Framework – Add or modify KPIs without redesigning the dashboard
📦 What’s Inside the Smart Cities Development KPI Dashboard
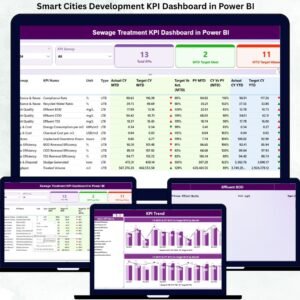
This Power BI product includes a three-page structured dashboard, each designed for a specific level of analysis:
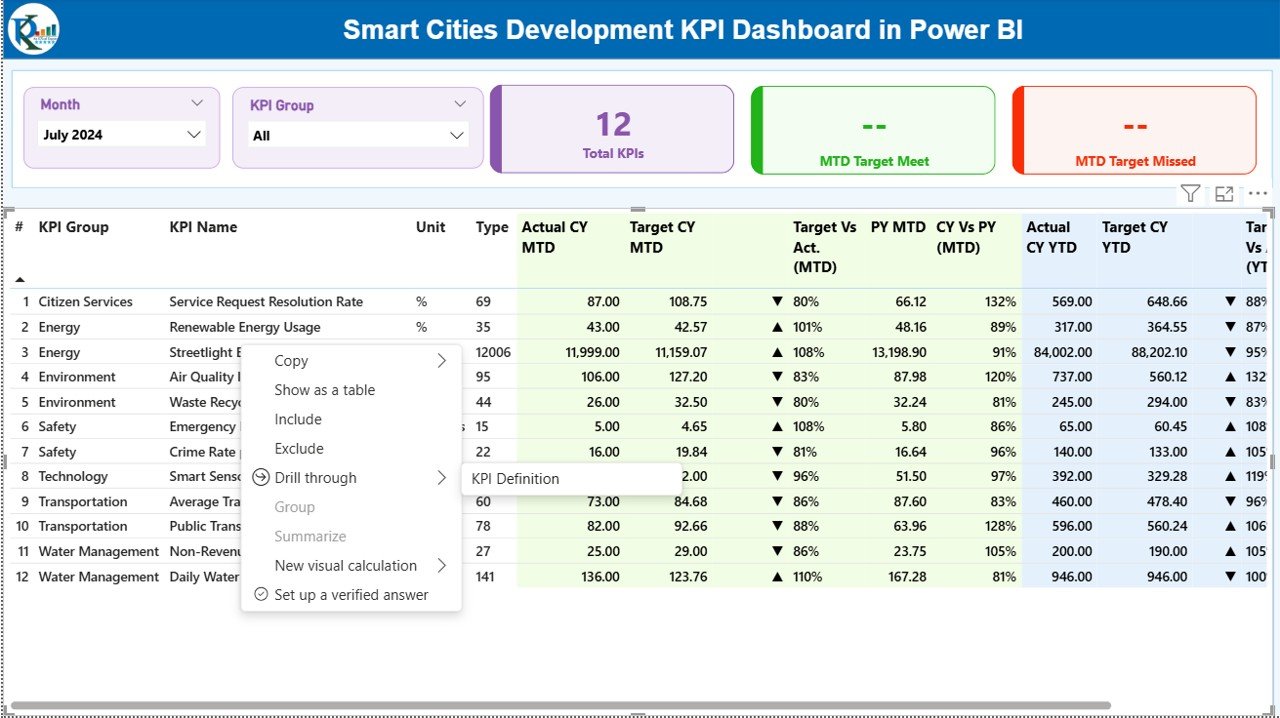
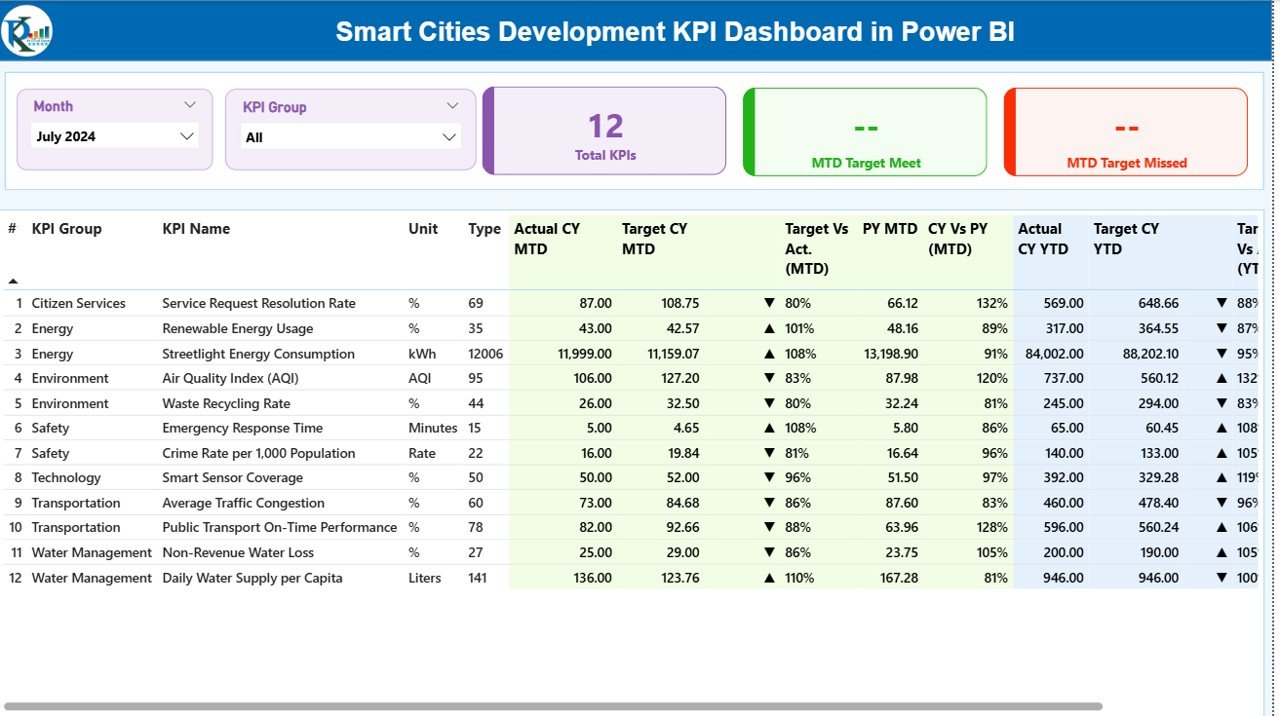
📍 Summary Page
-
Month and KPI Group slicers
-
KPI cards showing Total KPIs, MTD Target Met, and MTD Target Missed
-
Detailed KPI table with MTD & YTD metrics, targets, icons, and year-over-year comparisons
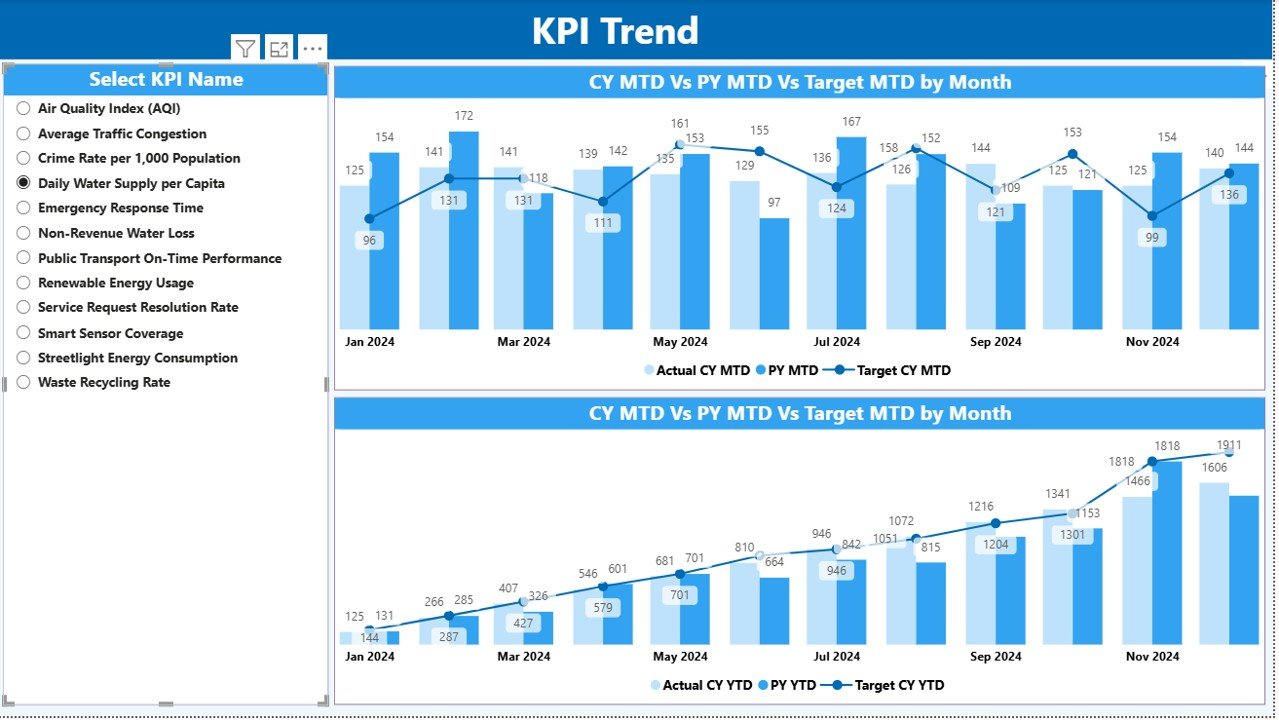
📈 KPI Trend Page
-
Interactive combo charts
-
Current Year, Previous Year, and Target trends
-
KPI selector to analyze individual indicators
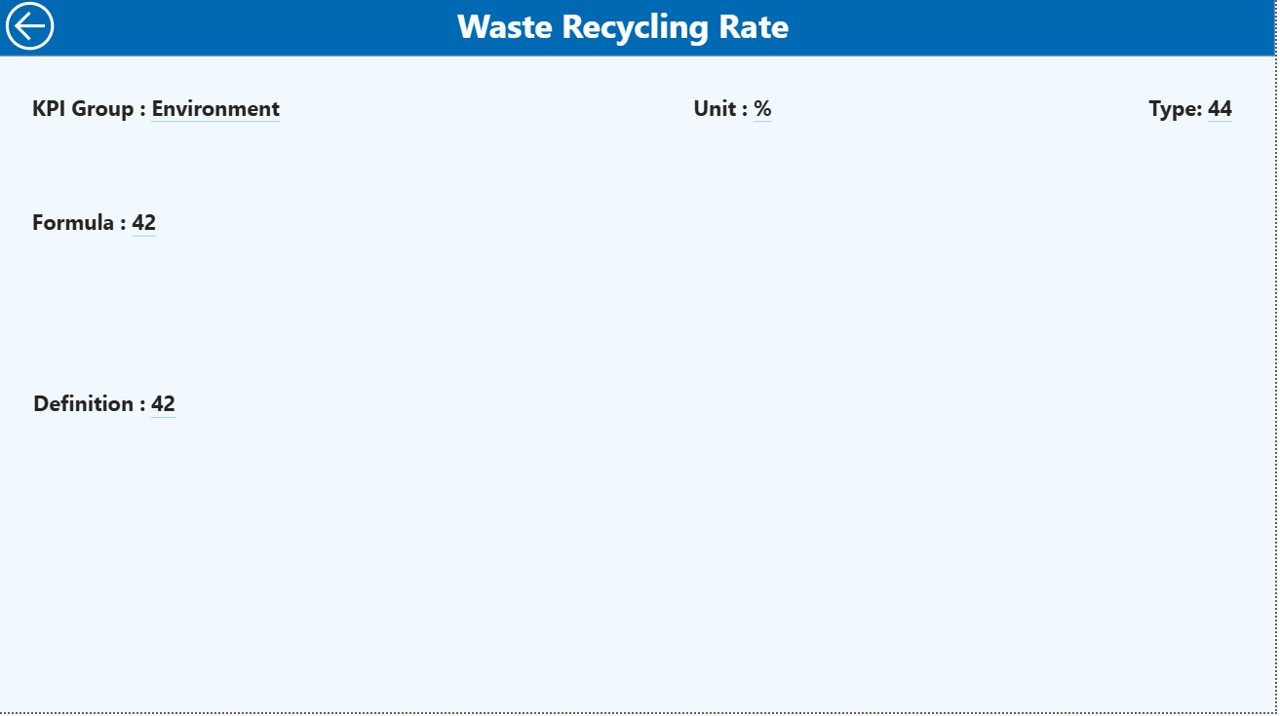
📘 KPI Definition Page (Drill-Through)
-
KPI formula and definition
-
Unit of measurement
-
KPI type (LTB or UTB)
-
Back button for smooth navigation
📂 Excel Data Source (Included Structure)
-
Input_Actual sheet
-
Input_Target sheet
-
KPI Definition master sheet
🚀 How to Use the Smart Cities Development KPI Dashboard
📝 Step 1: Enter actual performance values in the Excel Input_Actual sheet
🎯 Step 2: Add target values in the Input_Target sheet
📘 Step 3: Define KPIs, units, formulas, and types in the KPI Definition sheet
🔄 Step 4: Refresh the Power BI file
📊 Step 5: Use slicers, tables, and charts to analyze performance instantly
No advanced Power BI skills are required. The dashboard is intuitive, user-friendly, and decision-focused.
🎯 Who Can Benefit from This Smart Cities Development KPI Dashboard
🏙 Urban Planners & City Development Authorities
🏛 Municipal Corporations & Local Governments
📊 Smart City Mission & PMO Teams
🚧 Infrastructure & Utilities Project Managers
📈 Policy Analysts & Government Consultants
🌱 Sustainability & Governance Teams
If your organization manages multi-department smart city initiatives, this dashboard is built for you.
Click here to read the Detailed Blog Post
Watch the step-by-step video tutorial:


Reviews
There are no reviews yet.