


Skill development missions are the backbone of workforce transformation. Governments, training institutions, and development agencies invest heavily in skilling initiatives to improve employability, productivity, and economic growth. However, without structured performance tracking, even the best-designed programs struggle with delays, inefficiencies, and unclear outcomes.
That is exactly where the Skill Development Missions KPI Dashboard in Excel delivers exceptional value.
This ready-to-use Excel dashboard transforms scattered training data into a centralized, visual, and decision-ready performance system. Instead of relying on multiple spreadsheets, manual reports, or delayed reviews, this dashboard provides instant clarity on mission progress, targets, and outcomes—all in one Excel file.
Whether you manage a national skill mission, a regional training program, or an institutional skilling initiative, this dashboard helps you track performance confidently and act faster.
🚀 Key Features of Skill Development Missions KPI Dashboard in Excel
✅ Dynamic month-wise performance tracking using a simple drop-down
✅ Automatic MTD and YTD calculations for all KPIs
✅ Target vs Actual and Previous Year vs Actual comparisons
✅ Conditional formatting arrows for instant performance direction
✅ KPI-wise trend analysis with interactive charts
✅ Clearly structured KPI Definition framework
✅ Fully Excel-based—no Power BI or external tools required
✅ Easy customization for different missions, regions, or programs
With these features, leadership teams move from reactive reporting to proactive mission management.

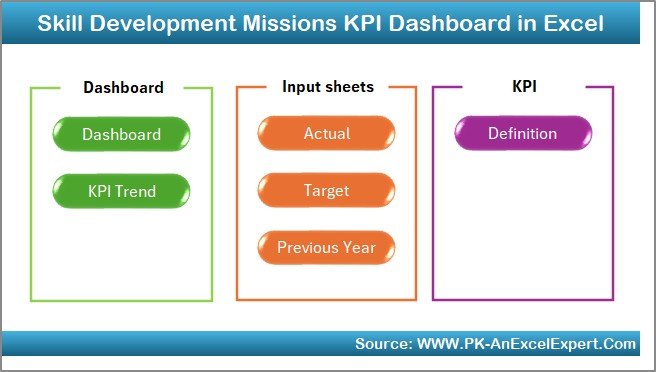
📦 What’s Inside the Skill Development Missions KPI Dashboard in Excel
This dashboard includes a well-structured, business-ready Excel file with multiple purpose-driven worksheets:
📊 Summary Page (Index Sheet)
A clean navigation hub with one-click buttons to access all dashboard sections.
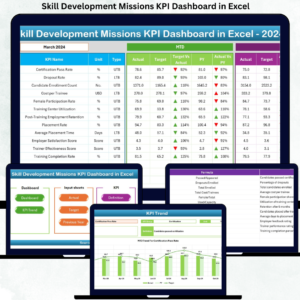
📈 Dashboard Sheet
The main reporting page displaying MTD and YTD Actual, Target, and Previous Year values, along with variance analysis and performance indicators.
📉 KPI Trend Sheet
Detailed KPI-level trend analysis with selectable KPIs, units, formulas, KPI types (UTB/LTB), and visual trend charts.
🧮 Actual Numbers Input Sheet
A structured data entry sheet for actual performance values with month control.
🎯 Target Sheet
Defines monthly and yearly targets aligned with mission objectives.
📅 Previous Year Sheet
Supports year-over-year performance comparison and long-term benchmarking.
📘 KPI Definition Sheet
Ensures consistency with clear KPI names, groups, units, formulas, and definitions.
🛠️ How to Use the Skill Development Missions KPI Dashboard in Excel
Using this dashboard is simple and intuitive:
1️⃣ Enter Actual performance values in the Actual Numbers sheet
2️⃣ Define monthly and YTD targets in the Target sheet
3️⃣ Add historical data in the Previous Year sheet
4️⃣ Select the reporting month from the dashboard drop-down
5️⃣ Instantly review MTD and YTD performance across all KPIs
6️⃣ Use trend charts to identify patterns and forecast outcomes
No advanced Excel skills are required. Basic Excel knowledge is enough to operate and maintain the dashboard confidently.
🎯 Who Can Benefit from This Skill Development Missions KPI Dashboard
This dashboard is ideal for:
🏛️ Government skill development departments
🏫 Training institutions and academies
🌍 NGOs and development agencies
📍 Regional and state-level mission offices
📊 Program managers and policy teams
📈 Monitoring & evaluation professionals
Anyone responsible for tracking training performance, placements, certifications, and outcomes will benefit immediately.
Click here to read the Detailed blog post
Watch the step-by-step video tutorial:
Visit our YouTube channel to learn step-by-step video tutorials


Reviews
There are no reviews yet.