In the fast-paced world of logistics and transportation, every shipment counts. From delivery times and freight costs to carrier utilization and customer satisfaction — each metric impacts profitability and service quality. Managing all of this manually can be complex and time-consuming.
That’s where the Shipping KPI Dashboard in Power BI becomes a true game-changer. 💡
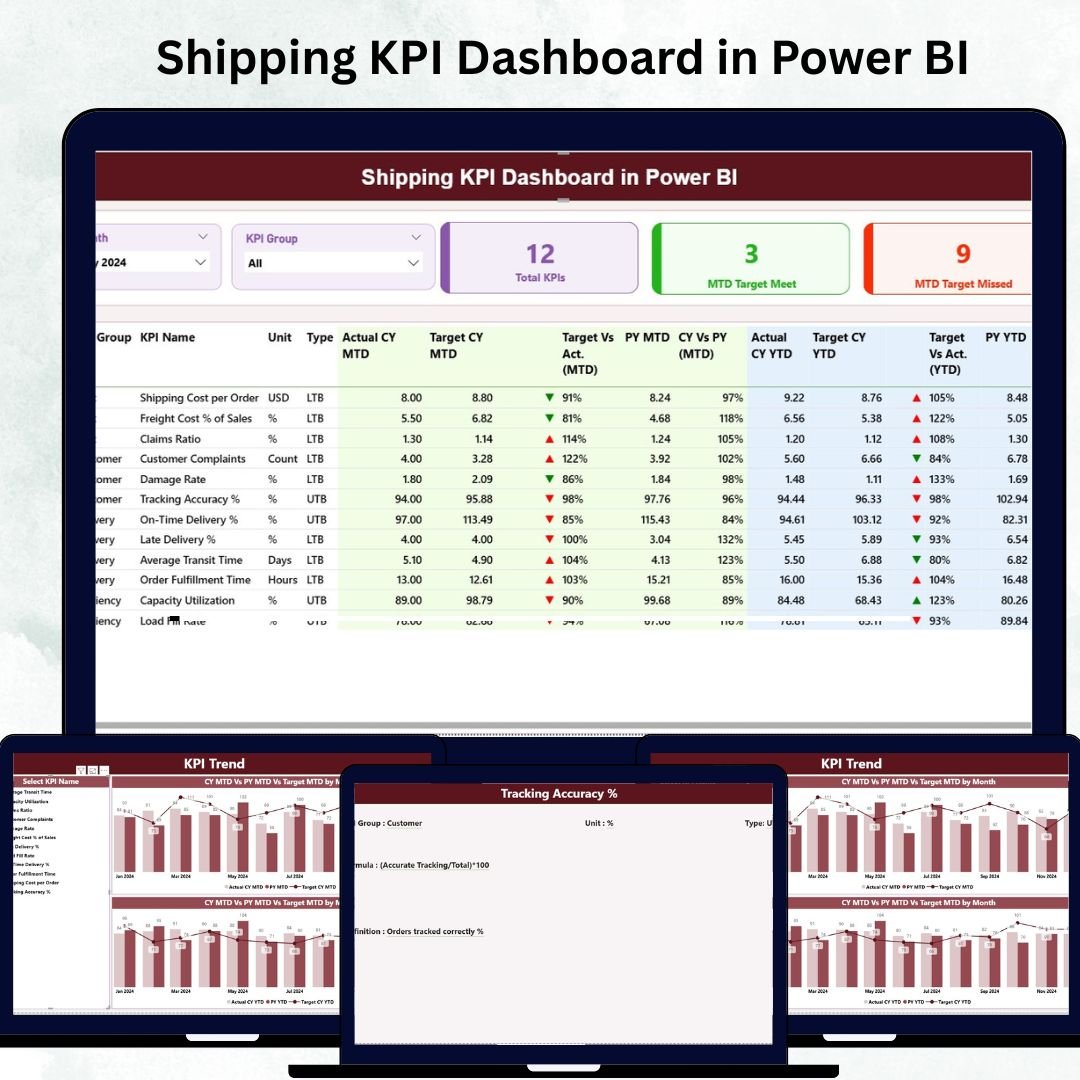
This interactive, ready-to-use Power BI solution helps logistics professionals, operations managers, and supply chain leaders track, analyze, and visualize key shipping performance metrics in real time. By connecting Excel data with Power BI’s advanced visuals, it transforms raw numbers into insights that improve efficiency, cut costs, and boost customer satisfaction.
⚙️ Key Features of the Shipping KPI Dashboard in Power BI
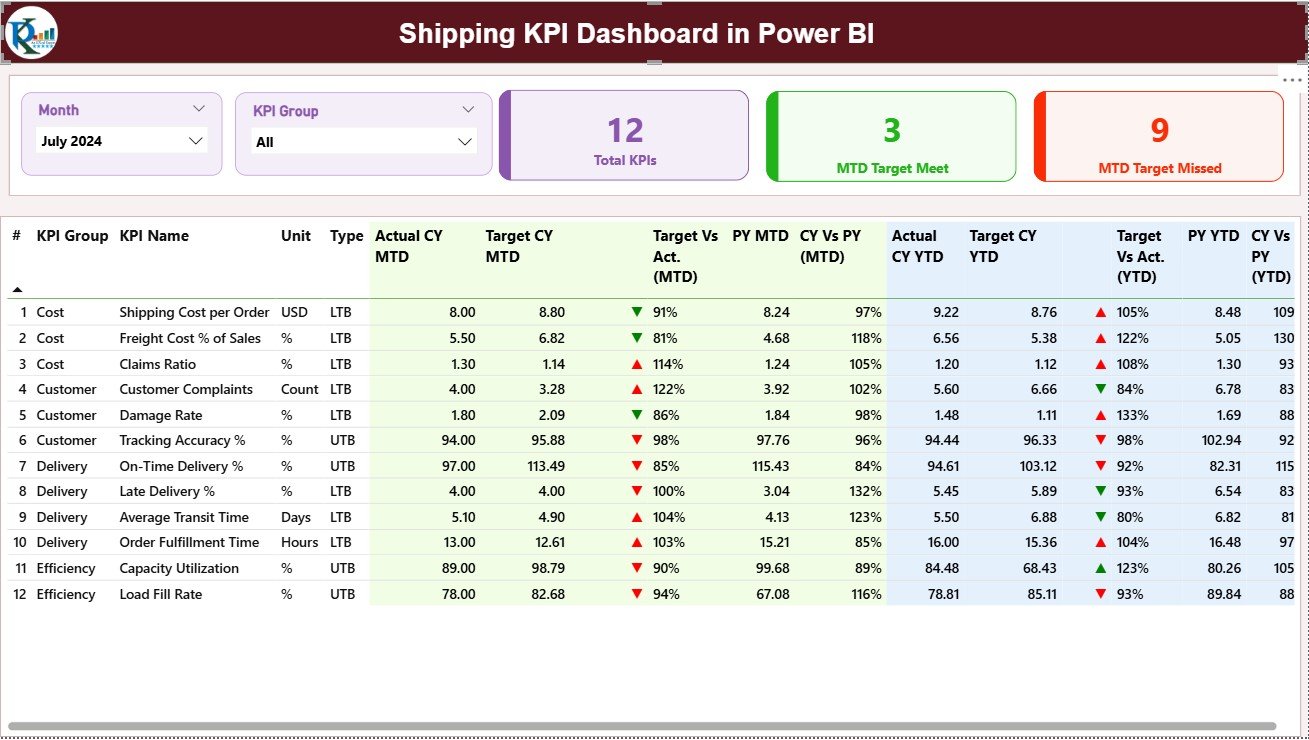
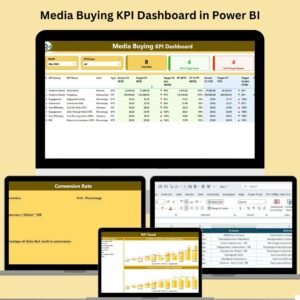
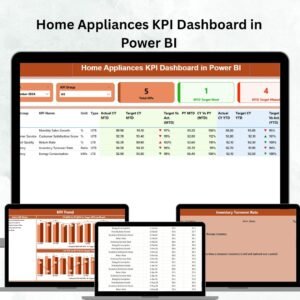
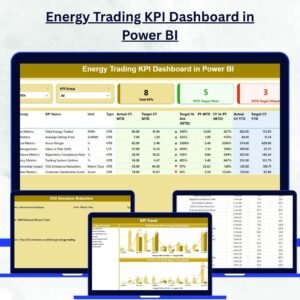
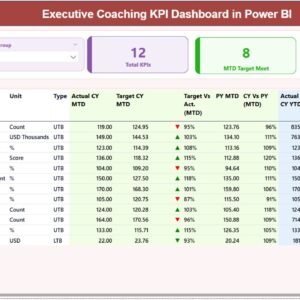
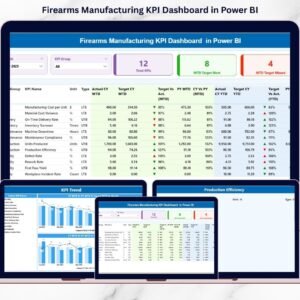
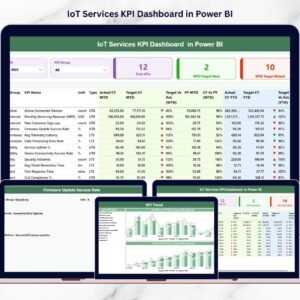
📊 Comprehensive Performance Summary – View total KPIs, targets met and missed goals in a single glance through dynamic KPI cards.
📆 Month & KPI Group Slicers – Filter performance metrics easily by month or category for faster analysis.
📈 Actual vs Target Comparison – Track both MTD (Month-to-Date) and YTD (Year-to-Date) performance side by side.
📉 Previous Year Benchmarking – Compare current performance against the same period last year for better trend visibility.
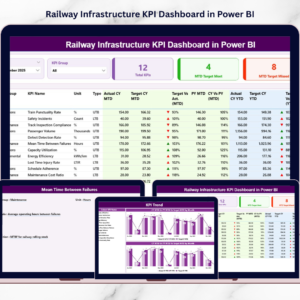
🔍 Detailed KPI Table – Evaluate KPI Number, Group, Unit, Type, Actual, Target, and Achievement % — all color-coded with green/red indicators.
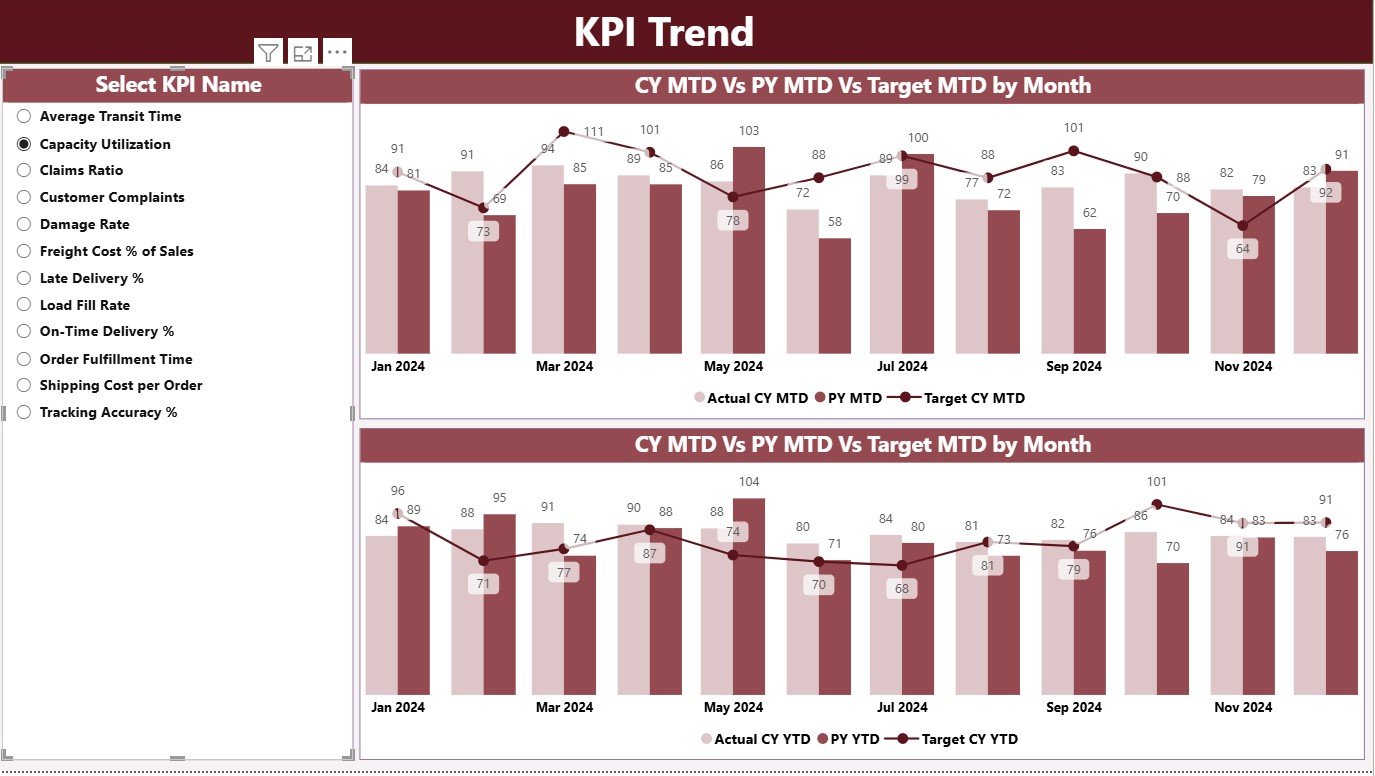
📊 KPI Trend Page – Combo charts display MTD and YTD performance trends for selected KPIs across Current Year, Target, and Previous Year.
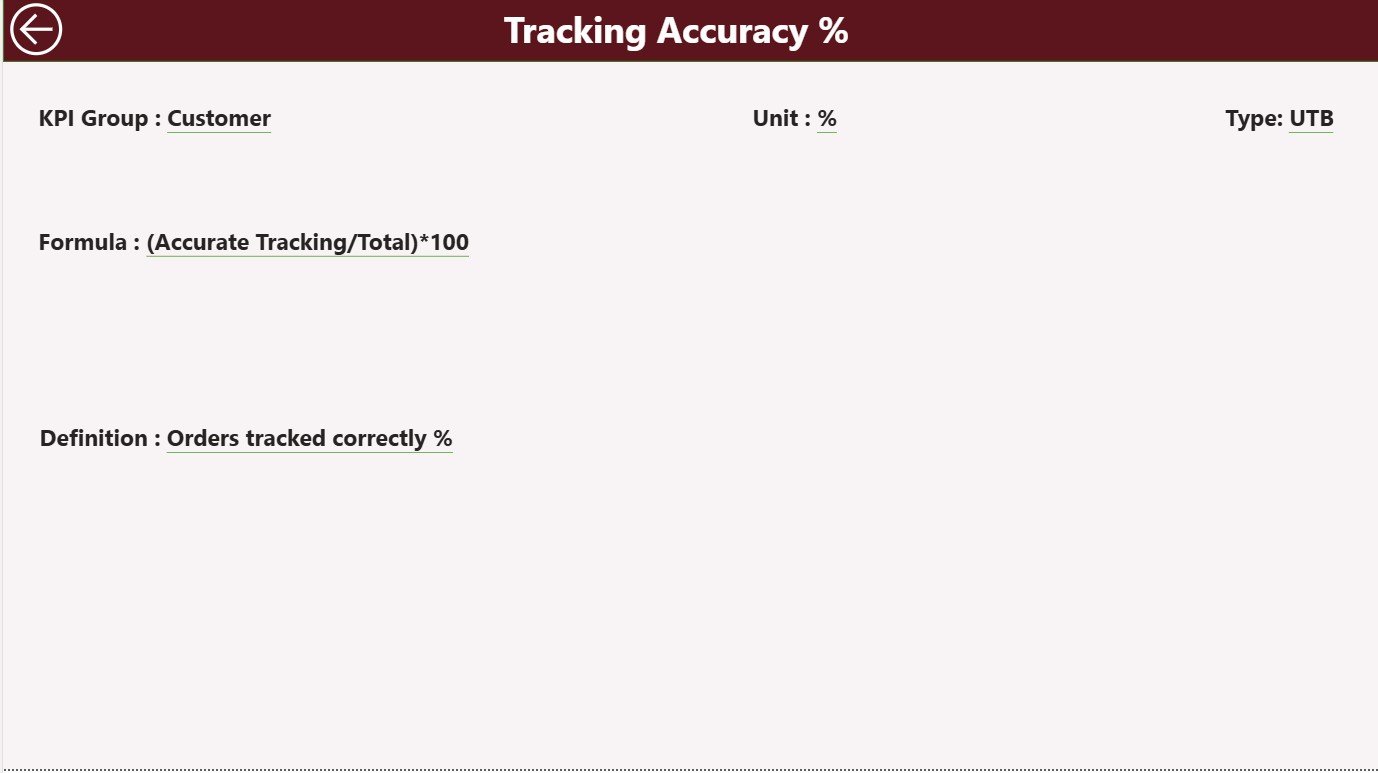
📘 KPI Definition Page – Drill through to detailed KPI information including Formula, Definition, Unit, and Type (LTB or UTB).
💾 Excel Integration – Update the connected Excel file (Actual, Target, and Definition sheets) to refresh Power BI visuals instantly.
🚀 No Coding Required – User-friendly, drag-and-drop interface — perfect for both beginners and professionals.
📂 What’s Inside the Shipping KPI Dashboard in Power BI
📍 1. Summary Page:
Your command center for performance analysis. Displays KPI cards, slicers, and detailed tables comparing Actual vs Target, MTD vs YTD, and Current vs Previous Year.
📊 2. KPI Trend Page:
Dive deeper into KPI behavior with two combo charts — one for MTD and one for YTD — showing Actuals, Targets, and Previous Year data to reveal trends and anomalies.
📘 3. KPI Definition Page:
A drill-through view showing KPI formula, unit, and detailed definition, ensuring everyone interprets performance consistently.
💾 Excel Data Source:
Easily manage data through three structured sheets:
-
Input_Actual – Actual monthly performance data.
-
Input_Target – Target values for the same periods.
-
KPI_Definition – Documentation for each KPI, including formula and type.
This simple, integrated structure ensures your dashboard remains accurate, consistent, and easy to maintain.
🧭 How to Use the Shipping KPI Dashboard in Power BI
1️⃣ Open the Power BI File: Load the dashboard in Power BI Desktop or Service.
2️⃣ Update Excel Data: Modify Actual, Target, and Definition sheets with new figures.
3️⃣ Refresh Power BI: Click “Refresh” to update all visuals instantly.
4️⃣ Filter & Explore: Use Month and KPI Group slicers for targeted analysis.
5️⃣ Drill Through: Right-click any KPI to access its detailed formula and definition.
6️⃣ Review Trends: Visit the KPI Trend page to see long-term performance evolution.
7️⃣ Share with Teams: Publish the report in Power BI Service for secure, real-time collaboration.
💡 Tip: Automate data refresh schedules in Power BI to ensure your metrics are always up to date.
👥 Who Can Benefit from This Dashboard
🚛 Logistics & Shipping Managers: Monitor delivery times, freight costs, and carrier efficiency.
🏭 Operations Heads: Identify performance bottlenecks and optimize resource use.
📦 Supply Chain Analysts: Evaluate shipment trends, cost per mile, and fulfillment accuracy.
💼 E-commerce Companies: Ensure on-time deliveries and improved customer satisfaction.
📊 Fleet Management Teams: Track utilization, fuel efficiency, and delivery reliability.
Whether you’re managing regional routes or global freight operations, this dashboard offers the transparency and agility needed for better business control.


Reviews
There are no reviews yet.