Managing freight costs, carrier performance, and shipping timelines manually can be a logistical nightmare. The Shipping Dashboard in Excel is your all-in-one analytical solution — built to turn complex shipping data into interactive visuals and performance insights.
Designed for logistics teams, operations managers, and business owners, this ready-to-use Excel dashboard helps you track costs, monitor transit efficiency, and analyze profitability across regions, departments, and shipping modes — all from one central file.
With dynamic slicers, page navigation, and automated charts, it transforms ordinary data into actionable insights that drive smarter decisions and improve your bottom line.
⚙️ Key Features of the Shipping Dashboard in Excel
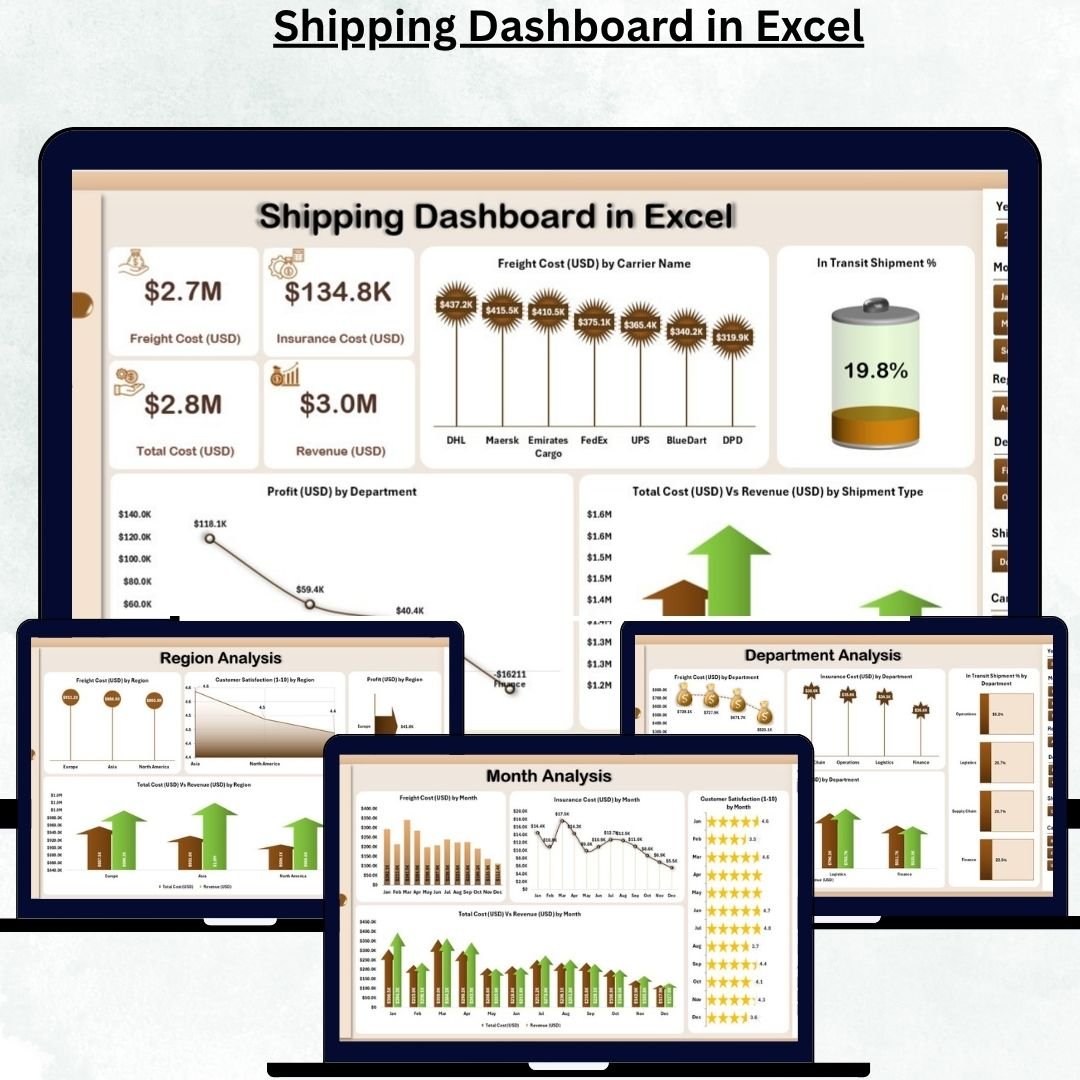
🏠 1️⃣ Overview Page – Central Control Panel
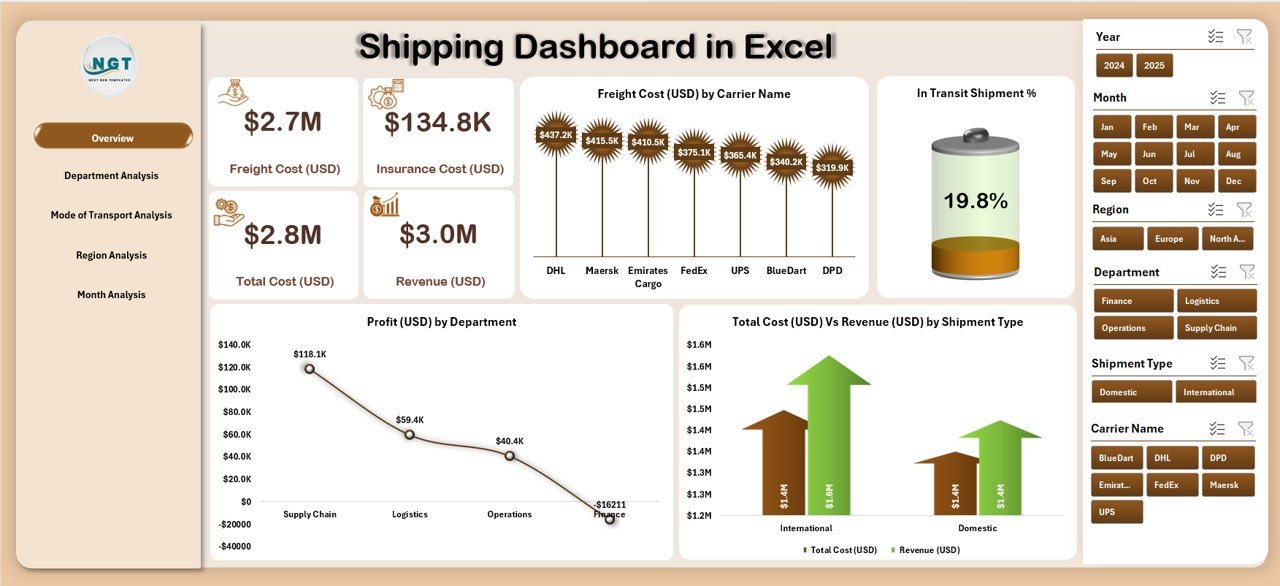
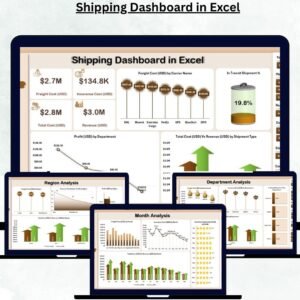
Get an at-a-glance summary of your shipping KPIs.
-
🎚️ Right-Side Slicer to filter data by Department, Region, or Shipping Mode.
-
💳 Five KPI Cards: Freight Cost (USD), Total Shipments, Profit (USD), Shipment in Transit %, and Total Cost vs Revenue.
-
📊 Four Interactive Charts:
-
Freight Cost (USD) by Carrier Name
-
In Transit Shipment %
-
Profit (USD) by Department
-
Total Cost (USD) vs Revenue (USD) by Shipment Type
-
Perfect for high-level management reviews and monthly business meetings.
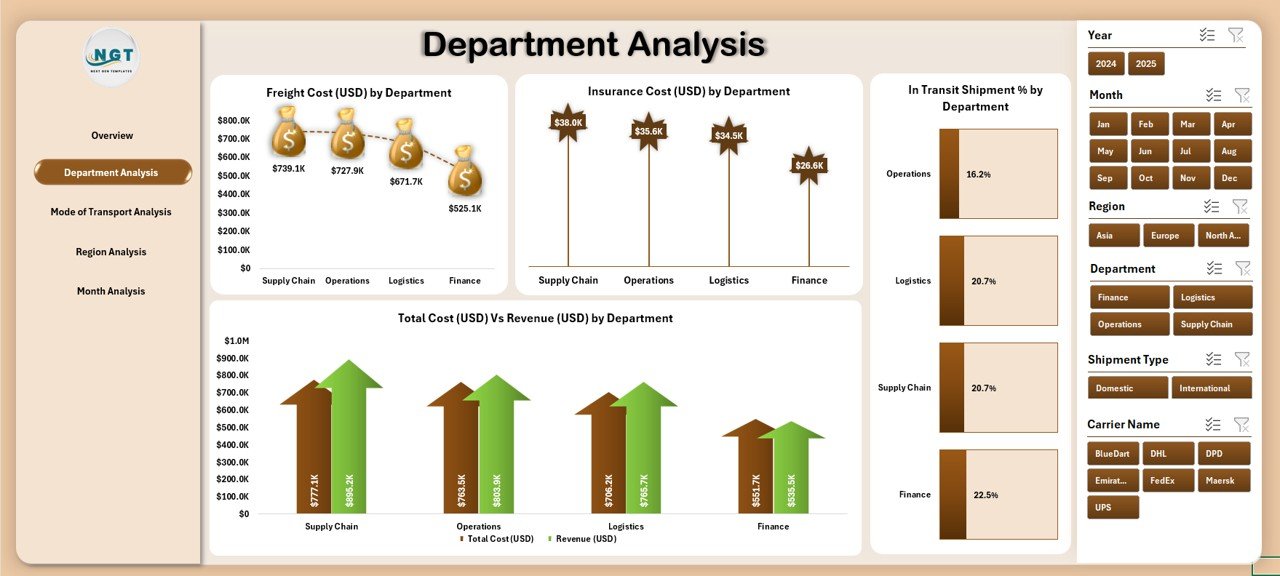
🏢 2️⃣ Department Analysis – Measure Cost & Efficiency
Drill down into departmental performance to control costs and maximize profit.
-
📈 Freight Cost (USD) by Department
-
💰 Insurance Cost (USD) by Department
-
🚚 In Transit Shipment % by Department
-
💹 Total Cost (USD) vs Revenue (USD) by Department
💡 Helps finance and operations teams pinpoint high-cost departments and improve efficiency.
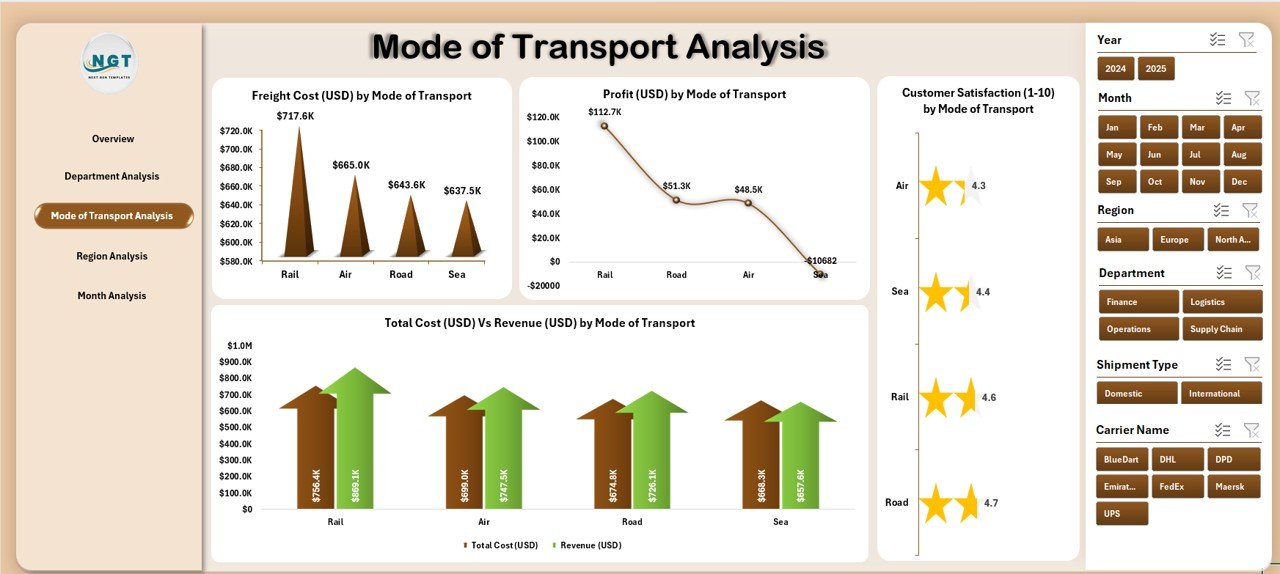
✈️ 3️⃣ Mode of Transport Analysis – Find the Most Cost-Effective Route
Compare Air, Sea, Road, and Rail shipments to determine the best mix of cost and performance.
-
📦 Freight Cost (USD) by Mode of Transport
-
💵 Profit (USD) by Mode of Transport
-
😊 Customer Satisfaction (1–10) by Mode of Transport
-
⚖️ Total Cost (USD) vs Revenue (USD) by Mode of Transport
🚀 Identify which mode offers the best cost-to-speed balance for your business.
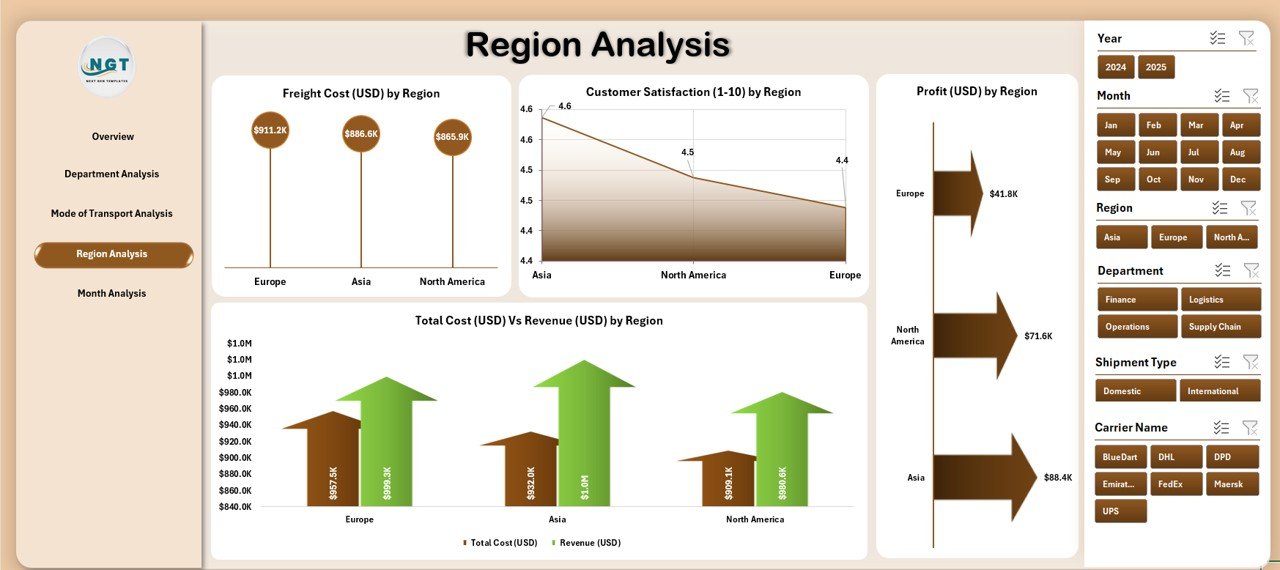
🌍 4️⃣ Region Analysis – Monitor Global Performance
Analyze how different regions contribute to cost, profit, and satisfaction.
-
Freight Cost (USD) by Region
-
Profit (USD) by Region
-
Customer Satisfaction (1–10) by Region
-
Total Cost (USD) vs Revenue (USD) by Region
📊 Optimize your shipping routes and focus resources where performance is highest.
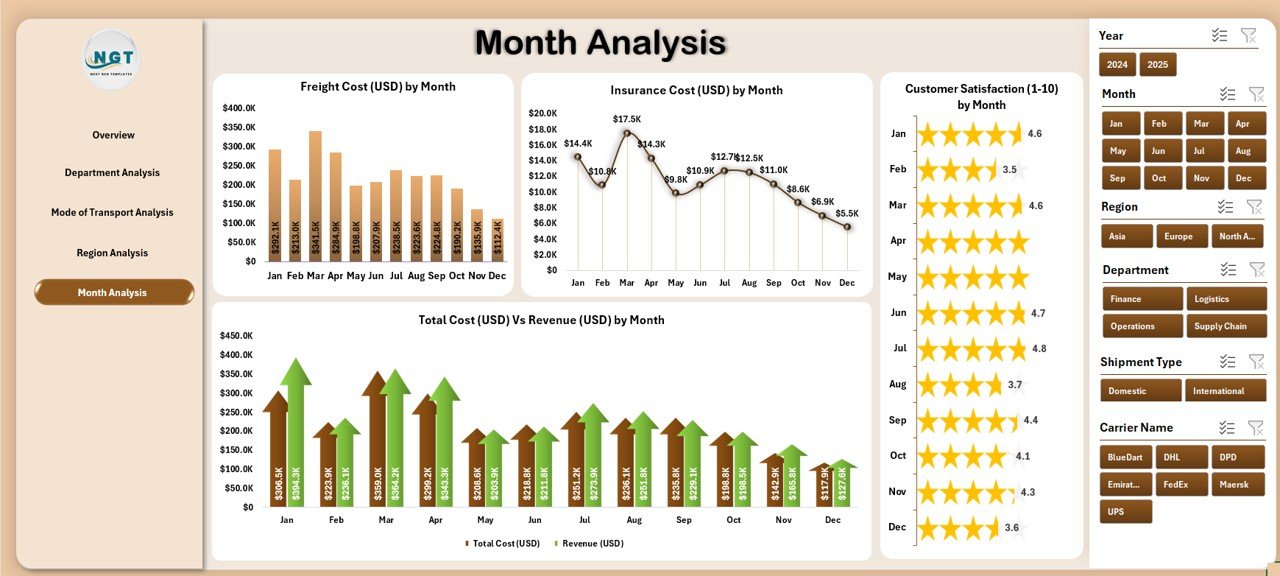
📅 5️⃣ Month Analysis – Understand Trends and Seasonality
Track monthly shipping metrics to plan budgets and logistics strategies.
-
Freight Cost (USD) by Month
-
Insurance Cost (USD) by Month
-
Customer Satisfaction (1–10) by Month
-
Total Cost (USD) vs Revenue (USD) by Month
📆 Spot seasonal cost spikes, demand peaks, and satisfaction patterns.
📦 What’s Inside the Shipping Dashboard in Excel
-
📊 Interactive KPI Dashboard – 5 analytical pages + 1 data sheet.
-
🧭 Page Navigator – Move between pages with one click.
-
🎚️ Dynamic Slicers – Filter by department, region, or mode.
-
🧾 Auto-Refreshing Charts – Update instantly after adding data.
-
📈 Clean Data Integration – Works seamlessly with your Excel files.
-
🧮 No Macros Required – 100% formula-based design.
🧭 How to Use the Shipping Dashboard in Excel
1️⃣ Enter shipment data (carrier, region, cost, satisfaction score) in the Data Sheet.
2️⃣ Click Data → Refresh All to update all visuals.
3️⃣ Navigate between pages using the left-side Page Navigator.
4️⃣ Use slicers to analyze specific regions, modes, or departments.
5️⃣ Review KPIs and charts to identify trends and improvement areas.
✨ Within minutes, your data becomes a professional-grade logistics report ready for presentation.
👥 Who Can Benefit from This Dashboard
-
🚛 Logistics & Supply Chain Managers – Track performance across carriers.
-
💼 Finance Teams – Analyze freight, insurance, and profitability.
-
🏭 Manufacturing Units – Monitor shipping costs and regional trends.
-
🛒 Retailers & E-Commerce Firms – Ensure efficient and on-time delivery.
-
🧭 Operations Leaders – Make data-backed logistics decisions.
🔗 Click here to read the Detailed Blog Post
📺 Visit our YouTube Channel for Step-by-Step Tutorials
👉 YouTube.com/@PKAnExcelExpert


Reviews
There are no reviews yet.