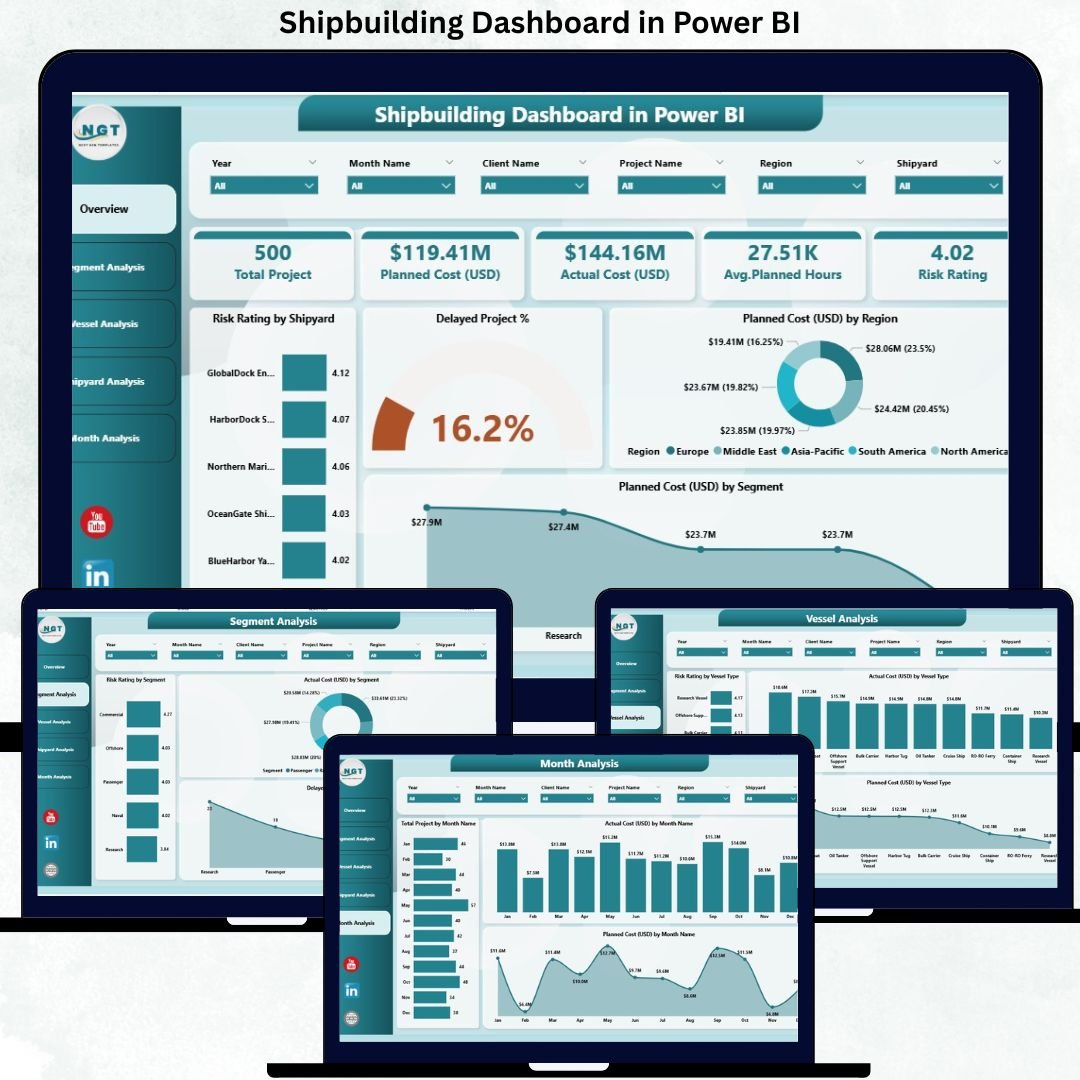
Shipbuilding projects are complex, high-value, and time-sensitive. From managing multiple shipyards and vessel types to controlling costs, risks, and delays, shipbuilding companies must monitor performance continuously. However, when data is spread across spreadsheets, emails, and static reports, visibility disappears and decisions slow down. This is exactly why the Shipbuilding Dashboard in Power BI becomes a mission-critical tool for modern shipbuilding operations.
This ready-to-use Power BI dashboard converts raw shipbuilding data into clear, interactive, and real-time insights. It helps shipyard managers, project leaders, finance teams, and executives monitor risks, track project delays, compare planned vs actual costs, and evaluate performance across shipyards, segments, and vessel types—all in one centralized dashboard. With Power BI visuals and slicers, teams gain instant clarity and take proactive actions instead of reacting late.
⚓ Key Features of the Shipbuilding Dashboard in Power BI
This dashboard is built with five structured analytical pages, each focusing on a specific aspect of shipbuilding performance.
📊 Overview Page – Complete Shipbuilding Performance Snapshot
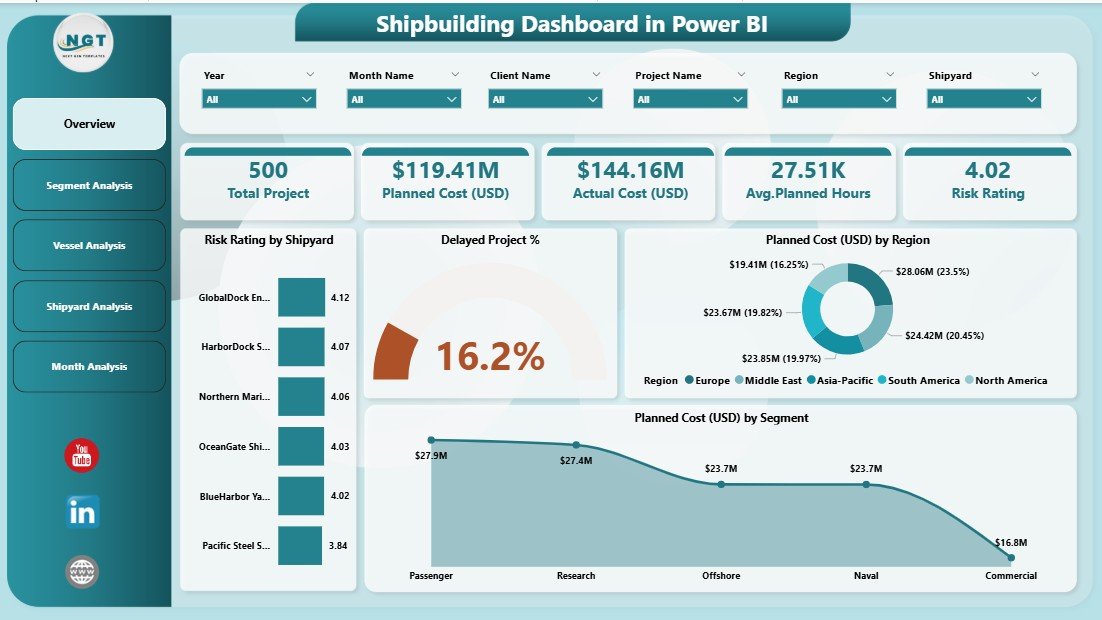
The Overview Page works as the control center of the dashboard. It provides a high-level view of project health and operational risks.
Key elements include:
-
🎛 Interactive slicers for flexible filtering
-
🧮 4 KPI Cards highlighting key metrics
-
📈 4 core charts, including:
-
Risk Rating by Shipyard
-
Delayed Project %
-
Planned Cost (USD) by Region
-
Planned Cost (USD) by Segment
-
This page allows leadership to understand risks, delays, and cost distribution within seconds.
🚢 What’s Inside the Shipbuilding Dashboard in Power BI
The dashboard includes five dedicated analytical pages designed for deep operational insights:
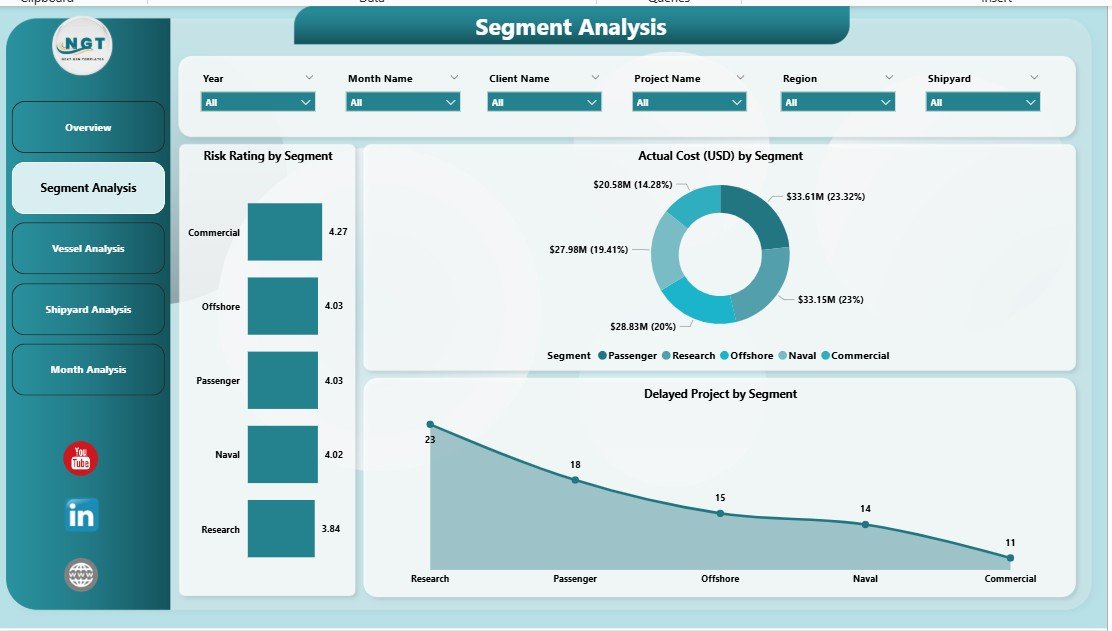
📦 Segment Analysis Page
This page analyzes performance across different business segments.
Charts include:
-
Risk Rating by Segment
-
Delayed Project by Segment
-
Actual Cost (USD) by Segment
It helps identify underperforming segments and optimize cost and risk strategies.
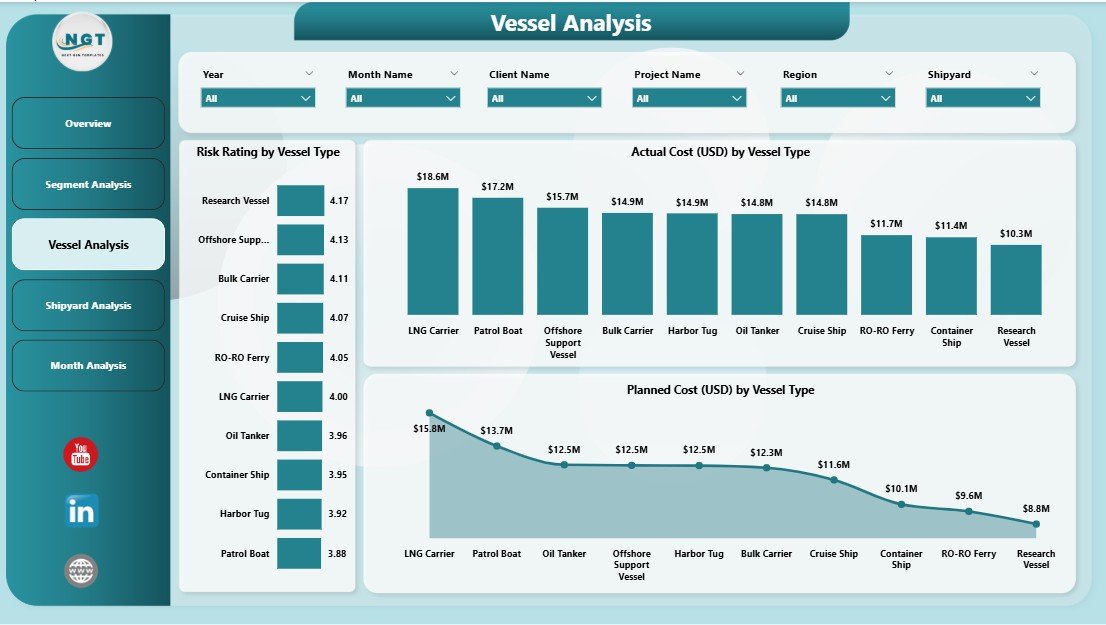
🛳 Vessel Analysis Page
Different vessel types involve different cost and risk profiles.
Charts include:
-
Risk Rating by Vessel Type
-
Planned Cost (USD) by Vessel Type
-
Actual Cost (USD) by Vessel Type
This page supports smarter vessel-level planning and resource allocation.
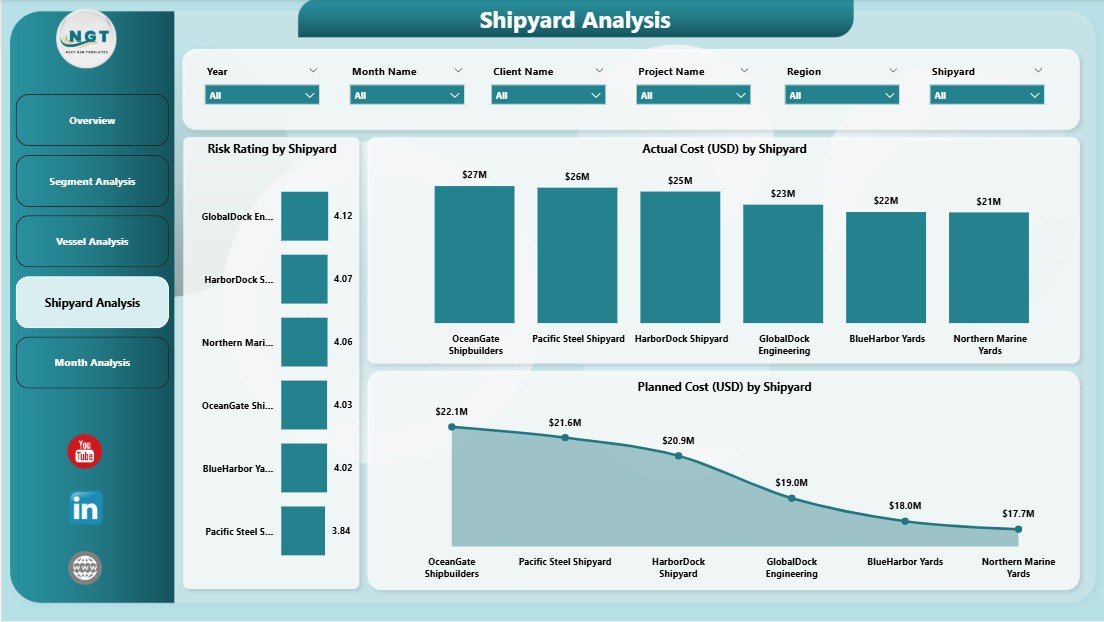
🏗 Shipyard Analysis Page
Shipyard productivity directly impacts project success.
Charts include:
-
Man-Hours by Shipyard
-
Actual Cost (USD) by Shipyard
-
Planned Cost (USD) by Shipyard
Managers use this page to identify inefficiencies, high-cost yards, and productivity gaps.
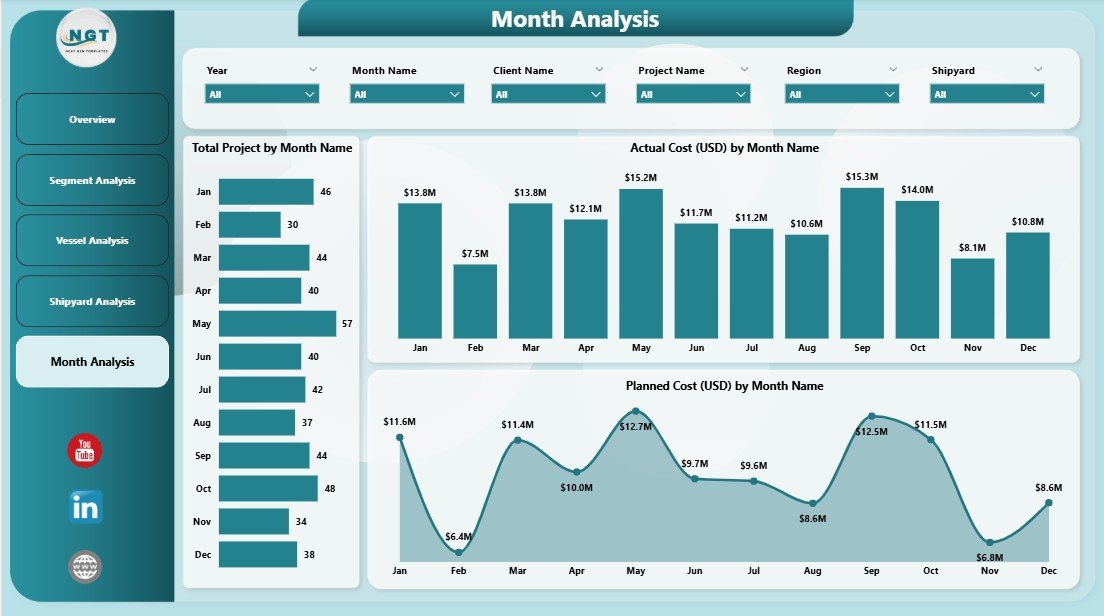
📅 Monthly Trends Page
This page tracks time-based performance and cost movement.
Charts include:
-
Total Projects by Month
-
Actual Cost (USD) by Month
-
Planned Cost (USD) by Month
Monthly trends support forecasting, budgeting, and long-term planning.
🧰 How to Use the Shipbuilding Dashboard in Power BI
1️⃣ Update project, cost, and risk data in the connected data source
2️⃣ Refresh the Power BI dataset
3️⃣ Use slicers to filter by shipyard, segment, vessel type, or month
4️⃣ Review Overview for quick health checks
5️⃣ Drill into segment, vessel, or shipyard pages for deeper insights
6️⃣ Monitor monthly trends to plan future actions
No complex setup. No manual reporting.
👥 Who Can Benefit from This Shipbuilding Dashboard?
This dashboard is ideal for:
-
⚓ Shipyard Managers
-
🧑💼 Project & Program Managers
-
💰 Finance & Cost Control Teams
-
🛠 Operations & Maintenance Teams
-
⚠ Risk & Compliance Teams
-
🧑💼 Senior Leadership & Executives
Any organization involved in shipbuilding or marine engineering gains immediate value.
### Click here to read the Detailed blog post
Visit our YouTube channel to learn step-by-step video tutorials
👉 Youtube.com/@PKAnExcelExpert


Reviews
There are no reviews yet.