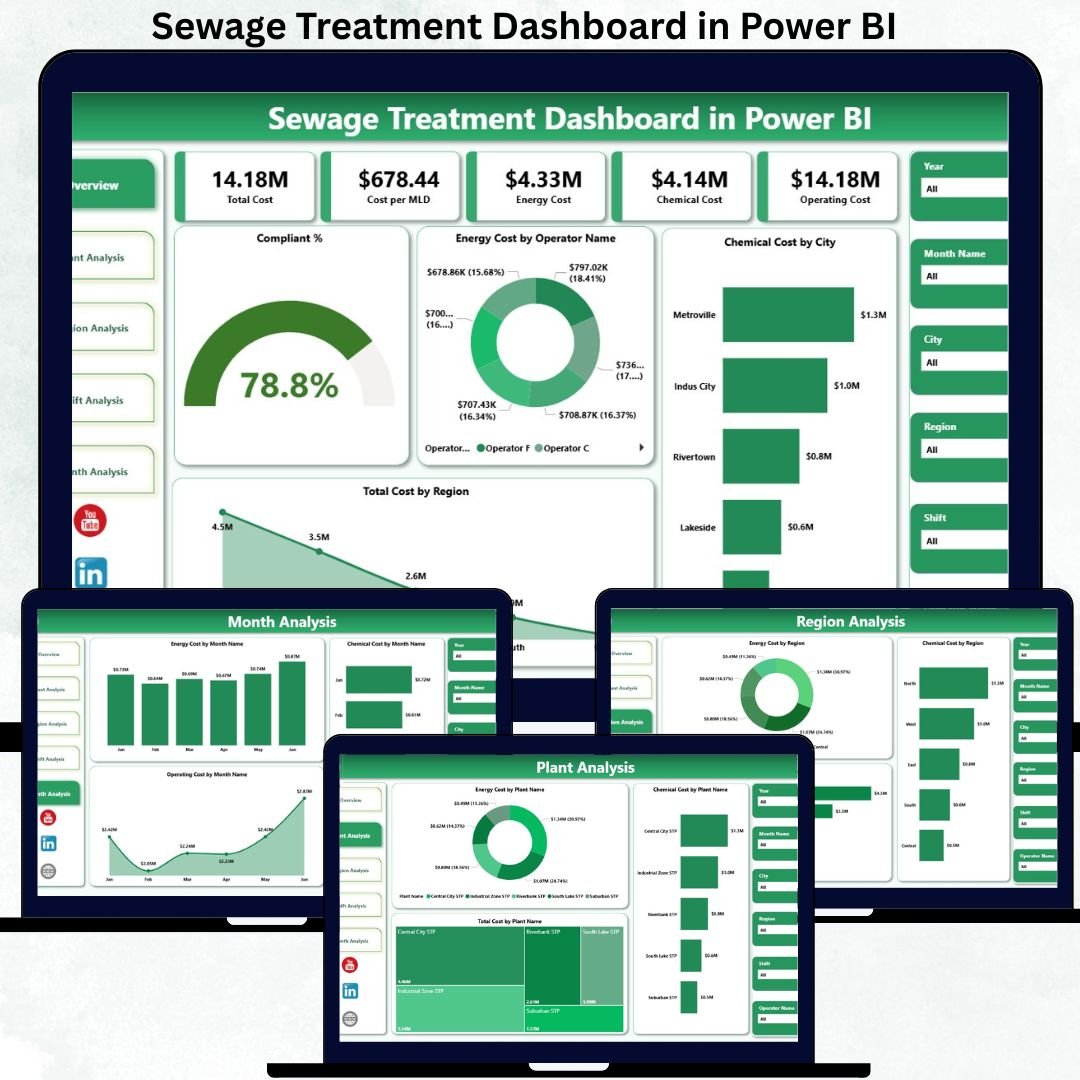
Managing sewage treatment operations is no longer just about compliance—it is about cost control, efficiency, sustainability, and accountability. However, many utilities and municipalities still rely on scattered Excel sheets and manual reports, which delay insights and hide inefficiencies. That is exactly where the Sewage Treatment Dashboard in Power BI becomes a powerful and essential solution.
This ready-to-use Power BI dashboard transforms raw sewage treatment data into clear visuals, KPI cards, and interactive analysis pages. Instead of spending hours consolidating reports, plant managers and decision-makers can instantly monitor energy costs, chemical expenses, operating costs, and compliance performance across plants, regions, shifts, and time periods.
Because the dashboard is built in Power BI, users can drill down from a high-level overview to detailed plant-level insights within seconds. As a result, organizations gain faster visibility, stronger cost control, and improved regulatory compliance—all from a single dashboard.
📊 Key Features of the Sewage Treatment Dashboard in Power BI
This dashboard is designed for real-world sewage treatment operations and daily decision-making.
⚡ Centralized Performance Monitoring
View all operational KPIs in one professional Power BI dashboard.
🧪 Energy & Chemical Cost Tracking
Analyze energy usage and chemical consumption patterns clearly.
💰 Total Operating Cost Visibility
Track total costs by plant, region, shift, and month.
📈 Compliance Performance Monitoring
Instantly view compliance percentages and identify risk areas.
🎛 Interactive Slicers & Filters
Filter data dynamically by plant, region, operator, shift, and month.
🔍 Multi-Level Drill-Down Analysis
Move seamlessly from summary views to detailed operational insights.
📦 What’s Inside the Sewage Treatment Dashboard in Power BI
This dashboard includes five well-structured analytical pages, each answering a specific operational question.
📍 Overview Page – Overall Sewage Treatment Performance
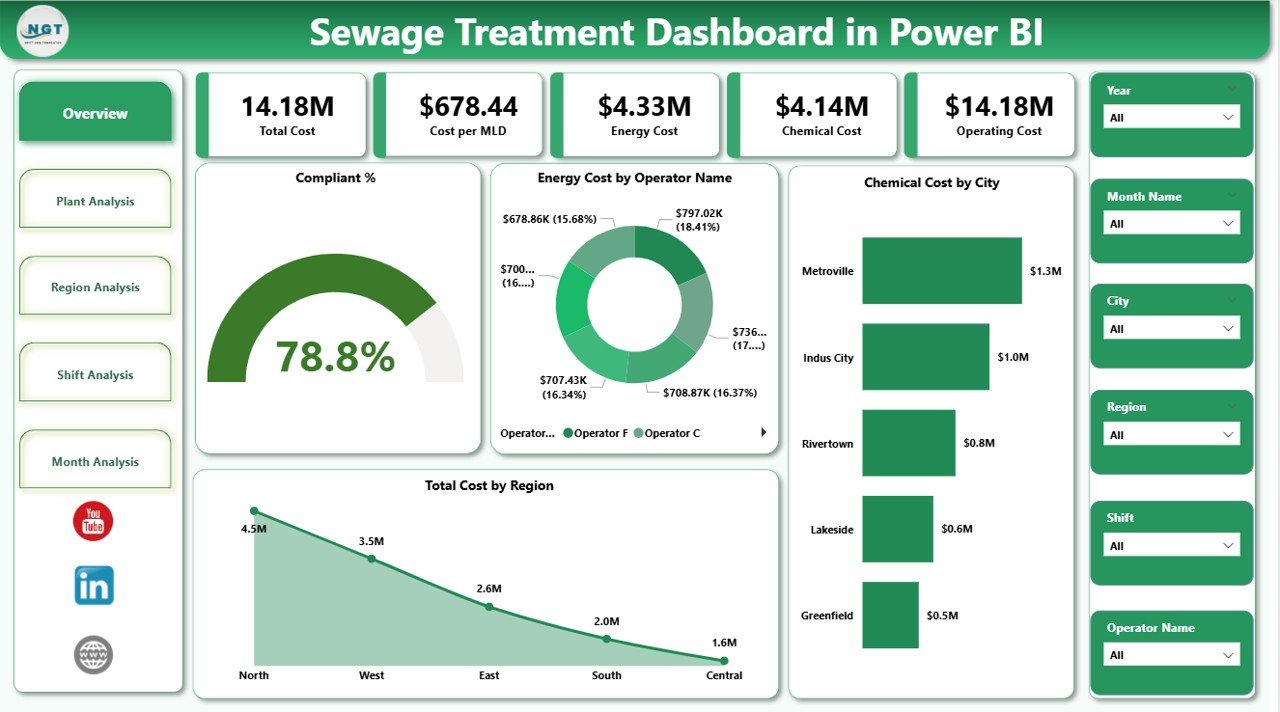
The Overview Page is the main landing page of the dashboard.
KPI Cards Included
-
Compliance Percentage
-
Total Energy Cost
-
Total Chemical Cost
-
Total Operating Cost
Key Charts on This Page
-
Compliance %
-
Energy Cost by Operator Name
-
Chemical Cost by City
-
Total Cost by Region
This page allows leadership to understand system health, cost drivers, and compliance status at a glance.
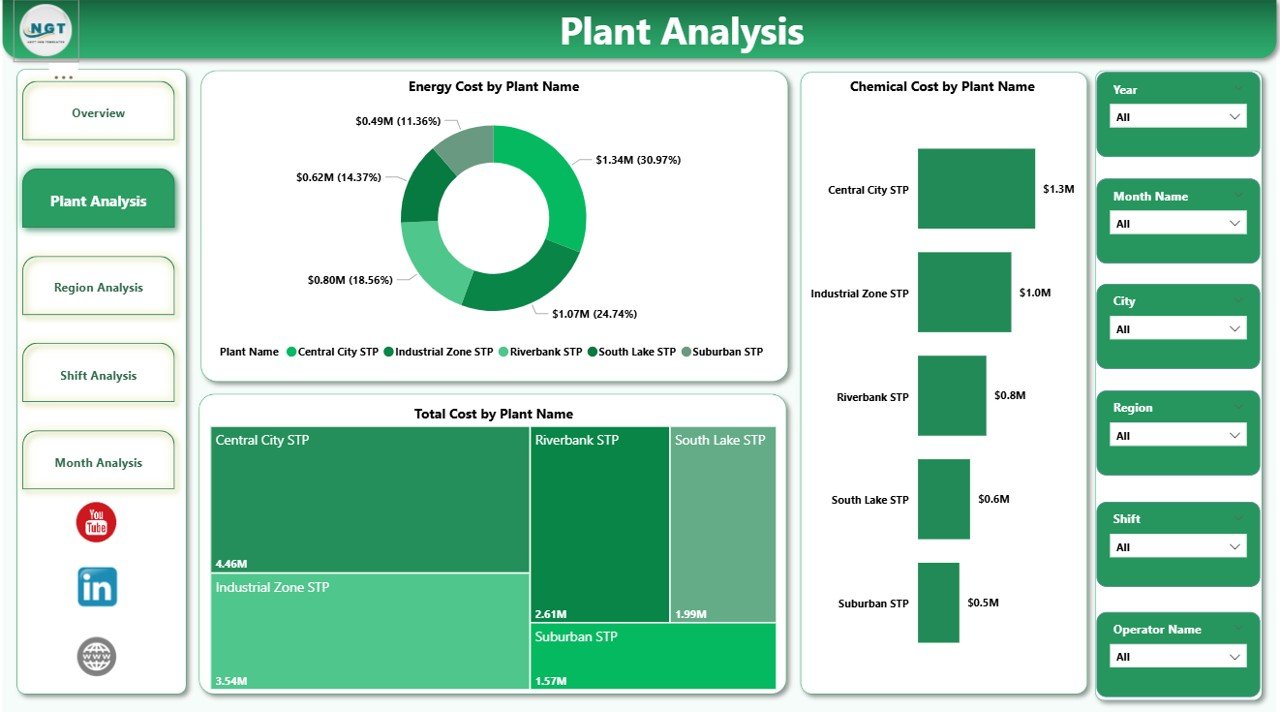
🏭 Plant Analysis Page – Plant-Wise Cost Comparison
The Plant Analysis Page focuses on individual sewage treatment plants.
Charts Included
-
Energy Cost by Plant Name
-
Chemical Cost by Plant Name
-
Total Cost by Plant Name
With this view, managers can benchmark plants, identify inefficiencies, and prioritize improvement actions.
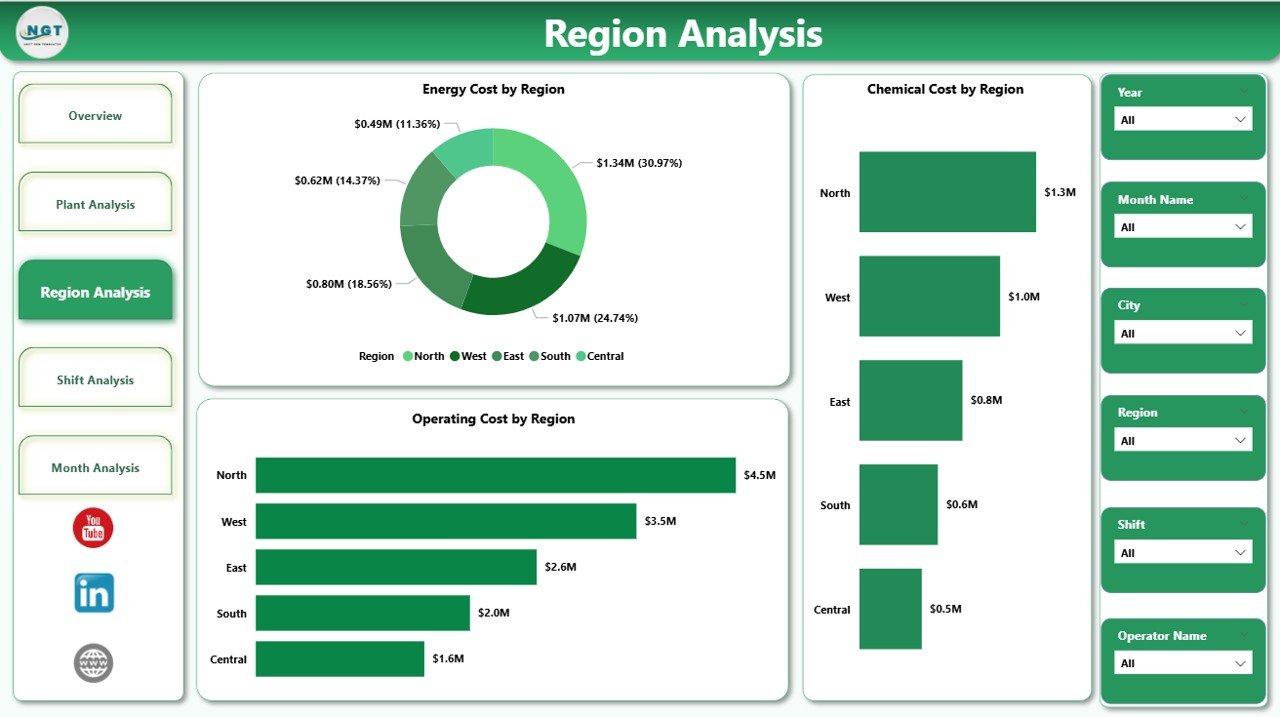
🌍 Region Analysis Page – Regional Cost Insights
The Region Analysis Page highlights cost behavior across regions.
Charts Included
-
Energy Cost by Region
-
Chemical Cost by Region
-
Operating Cost by Region
This analysis supports better budget allocation and regional performance comparison.
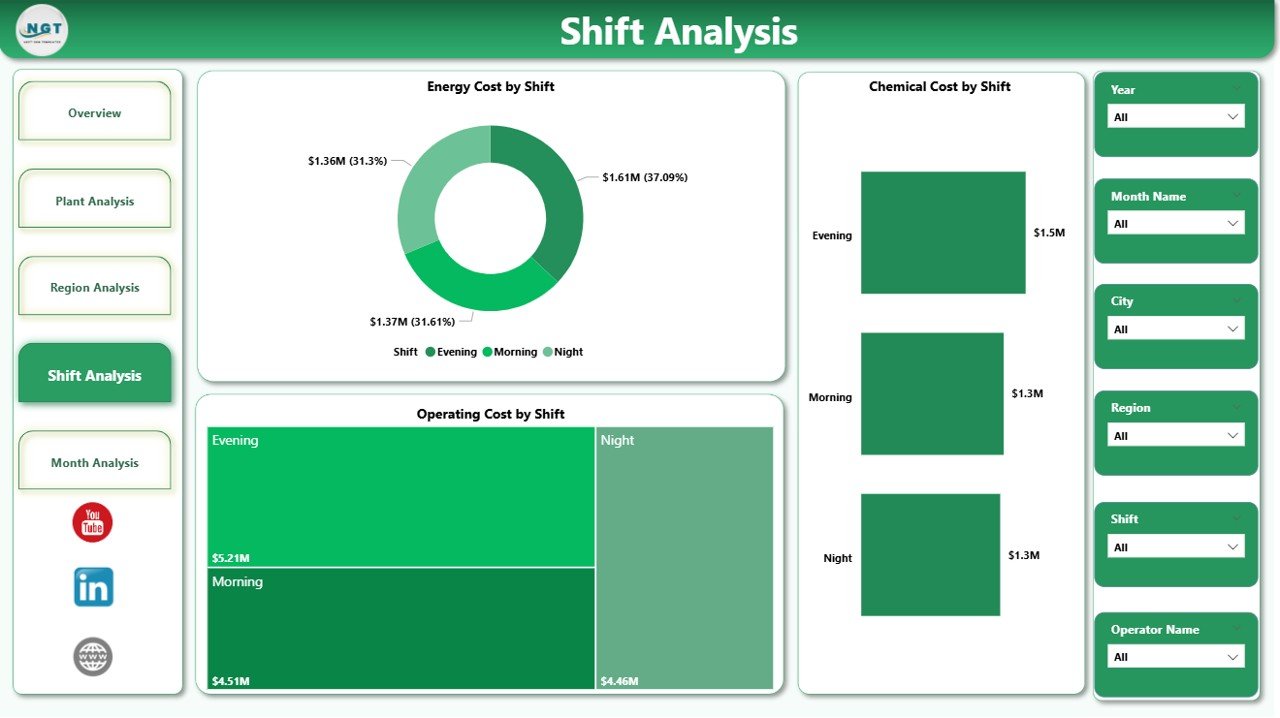
⏱ Shift Analysis Page – Shift-Wise Operational Impact
Because sewage treatment plants operate 24/7, shift analysis is critical.
Charts Included
-
Energy Cost by Shift
-
Chemical Cost by Shift
-
Operating Cost by Shift
This page helps identify high-cost shifts, improve accountability, and optimize staffing strategies.
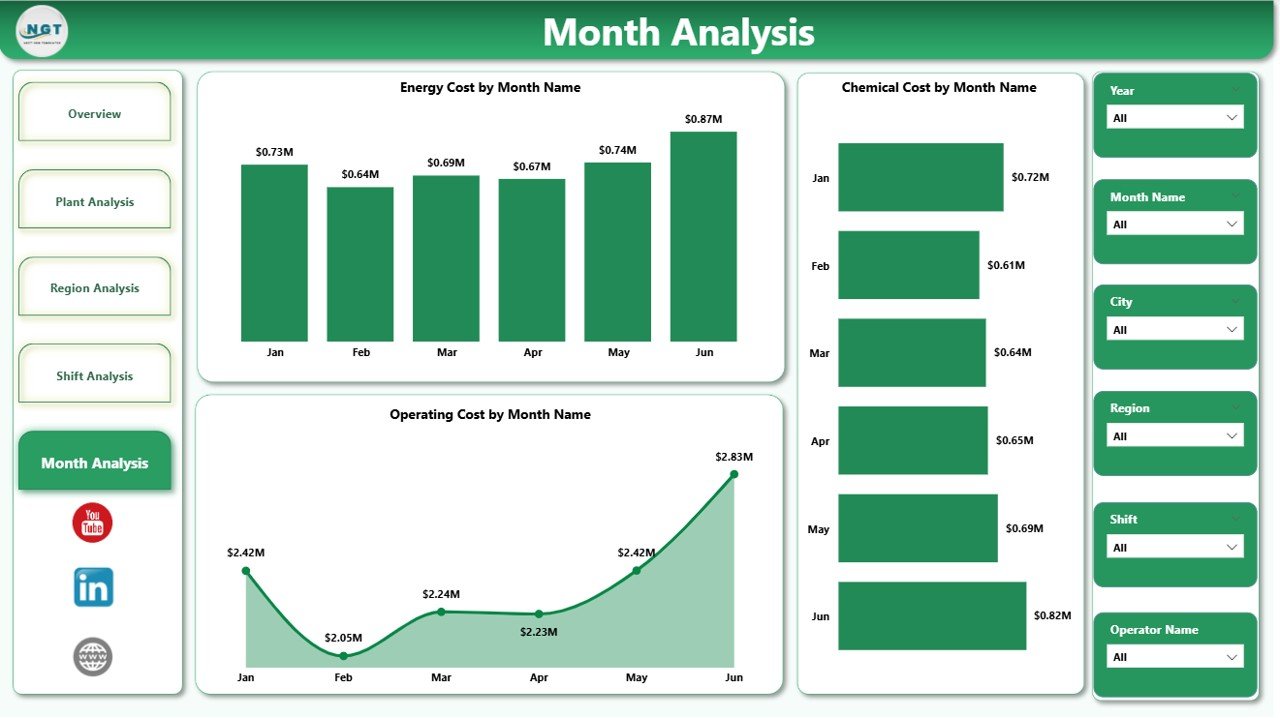
📆 Monthly Trends Page – Time-Based Cost Analysis
The Monthly Trends Page tracks how costs evolve over time.
Charts Included
-
Energy Cost by Month
-
Chemical Cost by Month
-
Operating Cost by Month
Trend analysis helps detect seasonal patterns, forecast expenses, and support long-term planning.
⚙️ How to Use the Sewage Treatment Dashboard
1️⃣ Update operational data (energy, chemical, operating costs)
2️⃣ Refresh the Power BI dataset
3️⃣ Use slicers to filter by plant, region, shift, or month
4️⃣ Review KPI cards and cost charts
5️⃣ Drill down to identify inefficiencies
6️⃣ Take corrective, data-driven actions
No complex setup. No manual calculations. Just clean data and instant insights.
👥 Who Can Benefit from This Dashboard?
This dashboard is ideal for:
-
🚰 Sewage Treatment Plant Managers
-
🏢 Utility Companies
-
🌱 Environmental & Compliance Officers
-
🛠 Operations & Maintenance Teams
-
🏛 Municipal Authorities
-
♻️ Sustainability & Energy Managers
Anyone responsible for wastewater operations and cost control will benefit immediately.
### Click here to read the Detailed blog post
Visit our YouTube channel to learn step-by-step video tutorials
👉 Youtube.com/@PKAnExcelExpert


Reviews
There are no reviews yet.