


In today’s highly competitive digital marketing world, SEO and SEM performance decides growth. Rankings, traffic, conversions, ad spend, and ROI change every single month. However, when performance data stays scattered across Google Analytics, Search Console, Ads platforms, and manual spreadsheets, marketing teams lose clarity and speed.
That is exactly why the SEO and SEM Services KPI Dashboard in Excel becomes a powerful performance-tracking solution 🔥.
This ready-to-use Excel dashboard converts complex SEO and paid search data into clear KPIs, instant comparisons, and trend-based insights, allowing teams to track results, optimize campaigns, and improve ROI with confidence.
Designed for digital marketing agencies, SEO consultants, SEM specialists, marketing managers, and business owners, this dashboard helps you monitor MTD and YTD performance, compare targets vs actuals, analyze trends, and maintain KPI consistency—all inside Excel, without expensive tools or complex BI systems.
🔑 Key Features of SEO and SEM Services KPI Dashboard in Excel
📊 Centralized SEO & SEM Performance Tracking
Track organic and paid search KPIs in one structured dashboard.
📅 Dynamic Month Selection
Select any month from a drop-down and refresh the entire dashboard instantly.
🎯 Target vs Actual Monitoring
Quickly identify which KPIs meet targets and which need action.
📈 MTD & YTD Performance View
Balance short-term execution with long-term growth tracking.
🔁 Current Year vs Previous Year Comparison
Measure improvement using year-over-year performance analysis.
📉 KPI-Wise Trend Analysis
Understand SEO and SEM trends using MTD and YTD charts.
📘 Clear KPI Definitions & Governance
Avoid confusion with standardized KPI formulas and logic.
⚡ 100% Excel-Based & Easy to Use
No coding, no BI tools—simple, flexible, and business-ready.
What’s Inside the SEO and SEM Services KPI Dashboard in Excel

🏠 Home Sheet
A clean index page with 6 navigation buttons for instant access to all worksheets.
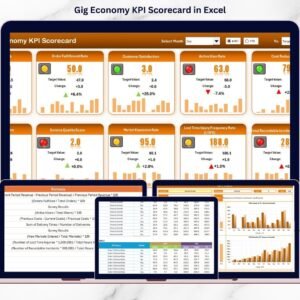
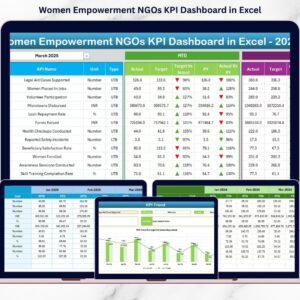
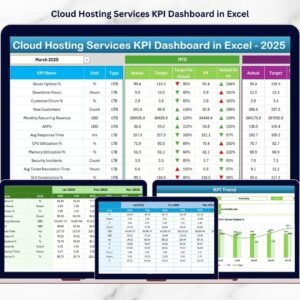
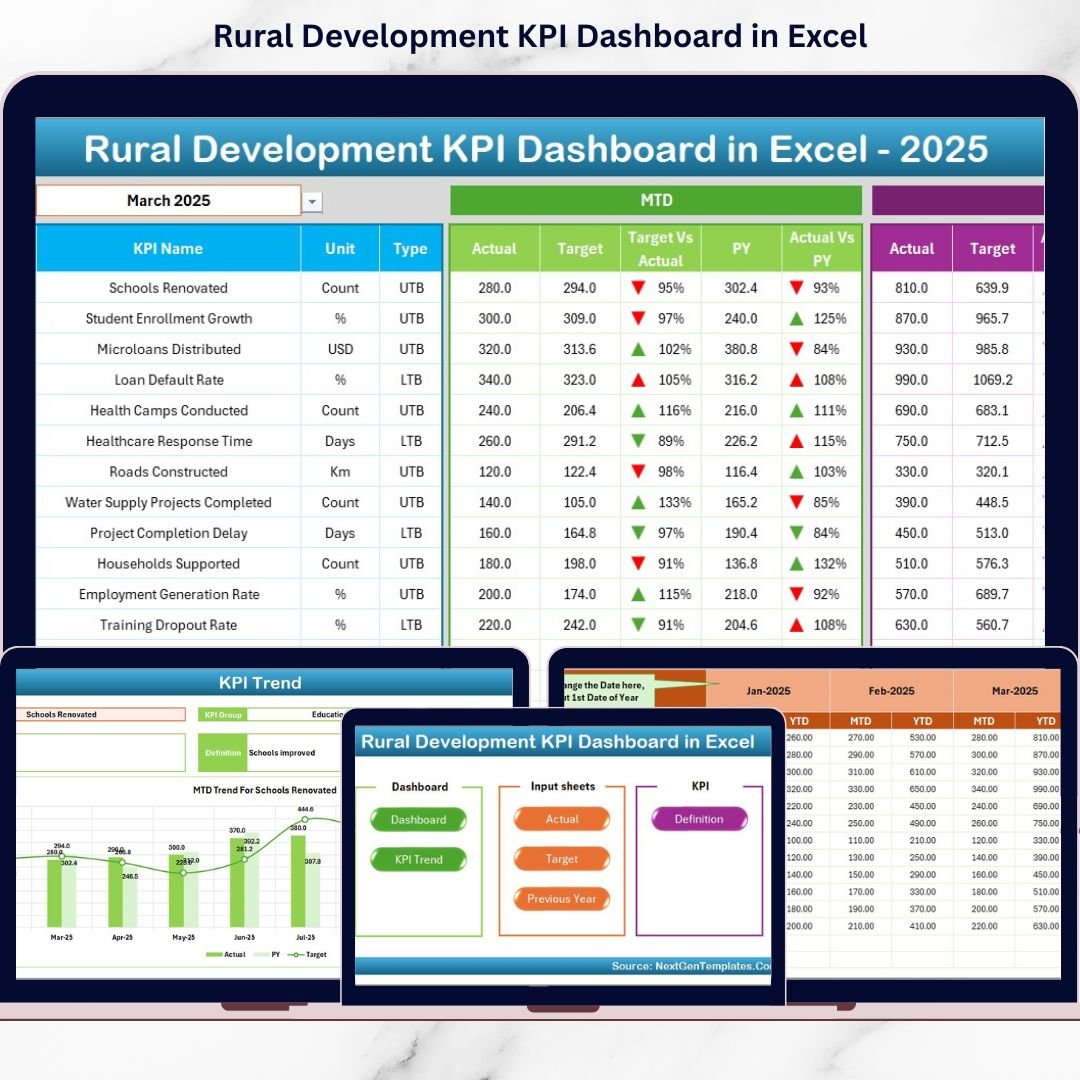
📊 Dashboard Sheet
The core performance view showing all KPIs with MTD and YTD analysis.
Displayed Metrics:
-
Actual vs Target (MTD & YTD)
-
Previous Year comparison
-
Target vs Actual %
-
CY vs PY %
-
Visual ▲ / ▼ indicators using conditional formatting
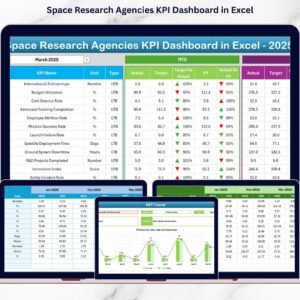
📈 KPI Trend Sheet
Deep-dive analysis for individual KPIs.
Features:
-
KPI selection drop-down
-
MTD trend chart (Actual vs Target vs PY)
-
YTD trend chart (Actual vs Target vs PY)
-
KPI group, unit, formula, and definition
📥 Actual Numbers Input Sheet
Enter current-year MTD and YTD actual values in a structured format.
🎯 Target Sheet
Define monthly and yearly SEO and SEM targets clearly.
📅 Previous Year Number Sheet
Store last year’s data to enable year-over-year comparisons.
📘 KPI Definition Sheet
Maintain KPI name, group, unit, formula, and definition for consistency.
⚙️ How to Use the SEO and SEM Services KPI Dashboard in Excel
📝 Step 1: Enter Performance Data
Update actual, target, and previous-year values in input sheets.
📅 Step 2: Select Month
Choose the required month from cell D3 to update the dashboard.
📊 Step 3: Review KPI Status
Use arrows, percentages, and comparisons to spot issues instantly.
📈 Step 4: Analyze Trends
Study MTD and YTD trend charts for growth or decline patterns.
🎯 Step 5: Optimize Campaigns
Reallocate budgets, refine keywords, and improve ROI.
👥 Who Can Benefit from This SEO and SEM Services KPI Dashboard in Excel
📈 Digital Marketing Agencies – Track client SEO & SEM performance
🔍 SEO Consultants – Monitor rankings, traffic, and conversions
💰 SEM Specialists – Optimize CPC, ROAS, and ad spend
📊 Marketing Managers – Evaluate campaign ROI and growth
🏢 Business Owners – Get a clear performance overview
🔍 Click here to read the Detailed blog post
📺 Visit our YouTube channel to learn step-by-step video tutorials
👉 Youtube.com/@PKAnExcelExpert


Reviews
There are no reviews yet.