Running aSeed and Fertilizer Manufacturing Dashboard is not easy. Production schedules change. Raw material costs fluctuate. Sales channels perform differently. Meanwhile, management expects accurate numbers every single day.
If you still depend on scattered Excel sheets and manual reports, you are losing valuable time — and possibly profit.
Now, imagine tracking revenue, cost, profit margin, plant performance, product categories, sales channels, and monthly trends in one powerful Excel file.
That’s exactly what the Seed and Fertilizer Manufacturing Dashboard in Excel delivers.
This ready-to-use dashboard transforms your raw data into meaningful insights using dynamic Pivot Tables, slicers, and interactive charts. As a result, you make faster decisions, improve efficiency, and increase profitability.
🚀 Key Features of Seed and Fertilizer Manufacturing Dashboard in Excel
✅ 5 Fully Designed Analytical Pages for complete performance tracking
📊 Interactive Pivot Charts for dynamic insights
🎯 KPI Cards for quick summary view
🔎 Right-Side Slicers for easy filtering by Month, Region, Plant & Category
🧭 Page Navigator for smooth navigation
📁 Structured Support Sheet for backend setup
🔄 One-Click Data Refresh functionality
📈 Month-wise, Plant-wise, Product-wise & Channel-wise Analysis
Because it is built using Pivot Tables, you can easily update data and refresh reports instantly.
📦 What’s Inside the Seed and Fertilizer Manufacturing Dashboard in Excel
This dashboard includes 5 powerful analysis pages:
1️⃣ Overview Page
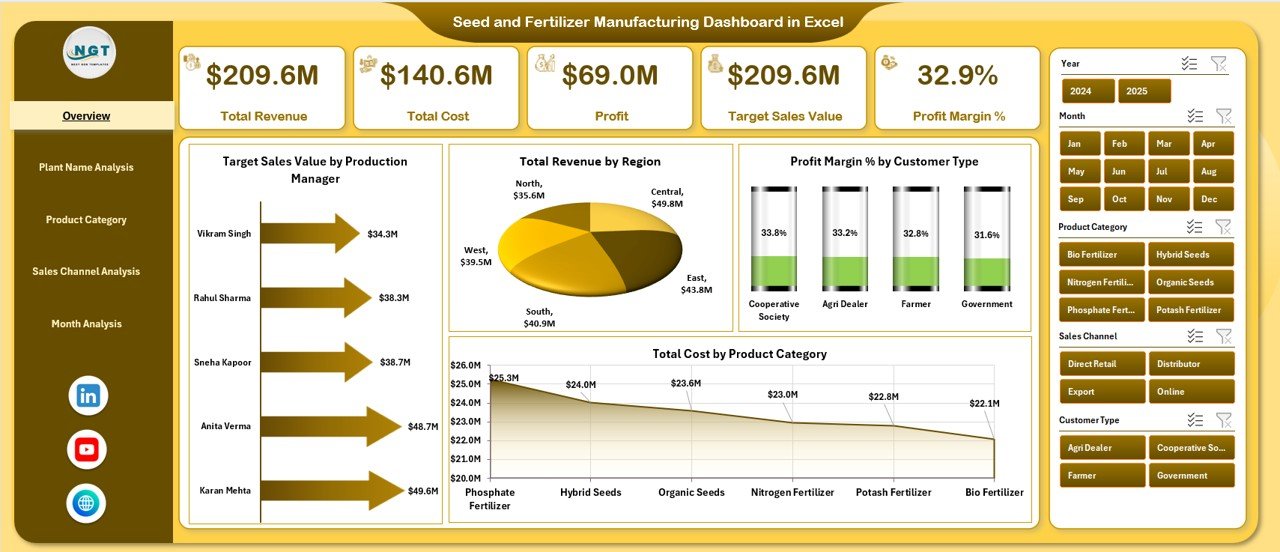
Your control center. It displays:
-
Target Sales by Production Manager
-
Total Revenue by Region
-
Profit Margin % by Customer Type
-
Total Cost by Product Category
Top management gets instant clarity at a glance.
2️⃣ Plant Name Analysis
Compare plant performance using:
-
Revenue by Plant
-
Cost by Plant
-
Profit Margin % by Plant
-
Profit by Plant
Identify high-performing and underperforming units quickly.
3️⃣ Product Category Analysis
Track performance across:
-
Hybrid Seeds
-
Organic Fertilizers
-
Chemical Fertilizers
-
Micronutrients
-
Crop Protection Products
Monitor revenue, cost, margins, and production targets.
4️⃣ Sales Channel Analysis
Evaluate:
-
Direct Sales
-
Distributor Network
-
Dealer Network
-
Online Orders
-
Institutional Sales
Discover which channel generates maximum profit.
5️⃣ Month Analysis
Track seasonal trends with:
-
Revenue by Month
-
Cost by Month
-
Profit by Month
Plan production and inventory smartly.
Additionally, you receive:
-
📑 Data Sheet for transaction-level entries
-
🛠 Support Sheet with master lists & target data
🛠 How to Use the Seed and Fertilizer Manufacturing Dashboard in Excel
Using this dashboard is simple:
1️⃣ Enter your transaction data in the Data Sheet
2️⃣ Maintain plant names, categories, and channels in Support Sheet
3️⃣ Click Refresh
4️⃣ Use slicers to filter insights instantly
No advanced Excel knowledge required. Basic understanding of Excel is enough.
👥 Who Can Benefit from This Seed and Fertilizer Manufacturing Dashboard in Excel
🌾 Seed Manufacturing Companies
🧪 Fertilizer Production Units
🌿 Agrochemical Businesses
📊 Plant Managers
💼 Regional Sales Managers
💰 Finance & Accounts Teams
⚙ Operations Heads
If you manage production, sales, cost, or profitability — this dashboard is built for you.
By using this dashboard, you:
✔ Improve decision-making speed
✔ Identify profit leakage
✔ Compare plant efficiency
✔ Optimize sales channels
✔ Track production manager targets
✔ Monitor seasonal performance
Instead of wasting hours preparing reports, you focus on improving operations.
This is not just an Excel file. It is a complete analytical solution designed specifically for agricultural manufacturing businesses.
If you want to control cost, boost margins, and gain complete visibility over your manufacturing performance, this dashboard gives you the clarity you need.