Managing a Secondary Schools Dashboard today requires more than academic excellence alone. School administrators must continuously monitor student strength, attendance, exam performance, scholarships, participation activities, and month-wise trends. However, when this information remains scattered across Excel files and manual reports, decision-making becomes slow, reactive, and error-prone.
That is exactly where the Secondary Schools Dashboard in Power BI becomes a powerful and practical solution.
This ready-to-use Power BI dashboard transforms raw school data into clear, interactive, and actionable insights. Instead of reviewing multiple reports, school leaders can monitor all key academic and administrative metrics from a single, centralized dashboard.
Built using Power BI with structured data sources, this dashboard enables schools to analyze performance dynamically using slicers and visuals. As a result, principals, coordinators, and management teams gain instant clarity and confidence in decision-making.
🔑 Key Features of Secondary Schools Dashboard in Power BI
📊 Centralized School Analytics – Track academics, attendance, scholarships, and activities in one place
🎯 Data-Driven Academic Insights – Identify performance gaps and improvement areas
🧑🎓 Student Distribution Analysis – Analyze students by grade, city, subject, and board
📈 Attendance & Exam Score Tracking – Monitor academic consistency over time
🎓 Scholarship Analysis – Evaluate scholarship distribution by gender, grade, and board
⚽ Participation Activity Insights – Measure engagement and its impact on performance
📅 Month-Wise Trend Analysis – Identify seasonal patterns and progress
🧭 Interactive Slicers – Filter data by month, grade, city, board, and activity
This dashboard helps schools move from manual reporting to proactive academic management.
📂 What’s Inside the Secondary Schools Dashboard in Power BI?
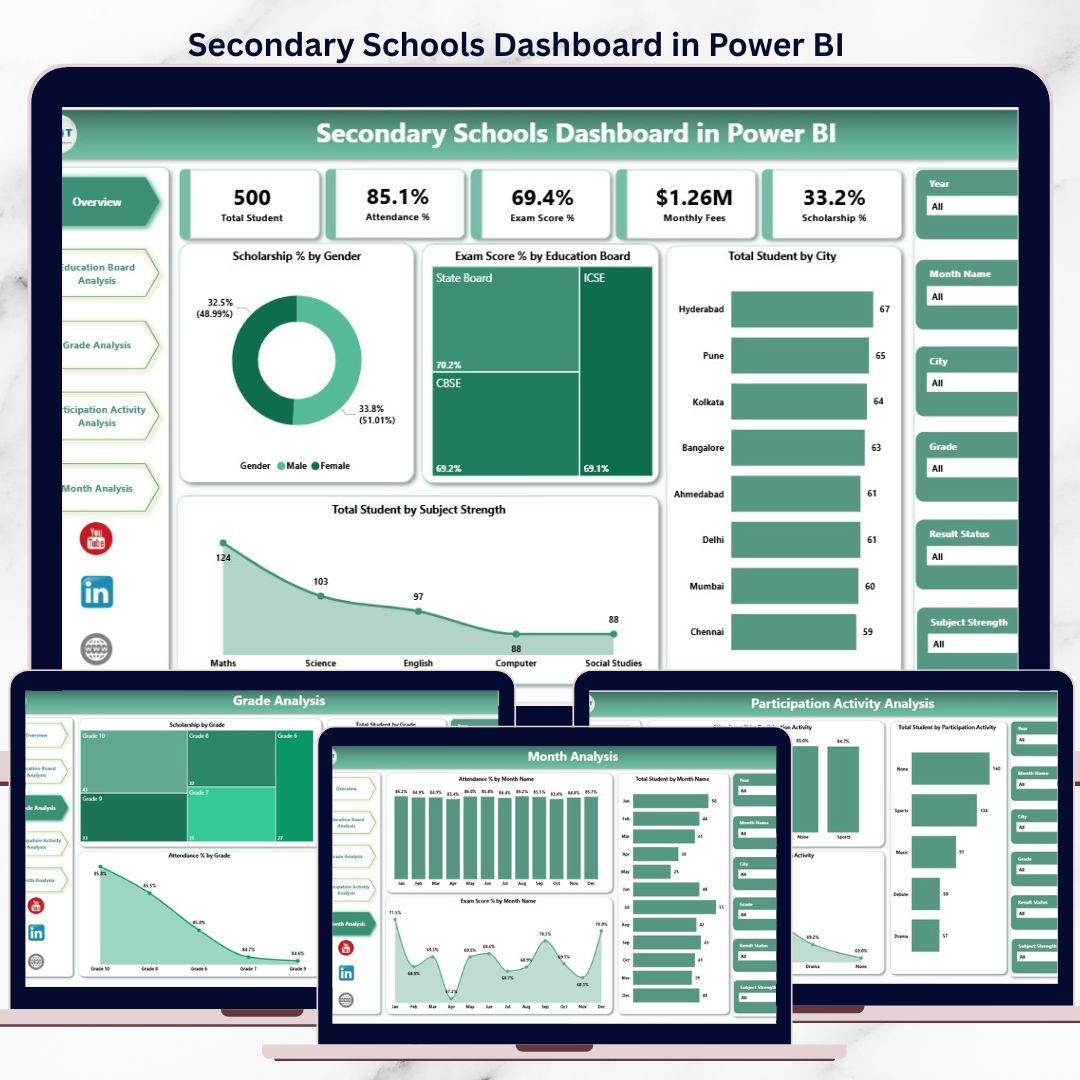
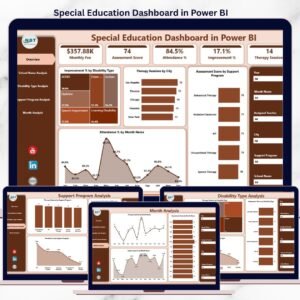
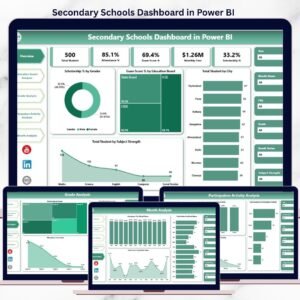
📊 1. Overview Page – Complete School Snapshot
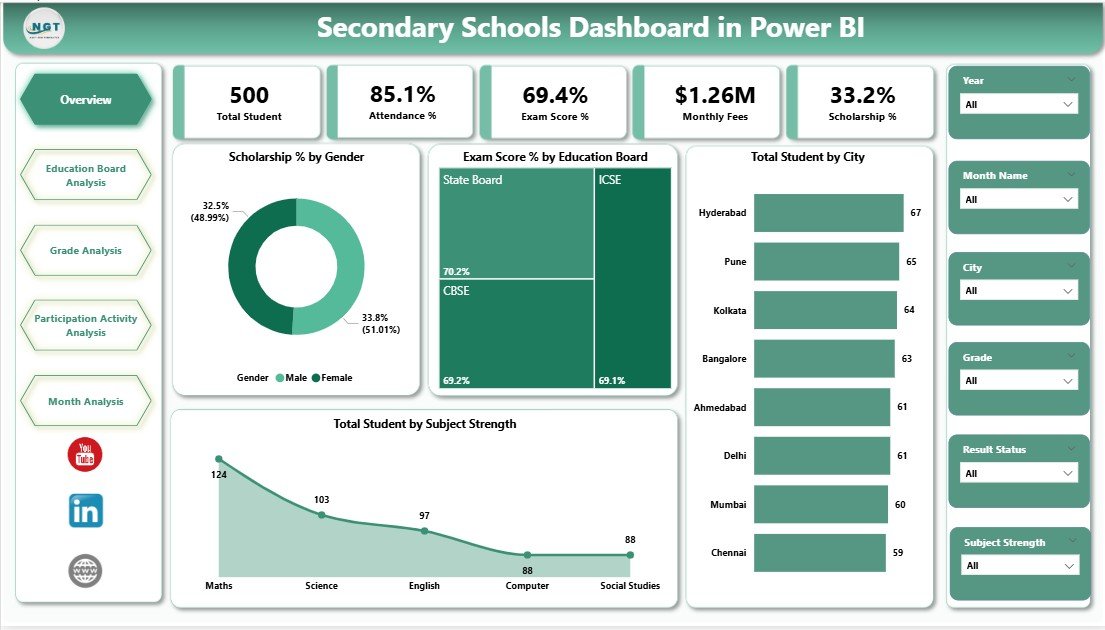
The Overview Page provides a high-level summary of overall school performance.
Key Visuals Included:
-
Scholarship % by Gender
-
Exam Score % by Education Board
-
Total Students by City
-
Total Students by Subject Strength
This page helps leadership understand the school’s current status within seconds.
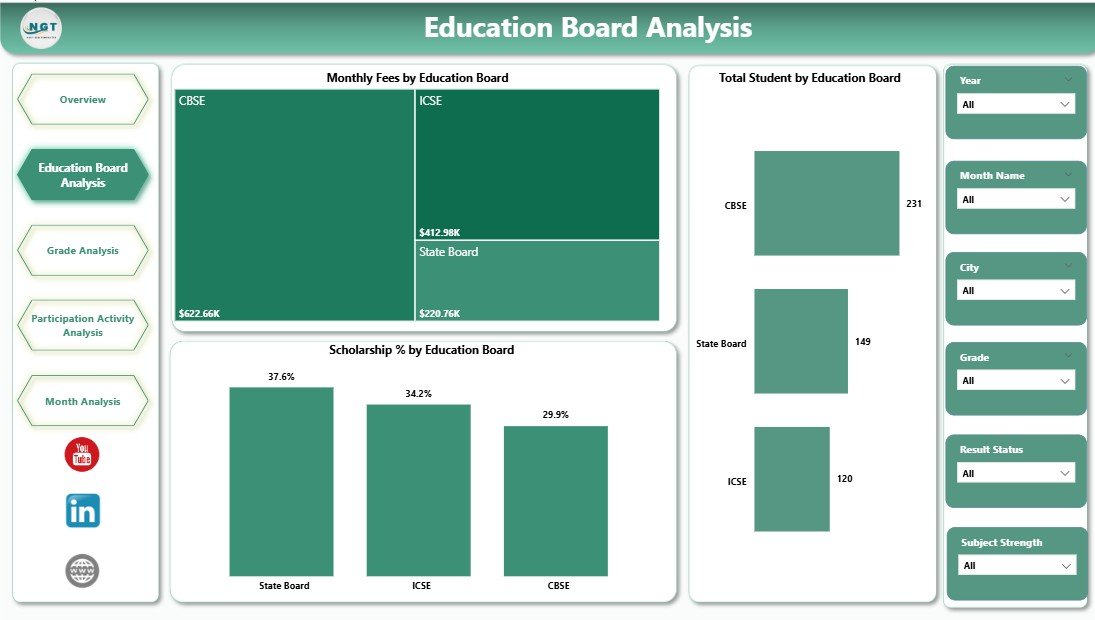
🏫 2. Education Board Analysis Page
This page compares performance across different education boards.
Key Insights:
-
Monthly Fees by Education Board
-
Total Students by Education Board
-
Scholarship % by Education Board
It supports strategic academic planning and financial evaluation.
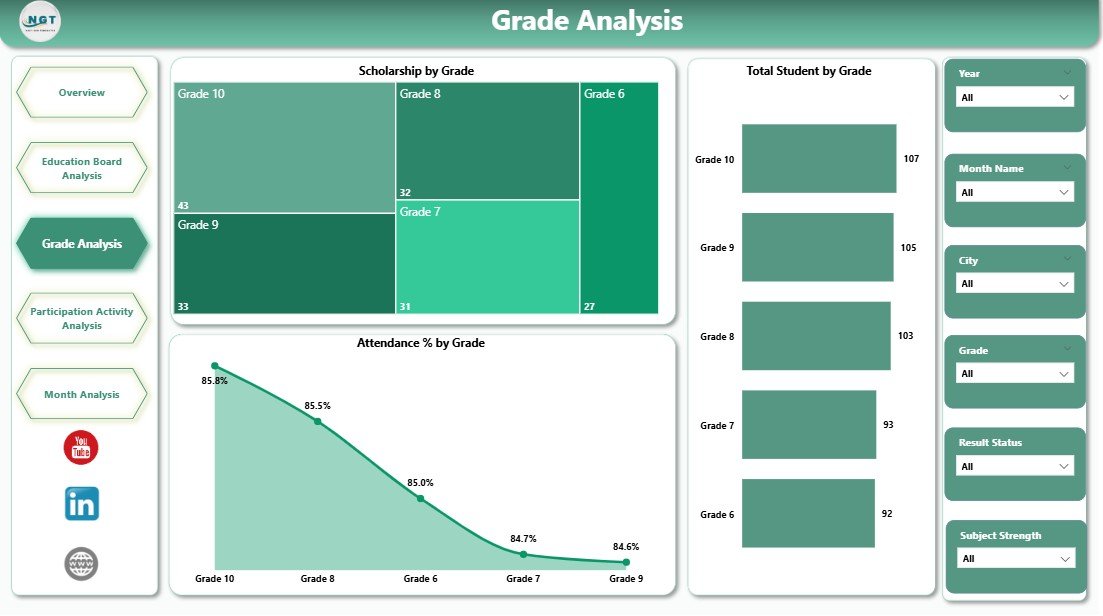
📚 3. Grade Analysis Page
The Grade Analysis Page focuses on grade-level insights.
Key Visuals:
-
Attendance % by Grade
-
Exam Score % by Grade
-
Total Students by Grade
-
Scholarship % by Grade
This page helps schools identify grades that require academic or attendance interventions.
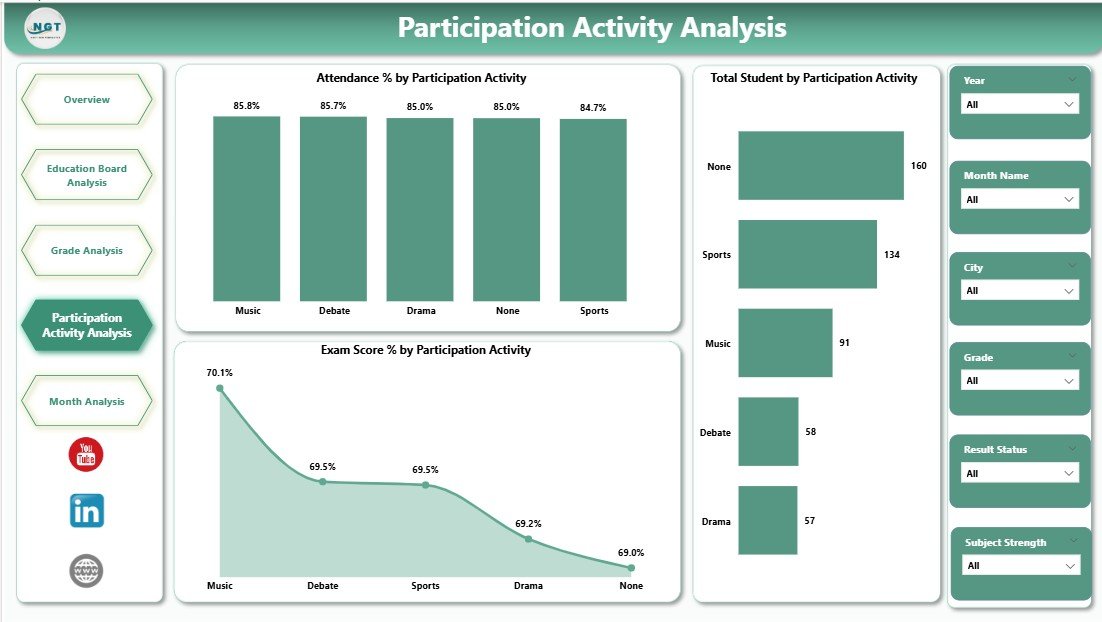
🎯 4. Participation Activity Analysis Page
This page evaluates extracurricular participation and its academic impact.
Key Visuals:
-
Attendance % by Participation Activity
-
Total Students by Participation Activity
-
Exam Score % by Participation Activity
It supports holistic student development and engagement planning.
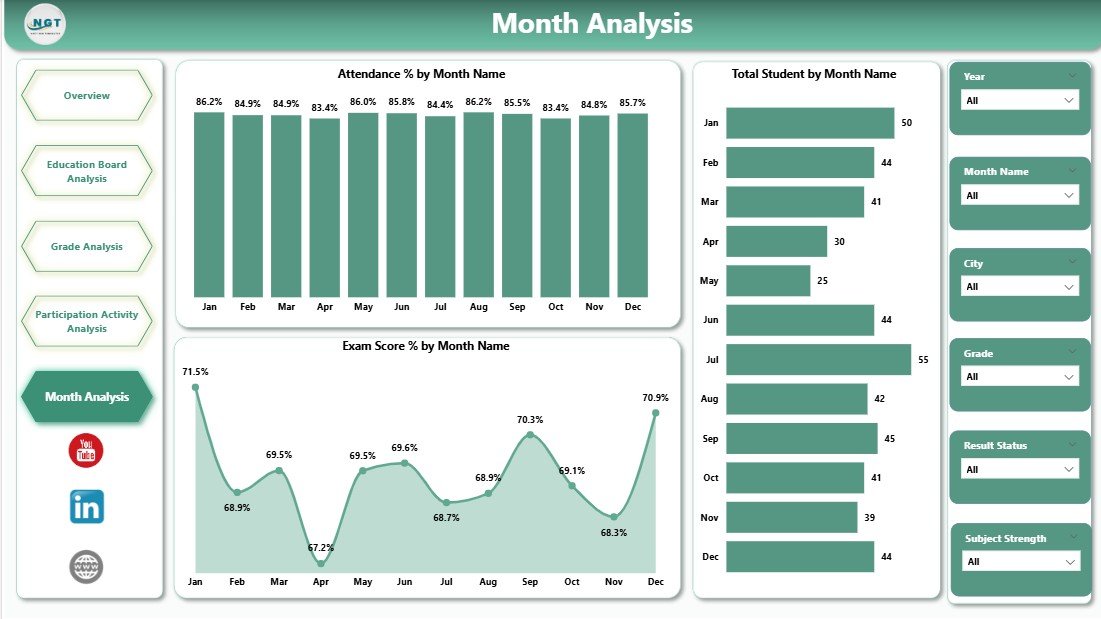
📆 5. Month Analysis Page
The Month Analysis Page tracks time-based trends.
Key Visuals:
-
Attendance % by Month
-
Total Students by Month
-
Exam Score % by Month
Monthly insights support planning, forecasting, and continuous improvement.
👥 Who Can Use This Dashboard?
🏫 School Principals & Administrators
📊 Academic Coordinators
💼 Management Committees
🎓 Education Boards
📈 Data & MIS Teams
Suitable for public and private secondary schools of any size.
👉 Click here to read the detailed blog post
▶️ Visit our YouTube channel for step-by-step tutorials
https://youtube.com/@PKAnExcelExpert


Reviews
There are no reviews yet.