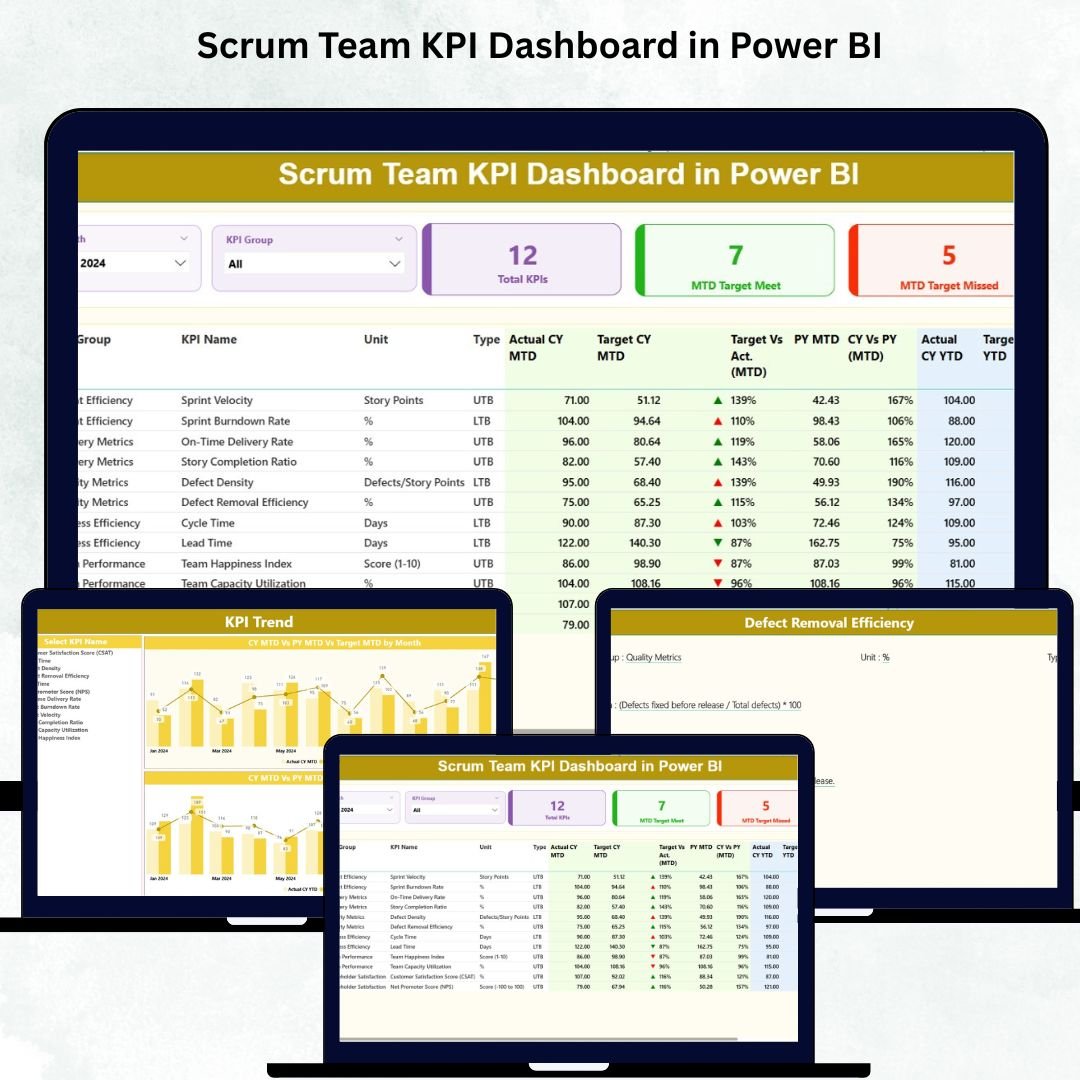
Scrum teams work fast. Every sprint brings new tasks, user stories, defects, ceremonies, and deadlines. When performance is not tracked clearly, teams struggle to understand velocity, quality, delivery speed, and progress. Manual spreadsheets slow everything down and make decisions harder. That’s why the Scrum Team KPI Dashboard in Power BI is the perfect tool for Agile teams who want real-time insights, faster reviews, and better sprint outcomes. 🚀
This ready-to-use dashboard converts raw Excel-based KPI data into automated, interactive, and visually rich analytics. Scrum Masters, Product Owners, Agile Coaches, and Development Teams can instantly view Month-to-Date (MTD) and Year-to-Date (YTD) performance, analyze sprint trends, compare actual vs target values, and understand how performance changes over time. One dashboard—complete clarity.
Whether you manage small Scrum teams or large Agile organizations, this dashboard helps you improve predictability, transparency, and planning accuracy. With KPI cards, slicers, combo charts, and detailed tables, you get the complete performance story in a clean, modern Power BI interface.
✨ Key Features of Scrum Team KPI Dashboard in Power BI
Transform the way your Scrum team tracks and analyzes performance with these powerful features:
📊 MTD & YTD KPI Tracking
Track Month-to-Date and Year-to-Date metrics for every KPI, compare with targets, and view YoY insights—all automatically.
📈 Combo Charts for Trend Analysis
Identify patterns using two dynamic combo charts that show Actual vs Target vs Previous Year. Perfect for sprint reviews and retrospectives.
🎛️ Smart Slicers
Switch between months or KPI groups instantly. All charts and tables update automatically.
📋 Detailed KPI Table with Icons
View KPI direction (▲ / ▼), target alignment, actual numbers, and YoY comparisons in a clean, easy-to-read table.
📑 Drill-Through KPI Definition Page
Understand KPI formulas, definitions, and units with a single right-click. Great for eliminating confusion across teams.
📦 What’s Inside the Scrum Team KPI Dashboard in Power BI
This dashboard includes three powerful analytical pages:
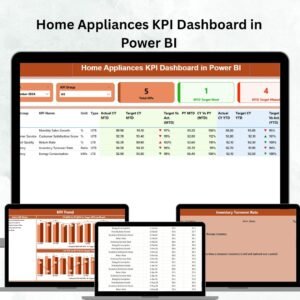
1️⃣ Summary Page — Complete KPI Overview
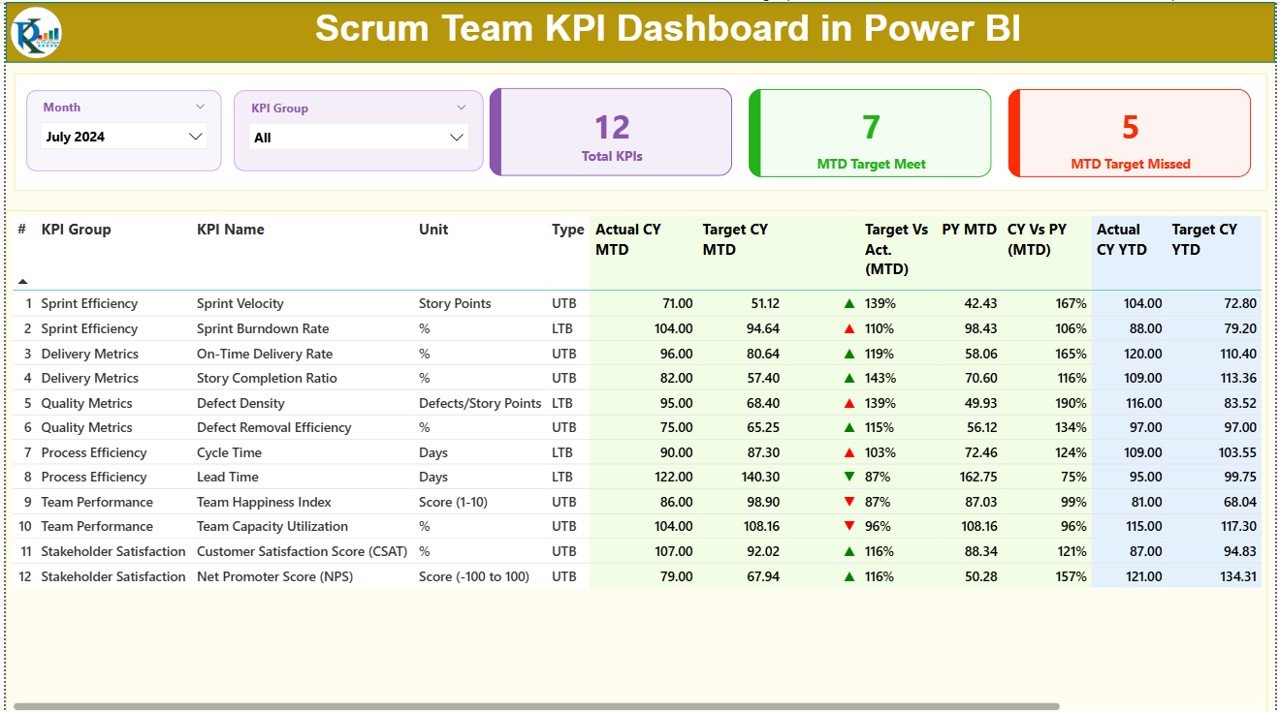
This is the main screen of your dashboard and shows:
-
Month & KPI Group slicers
-
Total KPIs Count
-
MTD Target Met Count
-
MTD Target Missed Count
-
A detailed KPI table with actuals, targets, PY values & directional icons
This page gives instant clarity on overall sprint performance.
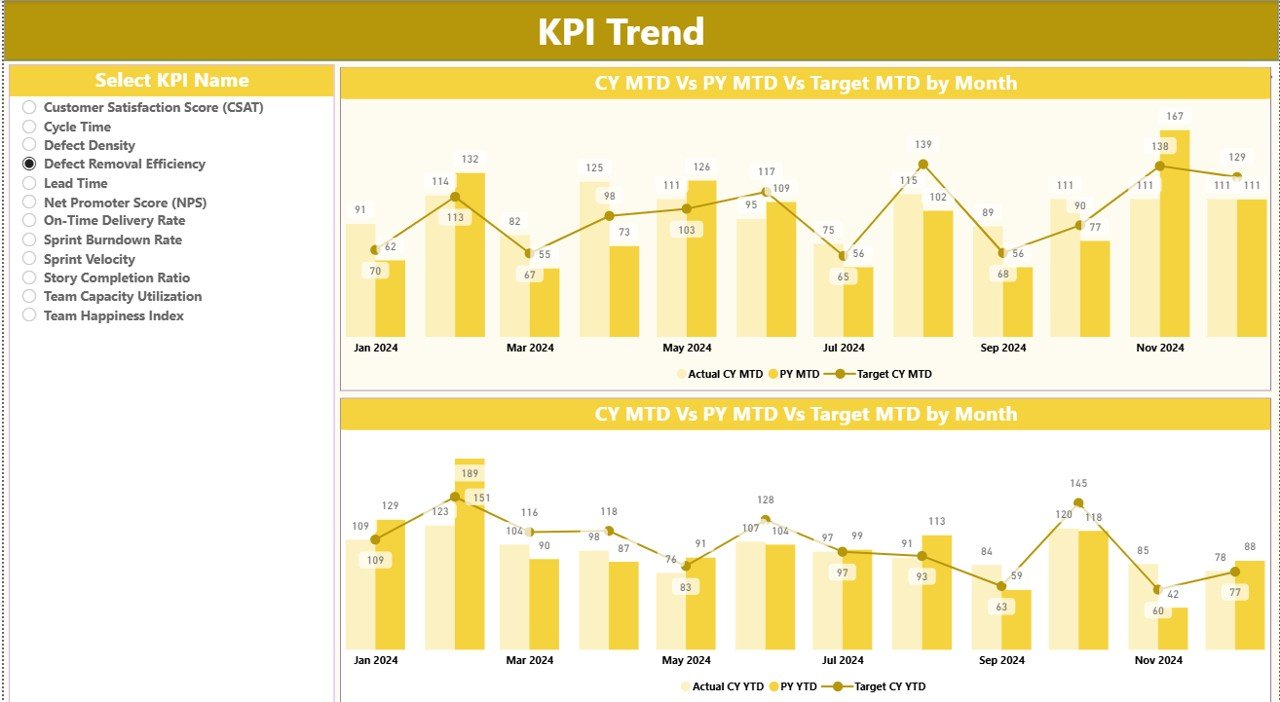
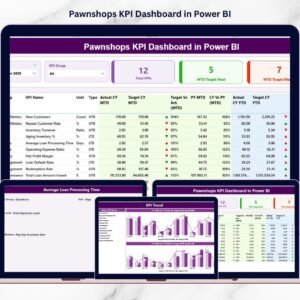
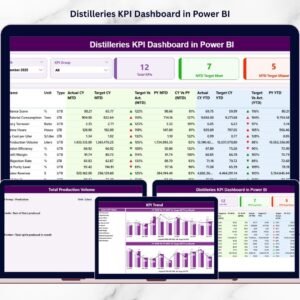
2️⃣ KPI Trend Page — Historical Performance Insights
Analyze how each KPI evolves monthly.
You get:
-
KPI Selection Slicer
-
MTD Combo Chart (Actual CY, Previous Year & Targets)
-
YTD Combo Chart (Actual CY, Previous Year & Targets)
This page is ideal for identifying improvement opportunities and planning future sprints.
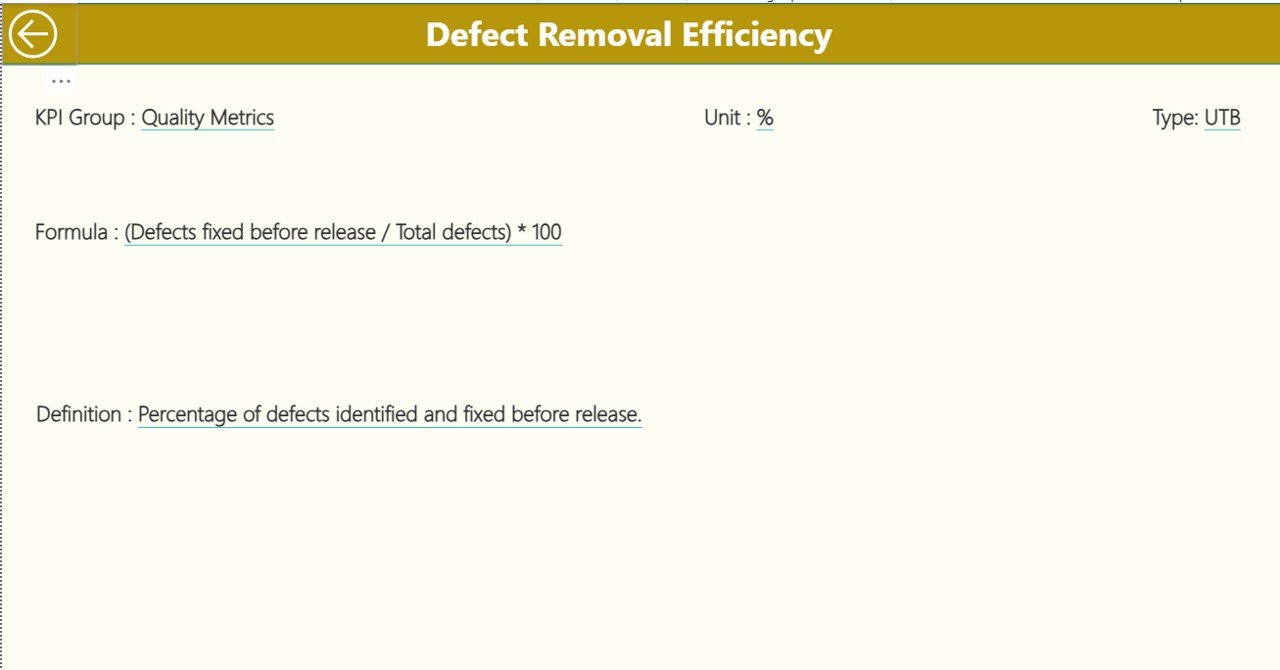
3️⃣ KPI Definition Page — Clear KPI Logic
This drill-through page shows:
-
KPI Number
-
KPI Name
-
Unit
-
Formula
-
Definition
-
Type (LTB or UTB)
This page ensures every team member understands how KPIs are calculated.
🛠️ How to Use the Scrum Team KPI Dashboard in Power BI
Using this dashboard is extremely simple:
1️⃣ Update the Input_Actual sheet (MTD/YTD Actuals).
2️⃣ Update the Input_Target sheet (MTD/YTD Targets).
3️⃣ Maintain KPI details in the KPI Definition sheet.
4️⃣ Refresh Power BI.
5️⃣ Explore KPI trends, icons, comparisons, and YoY insights.
No complex formulas. No coding. Everything is automated. ⚡
🎯 Who Can Benefit from This Scrum Team KPI Dashboard?
This dashboard is ideal for:
-
👨🏫 Scrum Masters
-
👩💻 Software Developers
-
🧪 QA Engineers
-
🧑💼 Product Owners
-
🧭 Agile Coaches
-
🧑💻 Project Managers
-
🏢 Agile PMOs
If you want KPI clarity and faster decision-making, this template is built for you.
### Click here to read the Detailed blog post
Visit our YouTube channel to learn step-by-step video tutorials
👉 Youtube.com/@PKAnExcelExpert


Reviews
There are no reviews yet.