Science & Technology Parks act as innovation engines for startups, research institutions, universities, and technology-driven enterprises. However, as these parks grow, managing data related to funding, revenue, costs, programs, regions, events, and technology sectors becomes increasingly complex. When information stays scattered across spreadsheets, decision-makers lose visibility and valuable insights. This is exactly why the Science & Technology Parks Dashboard in Excel becomes an essential management tool.
This ready-to-use Excel dashboard transforms raw operational and financial data into clear visuals, interactive charts, and KPI cards. It gives park administrators, innovation managers, government bodies, and analysts a single, structured view of performance. With simple slicers and clean navigation, users understand trends instantly and make confident, data-driven decisions without relying on expensive BI tools.
⚡ Key Features of Science & Technology Parks Dashboard in Excel
This dashboard is designed with simplicity, clarity, and performance tracking in mind. It includes five powerful analysis pages supported by a left-side Page Navigator and right-side slicers.
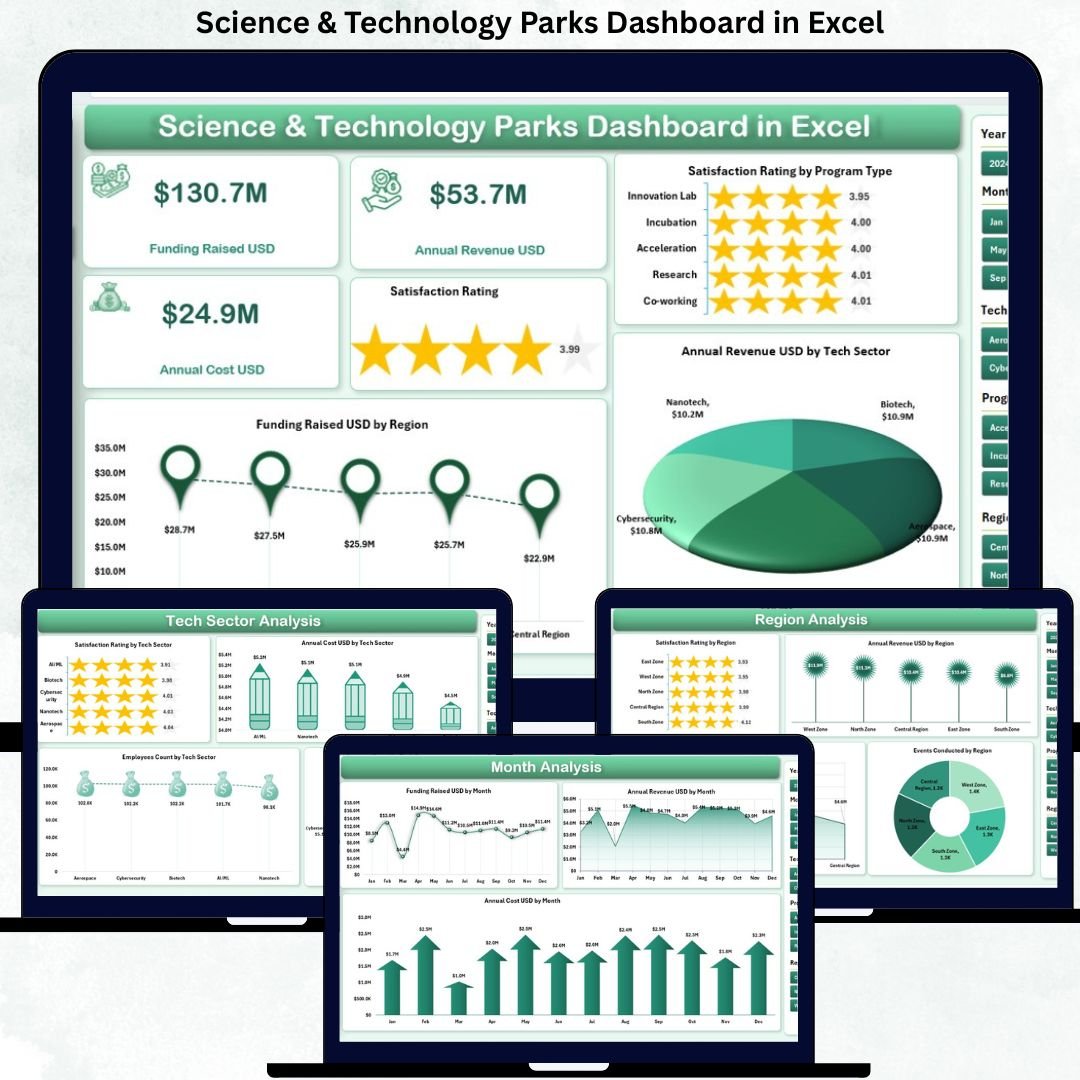
📊 Smart Overview Page
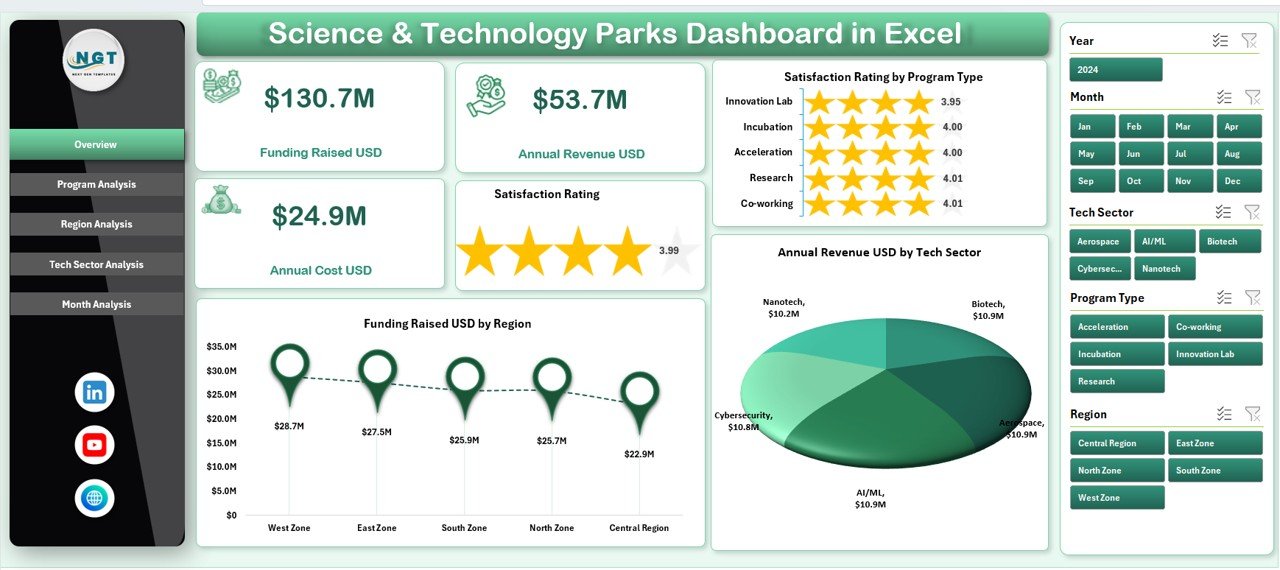
The Overview Page acts as the command center of the dashboard.
It includes:
-
🎛 Right-side slicers to filter data dynamically
-
🧮 5 KPI Cards for instant performance snapshots
-
📈 Key charts, such as:
-
Satisfaction Rating by Program Type
-
Funding Raised (USD) by Region
-
Annual Revenue (USD) by Tech Sector
-
This page helps leadership understand overall park performance in seconds.
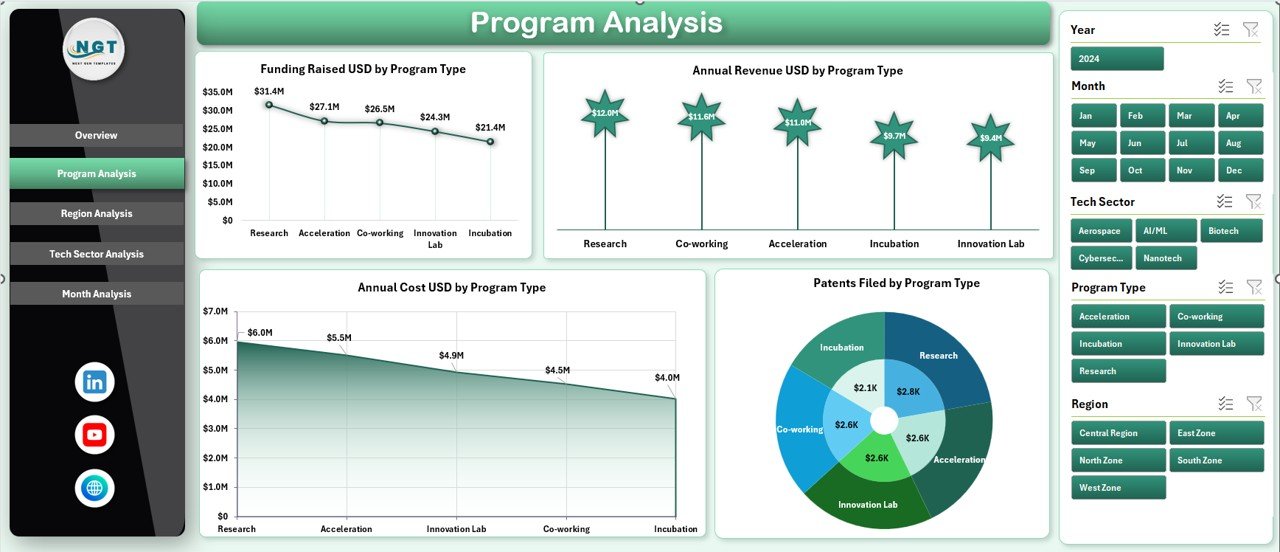
🧩 Program Analysis Page
This page focuses on evaluating different innovation programs run by the park.
It includes charts for:
-
💰 Funding Raised by Program Type
-
📈 Annual Revenue by Program Type
-
💸 Annual Cost by Program Type
-
❌ Retentions Failed by Program Type
Managers use this page to identify high-performing programs, control costs, and improve retention strategies.
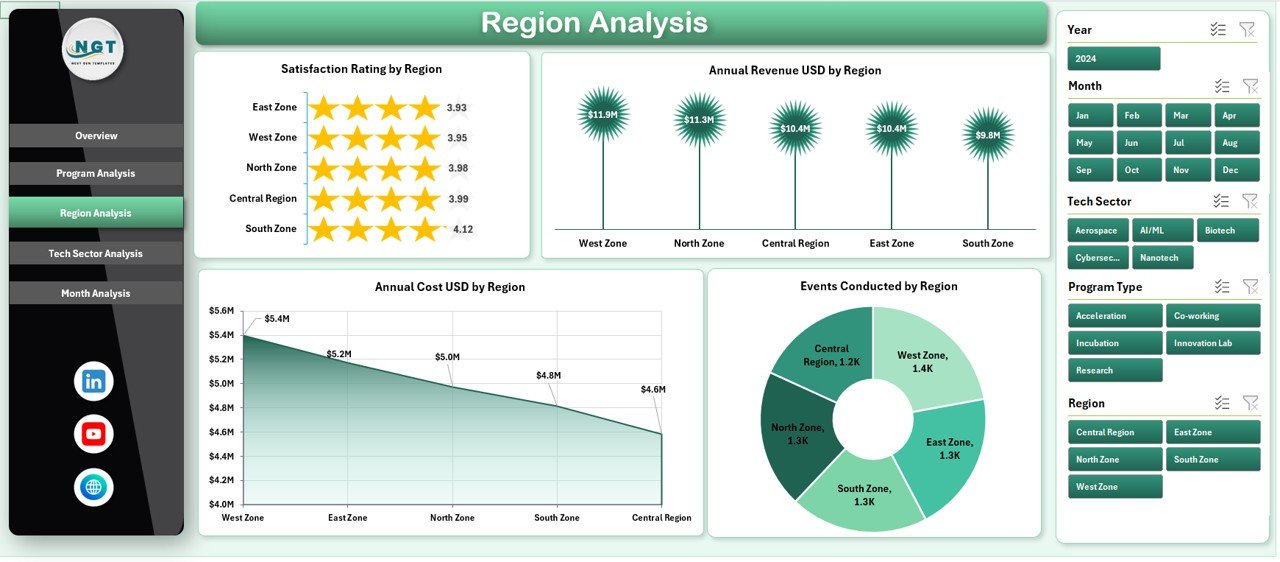
🌍 Region Analysis Page
Science & Technology Parks often operate across multiple regions.
This page shows:
-
⭐ Satisfaction Rating by Region
-
💰 Annual Revenue by Region
-
💸 Annual Cost by Region
-
🎪 Events Conducted by Region
This analysis supports regional planning, expansion decisions, and performance benchmarking.
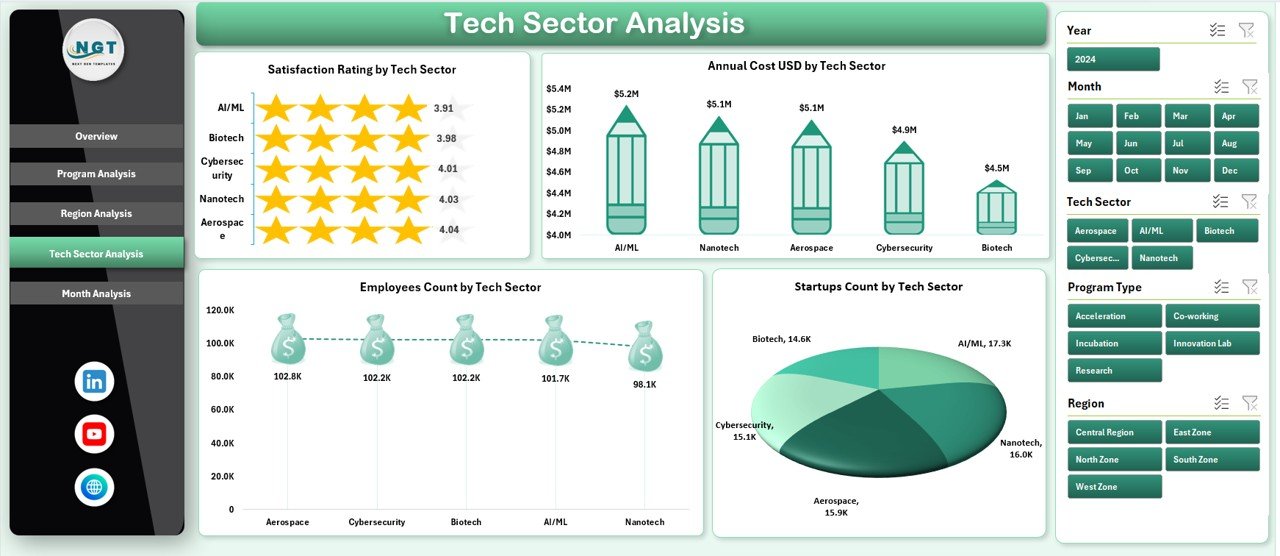
🧠 Tech Sector Analysis Page
Technology parks support multiple sectors such as AI, biotech, fintech, clean energy, and more.
This page includes:
-
⭐ Satisfaction Rating by Tech Sector
-
💸 Annual Cost by Tech Sector
-
🎪 Events Conducted by Tech Sector
-
👥 Employee Count by Tech Sector
This helps decision-makers focus on high-growth sectors and optimize investments.
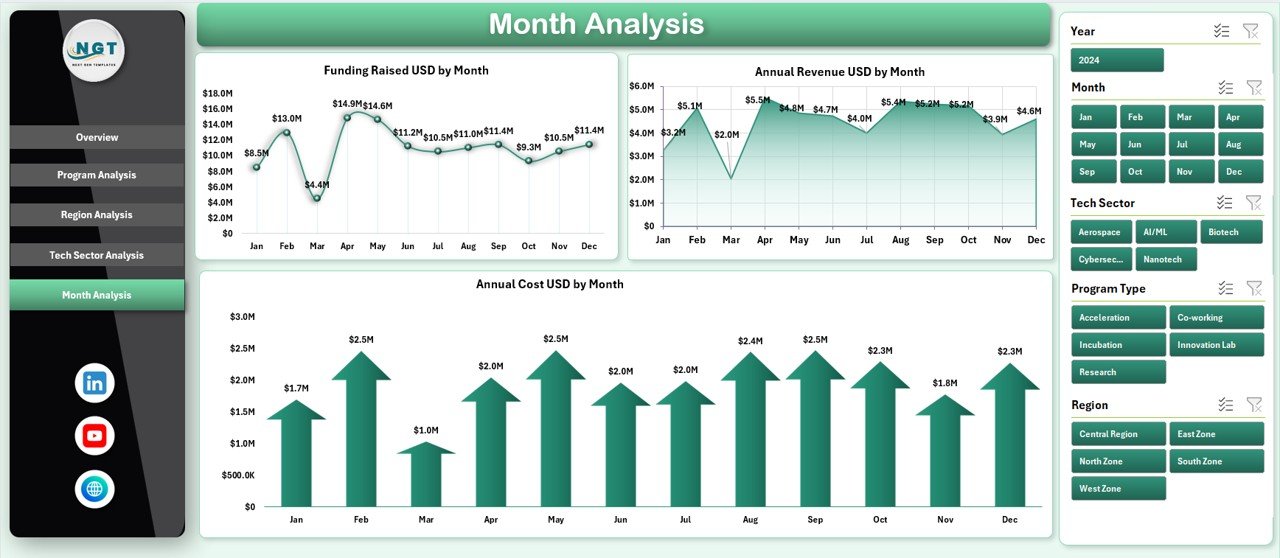
📅 Month Analysis Page
Time-based trends are crucial for forecasting and budgeting.
This page highlights:
-
💰 Funding Raised by Month
-
📈 Annual Revenue by Month
-
💸 Annual Cost by Month
Monthly trends help teams control expenses, plan funding strategies, and improve forecasting accuracy.
📦 What’s Inside the Science & Technology Parks Dashboard in Excel
When you download this product, you receive:
-
📁 A fully automated Excel dashboard file
-
🧭 Left-side Page Navigator for smooth navigation
-
🎛 Dynamic slicers for filtering by program, region, sector, and month
-
📊 KPI cards and interactive charts
-
🧾 Structured Data Sheet for raw inputs
-
🧩 Support Sheet for calculations and lookups
-
⚡ Auto-updating visuals (no manual formula changes)
This dashboard is flexible, scalable, and ready for real-world use.
🧭 How to Use the Science & Technology Parks Dashboard in Excel
1️⃣ Enter or update data in the Data Sheet
2️⃣ Refresh pivot tables (one click)
3️⃣ Use slicers to filter by program, region, sector, or month
4️⃣ Navigate between pages using the Page Navigator
5️⃣ Analyze trends, costs, funding, and satisfaction levels
6️⃣ Use insights for reporting, planning, and presentations
No coding. No Power BI. Just Excel.
👥 Who Can Benefit from This Dashboard?
This dashboard is ideal for:
-
🏢 Science & Technology Park Administrators
-
🚀 Innovation & Incubation Managers
-
🏛 Government & Policy Teams
-
📊 Financial Analysts & Planners
-
🎓 Research & Startup Ecosystems
-
🤝 Accelerators & Incubators
If your goal is clarity, control, and smarter planning—this dashboard delivers.
### Click here to read the Detailed blog post
Visit our YouTube channel to learn step-by-step video tutorials
👉 Youtube.com/@PKAnExcelExpert


Reviews
There are no reviews yet.