

🔑 Key Features of SaaS Financial Model Dashboard in Excel
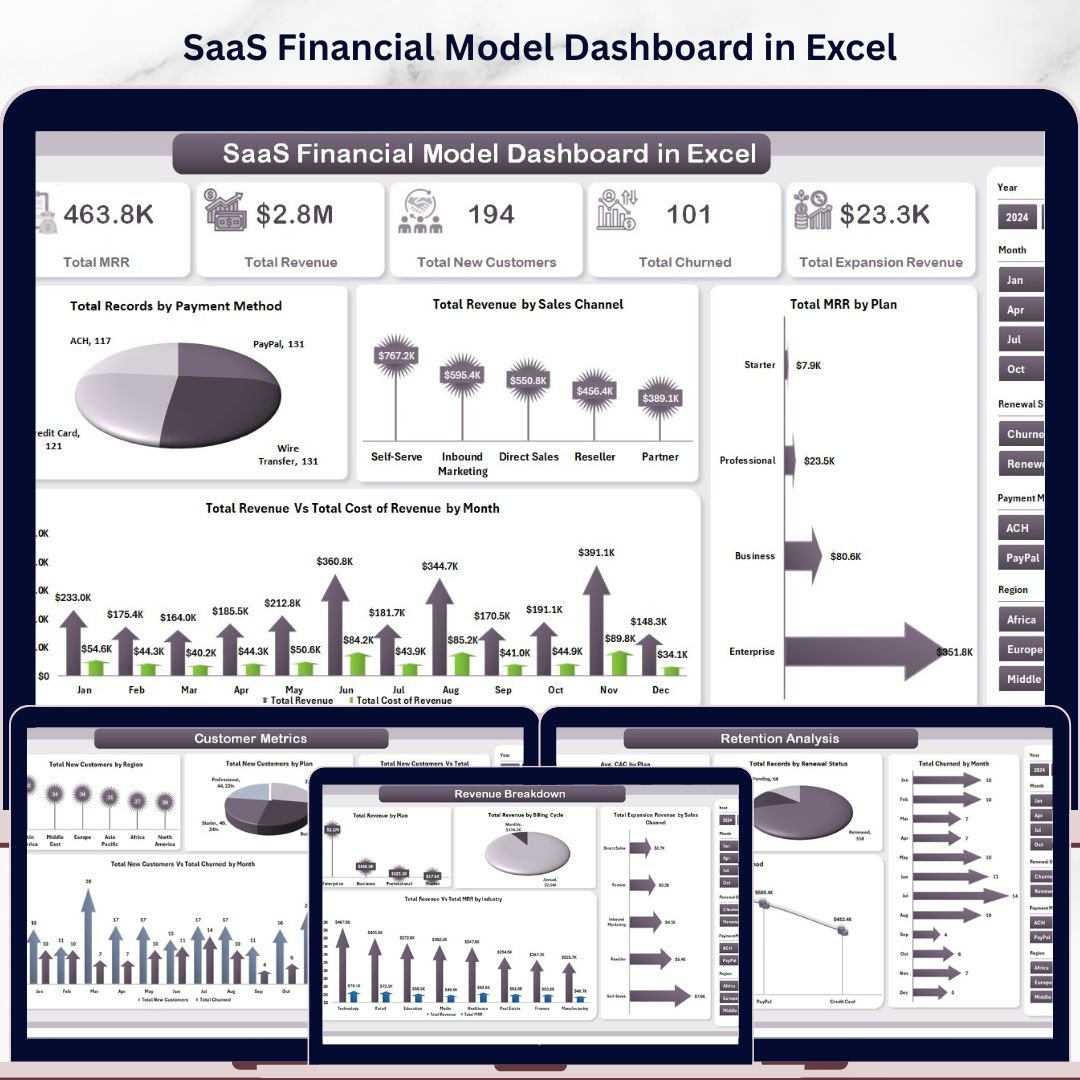
SaaS Financial Model Dashboard in Excel is a professionally designed, interactive financial analytics template built specifically for SaaS founders, CFOs, finance analysts, and subscription business managers who need to track Total MRR, Total Revenue, Total New Customers, Total Churned, and Total Expansion Revenue from a single, powerful Excel dashboard. This template includes 5 interactive dashboard pages covering Overview, Revenue Breakdown, Customer Metrics, Profitability, and Retention Analysis — plus a dedicated Data Sheet and Support Sheet — making it one of the most comprehensive Excel Dashboard Templates available for SaaS financial modeling and subscription business analytics.
Whether you are running a SaaS startup or managing a mature subscription business, this dashboard transforms your raw financial data into stunning, actionable visual insights. If you have been looking for a reliable, data-driven way to monitor MRR growth, analyze churn rates, and evaluate profitability across plans and regions, the SaaS Financial Model Dashboard in Excel is the solution you need. Also explore our SaaS Metrics Dashboard in Excel and Subscription Business Dashboard in Excel for additional SaaS analytics solutions.
📦 What’s Inside the SaaS Financial Model Dashboard in Excel
This Excel dashboard template includes 5 interactive analysis pages, each packed with dynamic charts, slicers, and KPI cards that update automatically when you refresh your data.
📌 Overview Page — The main dashboard displays 5 high-level KPI cards: Total MRR, Total Revenue, Total New Customers, Total Churned, and Total Expansion Revenue. It features 4 dynamic charts showing Total Records by Payment Method, Total Revenue by Sales Channel, Total MRR by Plan, and Total Revenue Vs Total Cost of Revenue by Month. Multiple slicers allow you to filter the entire dashboard instantly by any dimension.
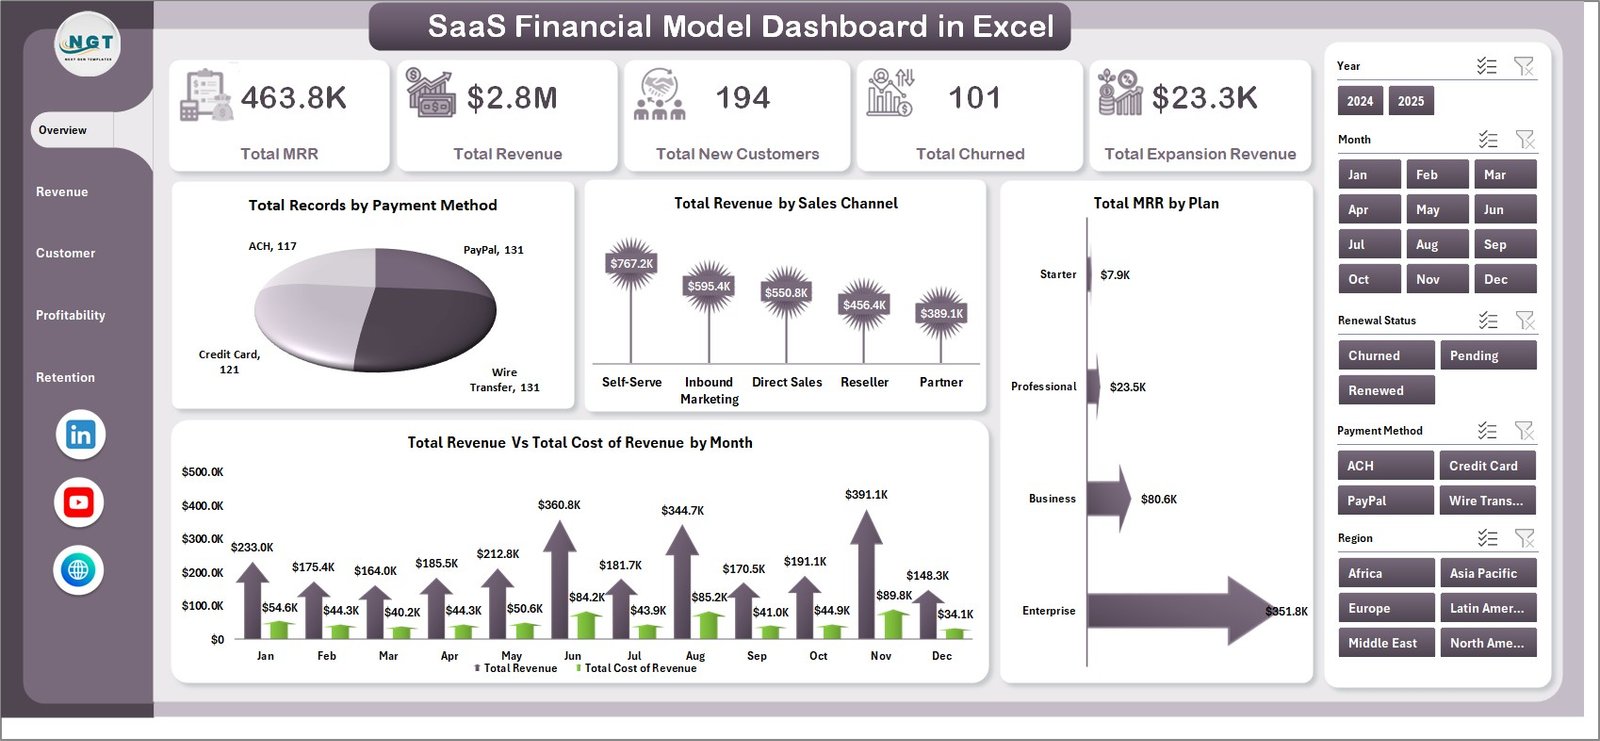 SaaS Financial Model Dashboard in Excel
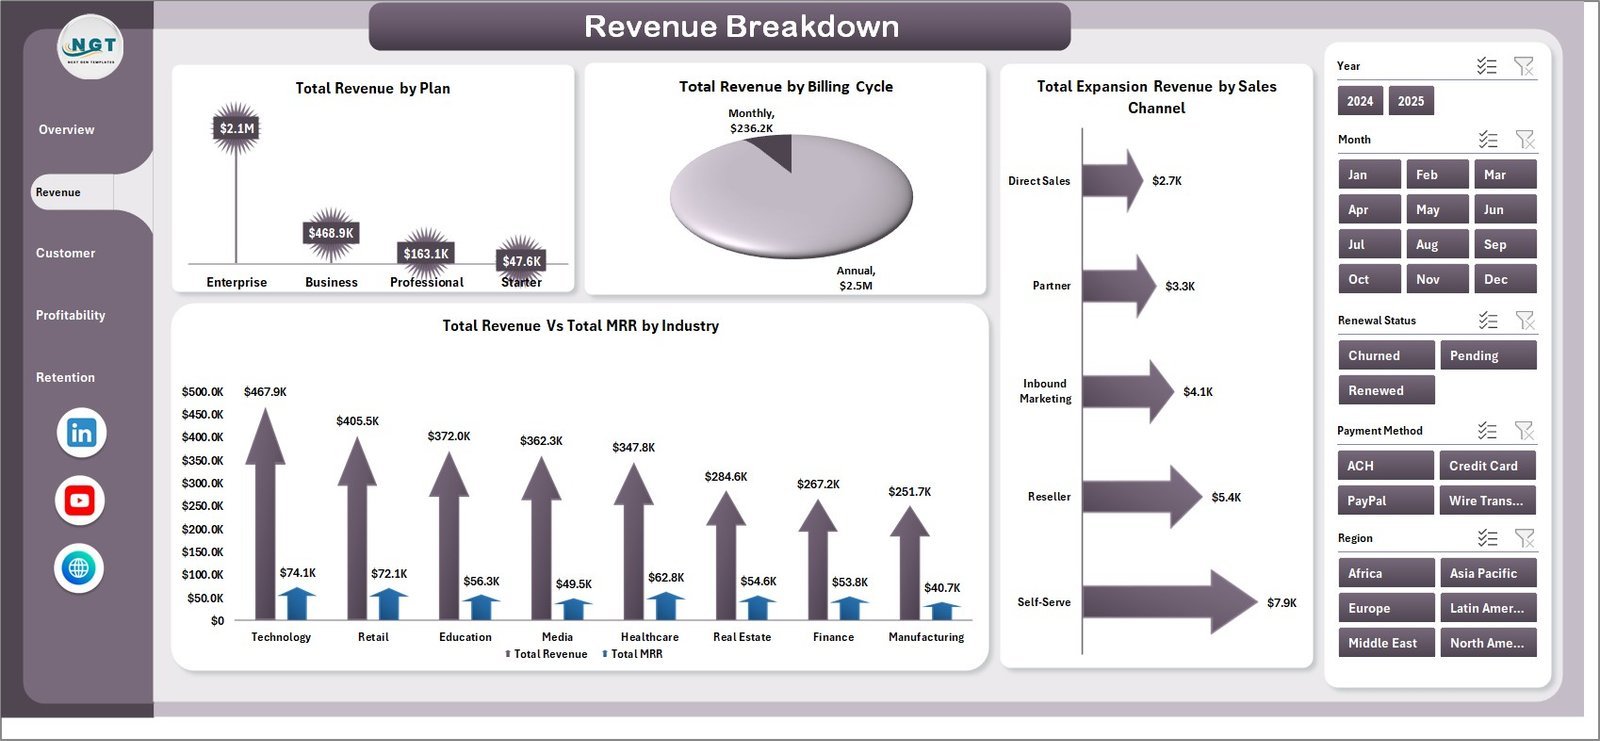
📌 Revenue Breakdown Page — This sheet provides deep revenue analysis with charts for Total Revenue by Plan, Total Revenue by Billing Cycle, Total Expansion Revenue by Sales Channel, and Total Revenue Vs Total MRR by Industry. Understand exactly where your revenue comes from and how it splits across plans, billing cycles, and industries.
 Revenue Breakdown
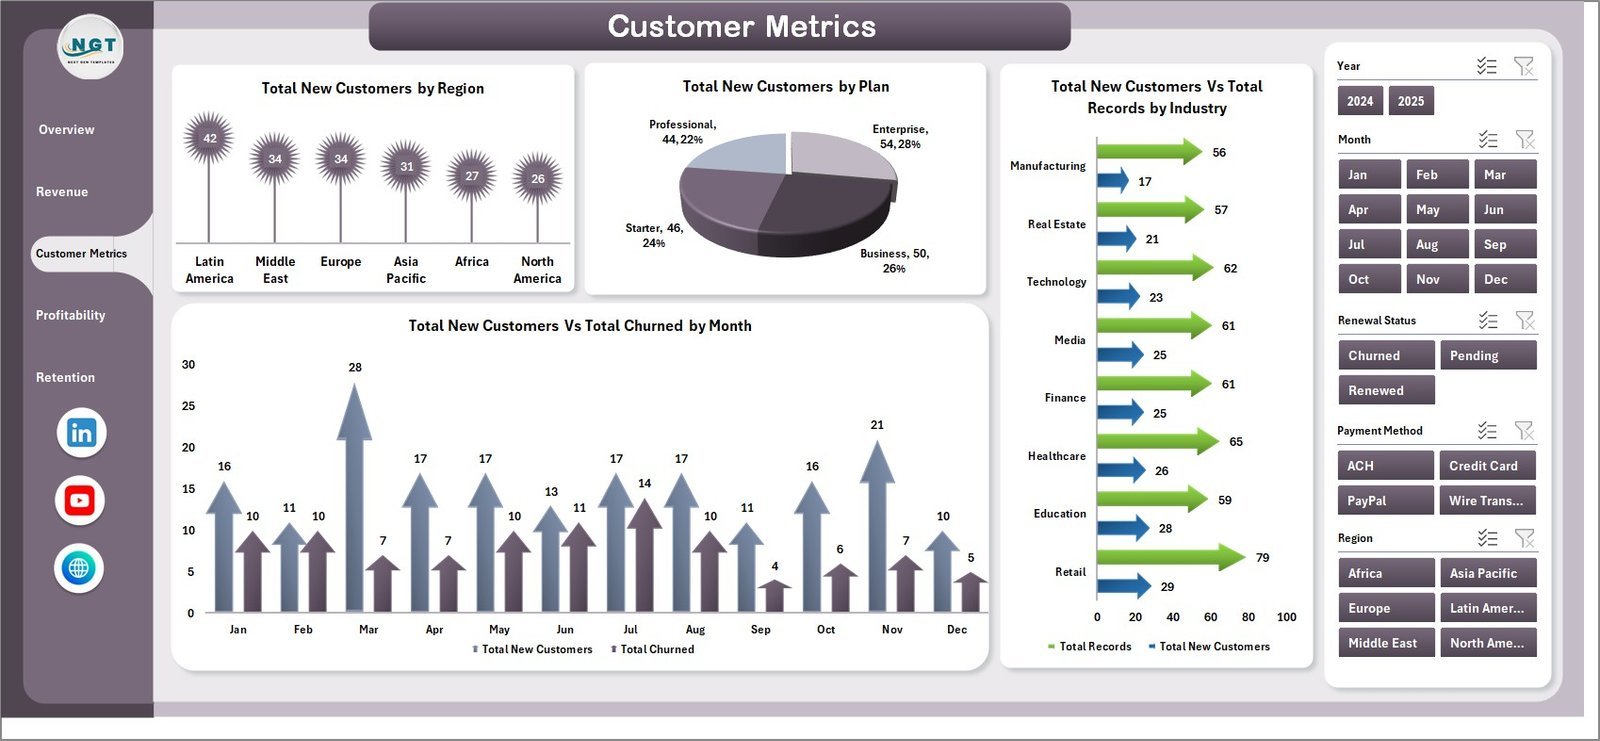
📌 Customer Metrics Page — Analyze customer acquisition and churn trends with charts for Total New Customers by Region, Total New Customers by Plan, Total New Customers Vs Total Records by Industry, and Total New Customers Vs Total Churned by Month. This page helps you identify which regions and plans drive the most growth.
 Customer Metrics
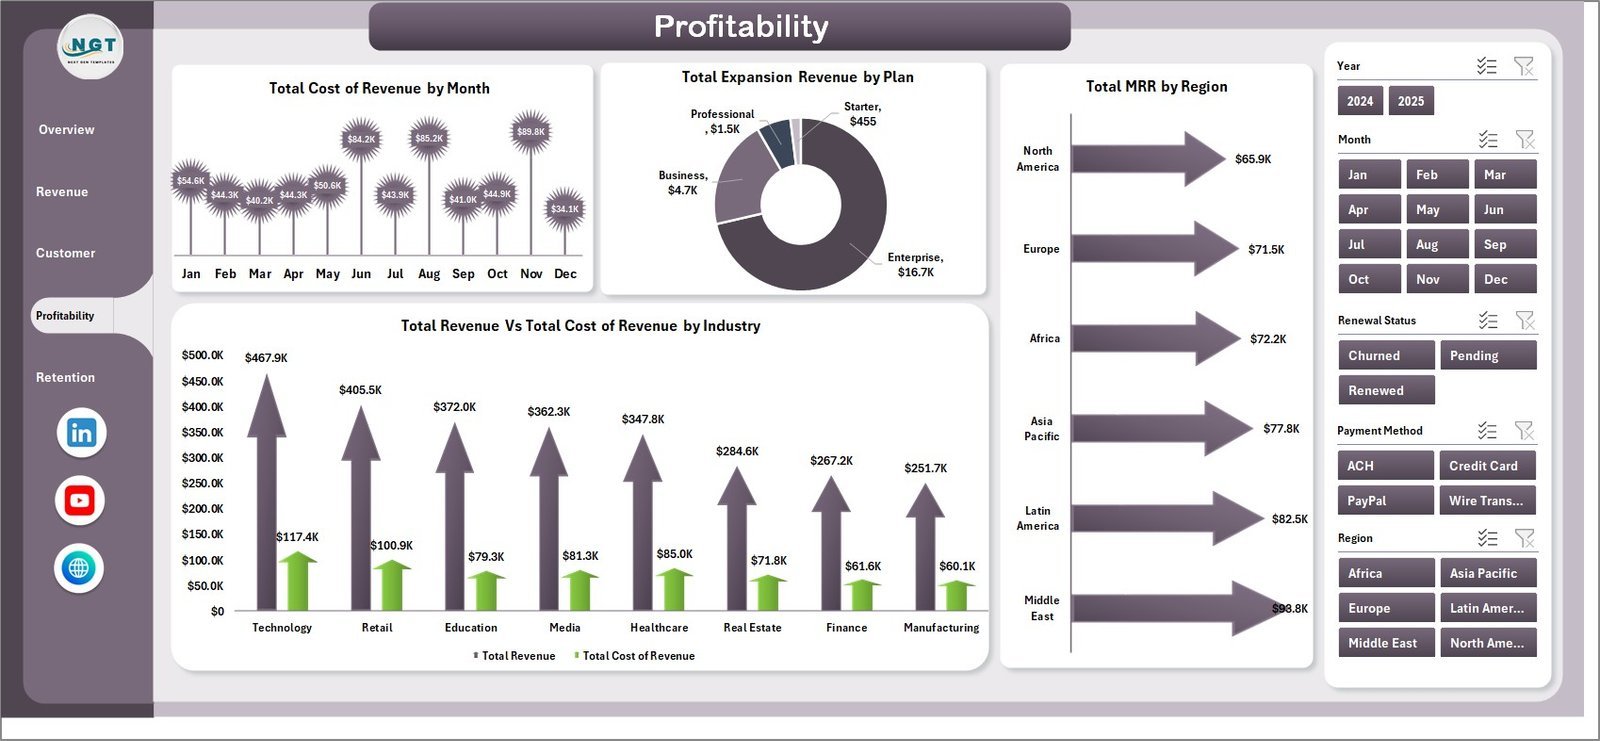
📌 Profitability Page — Evaluate your bottom line with charts for Total Cost of Revenue by Month, Total Expansion Revenue by Plan, Total MRR by Region, and Total Revenue Vs Total Cost of Revenue by Industry. Spot cost overruns and identify your most profitable segments at a glance.
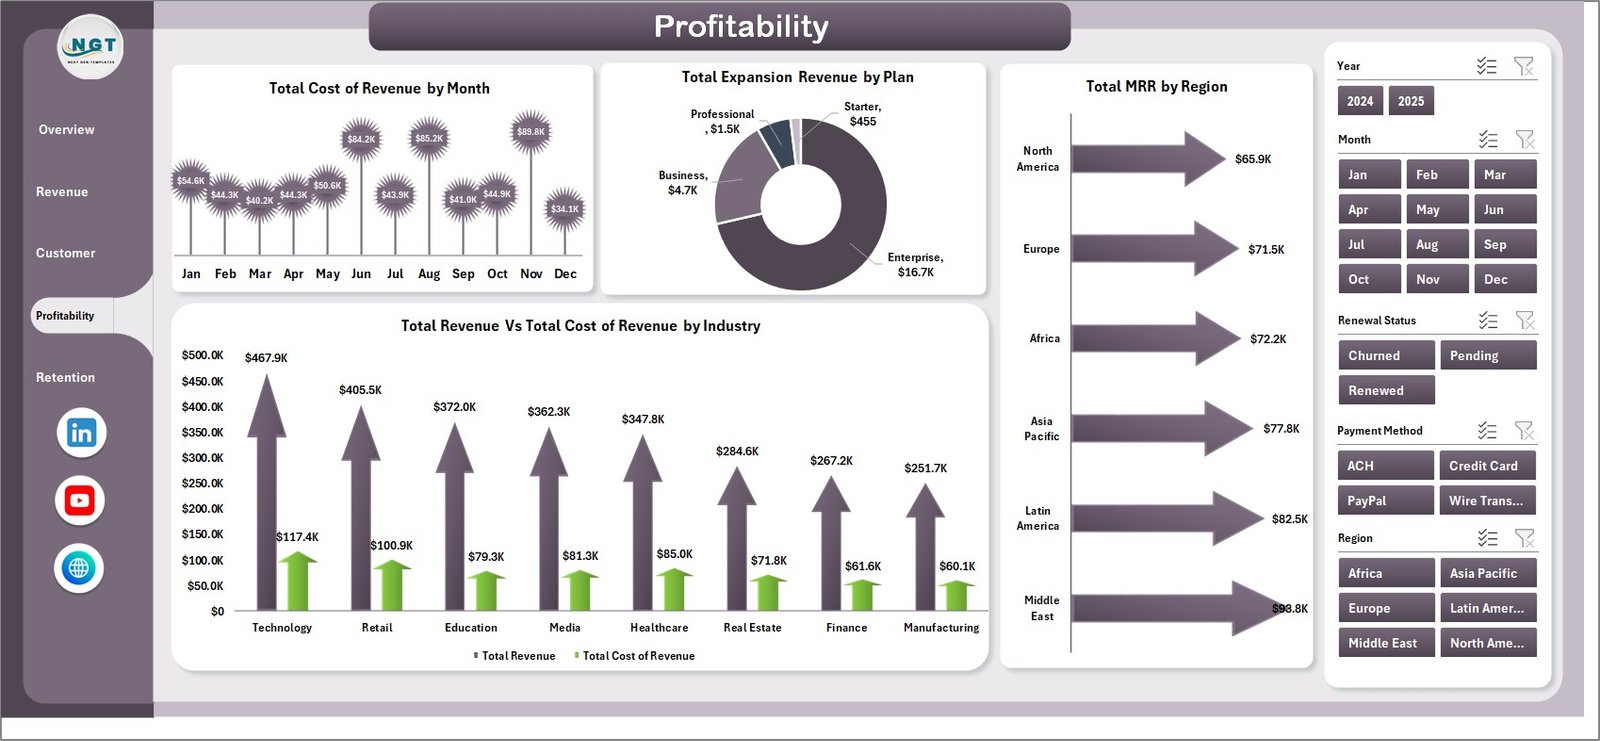 Profitability
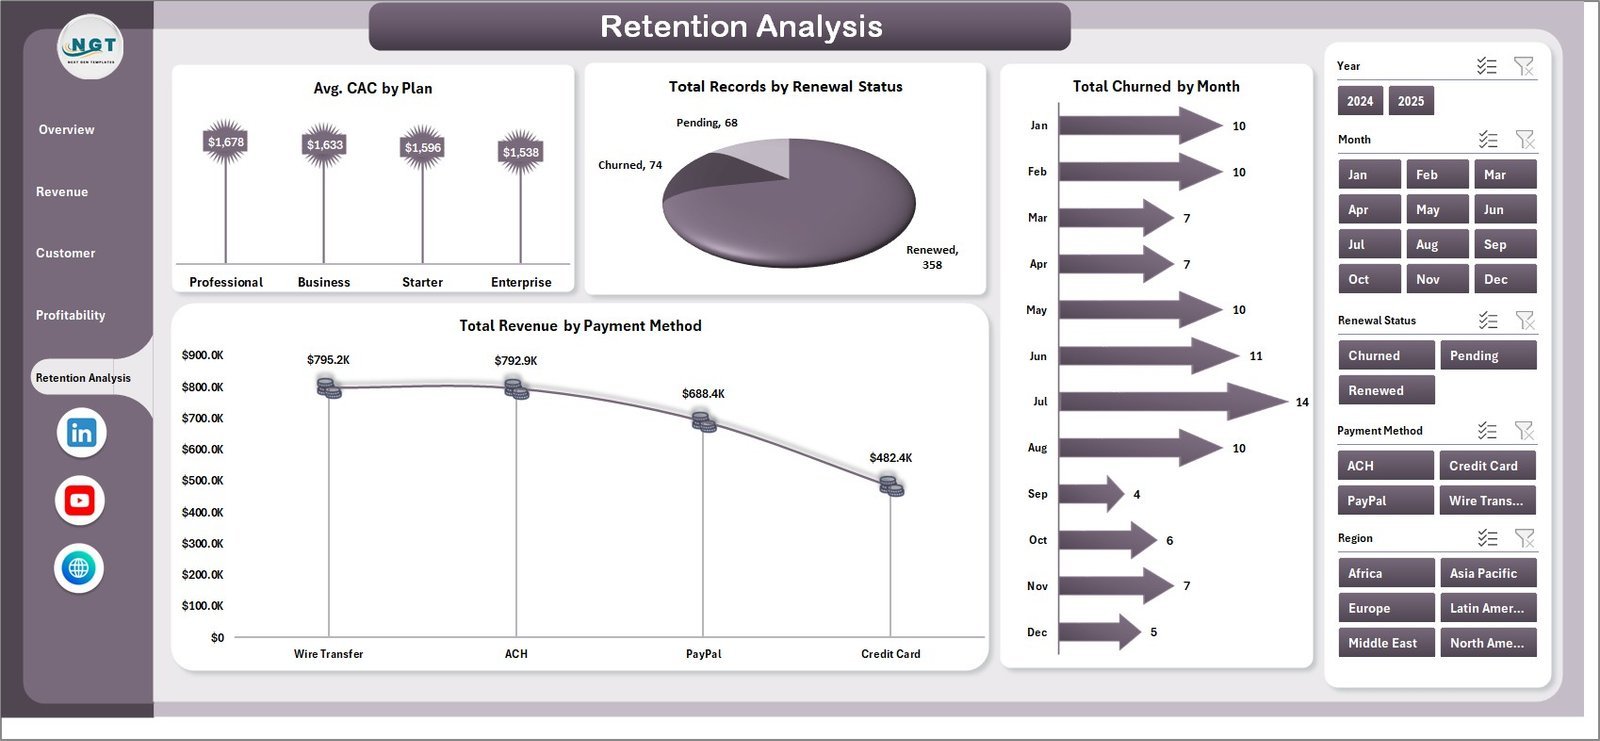
📌 Retention Analysis Page — Monitor customer retention health with charts for Avg. CAC by Plan, Total Records by Renewal Status, Total Churned by Month, and Total Revenue by Payment Method. Understand acquisition costs and retention patterns across your entire customer base.
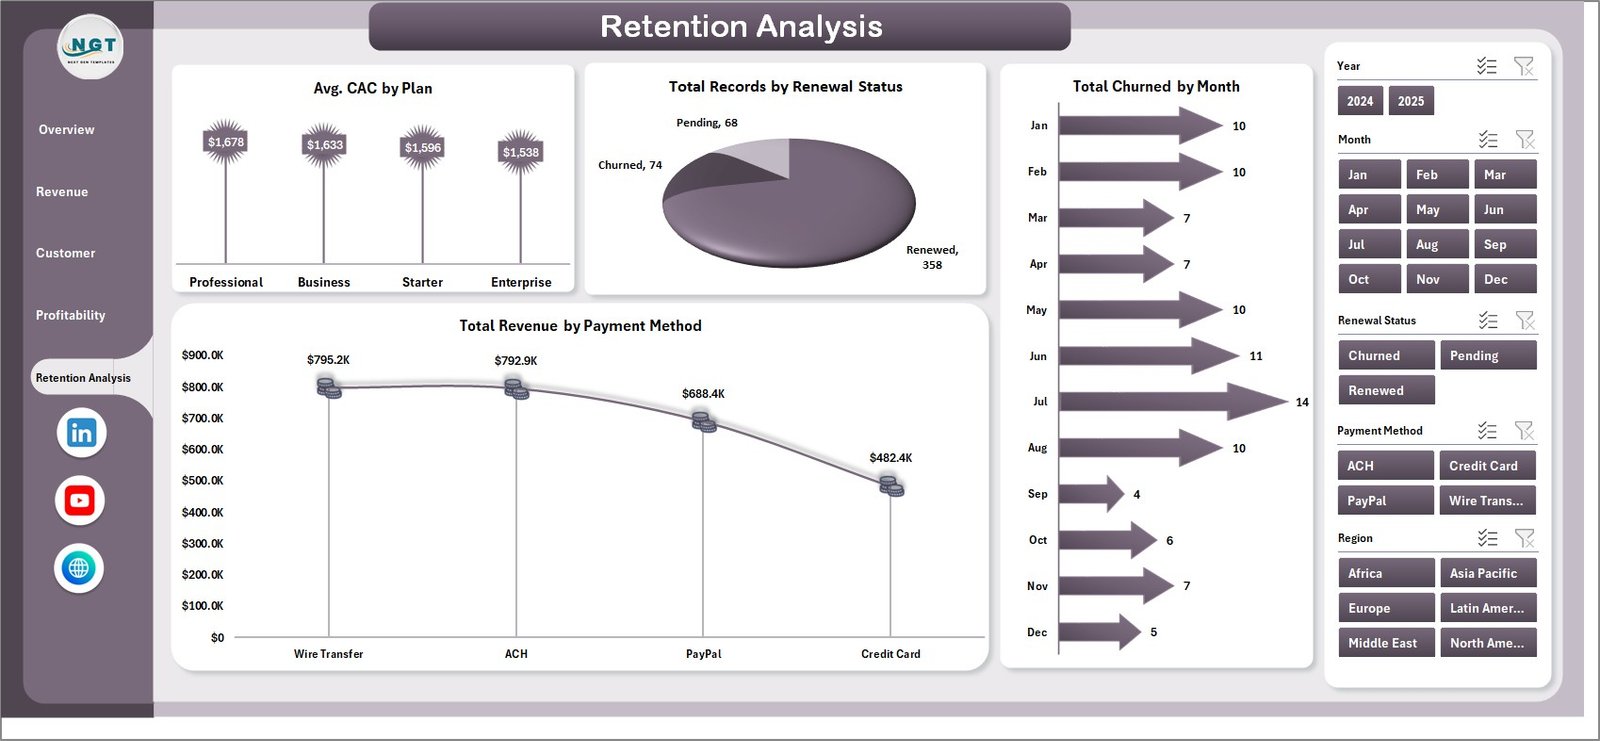 Retention Analysis
📌 Data Sheet — This is where you enter your raw SaaS financial data. Simply replace the sample data with your own records in the same format and all dashboard pages will update automatically after a data refresh.
 Data Sheet Tab
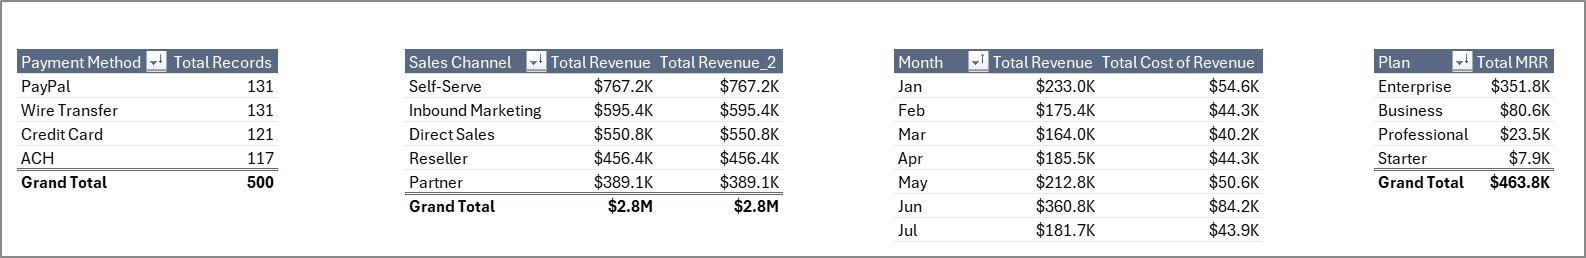
📌 Support Sheet — This hidden sheet contains multiple pivot tables that power the entire dashboard dynamically. Go to the Data tab in the Excel Ribbon and click Refresh All after updating your data — all pivots and charts will refresh automatically. You can keep this sheet hidden during everyday use.
 Support Sheet Tab
⚙️ How to Use the SaaS Financial Model Dashboard in Excel
1️⃣ Download and open the Excel file on your computer using Microsoft Excel (2016 or later recommended).
2️⃣ Navigate to the Data Sheet tab and replace the sample data with your own SaaS financial records — keep the same column structure.
3️⃣ Go to the Data tab in the Excel Ribbon and click “Refresh All” to update all pivot tables and charts across every dashboard page.
4️⃣ Use the slicers on the Overview page to filter the dashboard by any dimension — plan type, region, billing cycle, industry, and more.
5️⃣ Explore the Revenue Breakdown, Customer Metrics, Profitability, and Retention Analysis pages for deep-dive analysis into your SaaS business performance.
👥 Who Can Benefit from This SaaS Financial Model Dashboard in Excel
🔹 SaaS Founders & CEOs — Track MRR, revenue growth, and churn from a single executive dashboard
🔹 CFOs & Finance Managers — Monitor cost of revenue, profitability, and expansion revenue across business segments
🔹 Subscription Business Managers — Analyze billing cycles, renewal statuses, and customer acquisition costs
🔹 Business Analysts — Build financial models with dynamic pivot-driven charts that auto-refresh with new data
🔹 Startup Teams & Investors — Present clean, professional SaaS financial metrics for board meetings and investor updates
❓ Frequently Asked Questions
What KPIs does the SaaS Financial Model Dashboard in Excel track?
The SaaS Financial Model Dashboard in Excel tracks 5 key performance indicators: Total MRR, Total Revenue, Total New Customers, Total Churned, and Total Expansion Revenue. These KPIs are displayed as cards on the Overview page and analyzed across 5 interactive dashboard pages covering revenue breakdown, customer metrics, profitability, and retention analysis.
Do I need advanced Excel skills to use this SaaS financial model template?
No. Simply replace the sample data in the Data Sheet with your own SaaS records and click Refresh All in the Data tab. All pivot tables, charts, and KPI cards update automatically — no formulas or macros to configure.
Can I customize the SaaS Financial Model Dashboard for my specific business?
Yes. The dashboard is fully customizable. You can modify charts, add new KPI cards, change color schemes, and adjust pivot table fields to match your unique SaaS business model and reporting requirements.
What is the best Excel template for tracking SaaS MRR and churn?
The SaaS Financial Model Dashboard in Excel is one of the best templates for tracking MRR, churn, expansion revenue, and customer acquisition costs. It includes dedicated Retention Analysis and Customer Metrics pages with month-over-month trend charts for both MRR and churn.
How many dashboard pages are included in this SaaS Excel template?
This template includes 5 interactive dashboard pages: Overview, Revenue Breakdown, Customer Metrics, Profitability, and Retention Analysis — plus a Data Sheet for your raw data and a Support Sheet with the pivot tables that power all the charts.
Is this template compatible with Google Sheets or LibreOffice?
This template is optimized for Microsoft Excel 2016 and later versions. While it may open in other spreadsheet applications, pivot tables and slicers work best in Microsoft Excel. For a Google Sheets alternative, explore our Google Sheets Dashboard Templates.
🔗 Explore Related Templates
🔹 SaaS Metrics Dashboard in Excel — Track core SaaS metrics like ARR, LTV, and customer growth with interactive Excel charts.
🔹 Subscription Business Dashboard in Excel — Analyze subscription revenue, renewal rates, and billing trends in Excel.
🔹 Small Business CFO Dashboard in Excel — A comprehensive CFO-level financial dashboard for small business owners.
📖 Click here to read the Detailed Blog Post
🎥 Visit our YouTube channel to learn step-by-step video tutorials
👉 YouTube.com/@NextGenTemplates
Watch the step-by-step video tutorial:
YouTube


Reviews
There are no reviews yet.