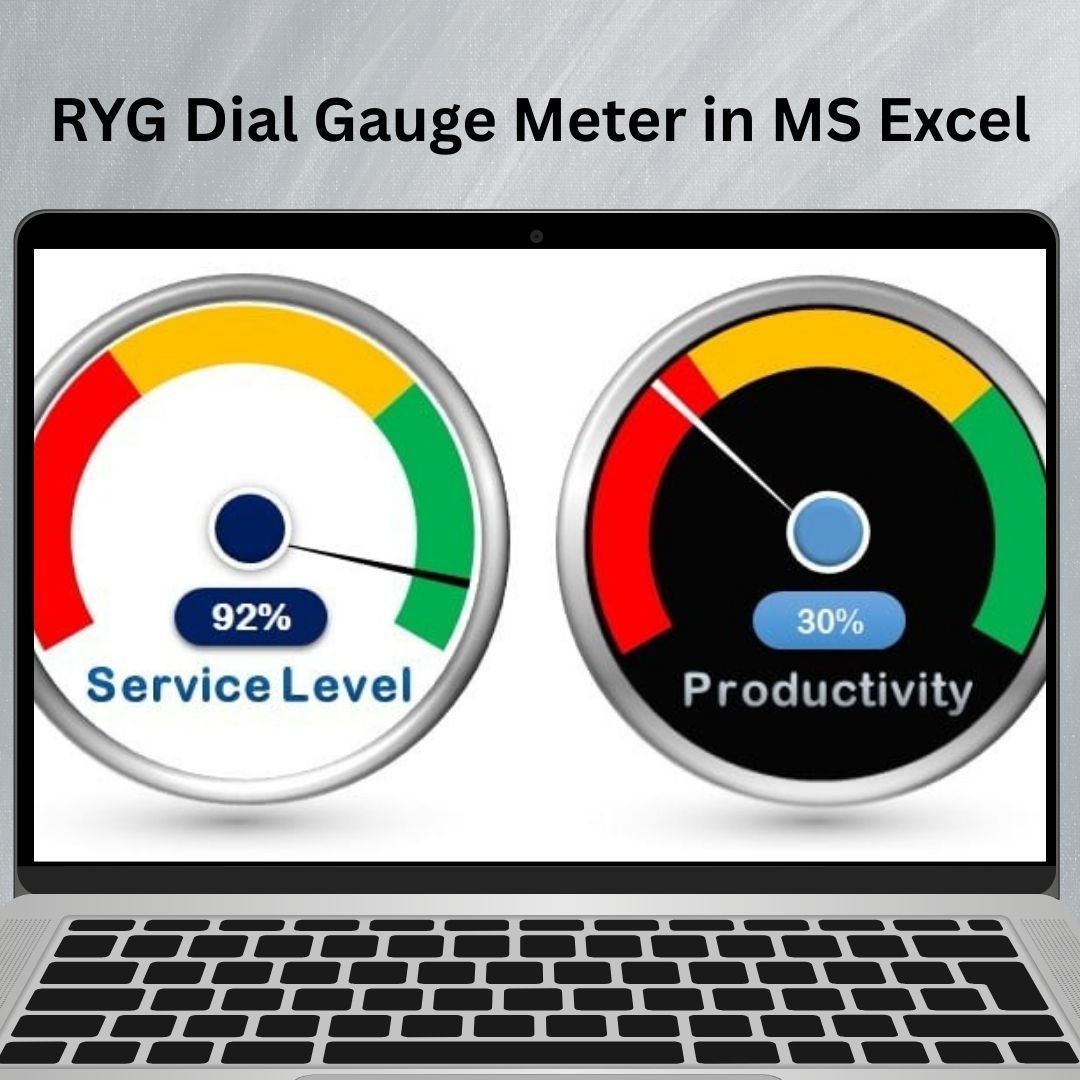
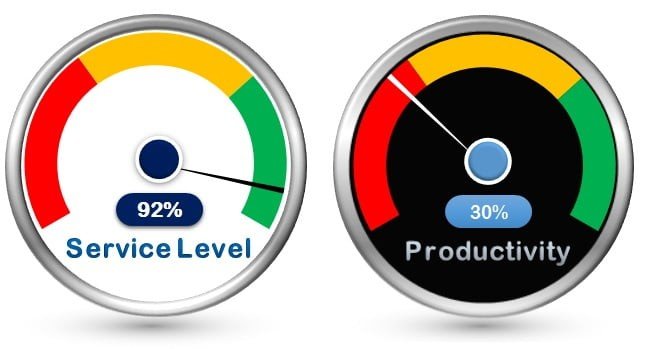
The RYG Dial Gauge Meter in MS Excel is a powerful and visually appealing tool that allows you to track and represent performance metrics using a color-coded dial gauge. Inspired by traffic light colors (Red, Yellow, and Green), this tool makes it easy to visualize performance and progress in a way that’s both engaging and easy to understand. Whether you are tracking sales targets, project milestones, or other KPIs, the RYG Dial Gauge Meter provides a quick and intuitive way to gauge performance at a glance.
With customizable thresholds for each color (Red, Yellow, Green), the RYG Dial Gauge Meter can be tailored to fit your specific needs. The dynamic nature of this tool means that as your data updates, the meter adjusts automatically, providing real-time feedback. This tool is ideal for business analysts, project managers, sales teams, and anyone who needs to visually represent data and track progress toward a goal in Excel.
Key Features of the RYG Dial Gauge Meter in MS Excel
📌 Color-Coded Performance Indicators
The dial gauge uses a simple yet effective color-coding system: Red for underperformance, Yellow for neutral performance, and Green for success. This instantly communicates performance status and helps identify areas that need attention.
🛠 Customizable Thresholds
You can set your own thresholds for when each color appears. For example, you can specify that Red shows when performance is below 50%, Yellow between 50% and 80%, and Green above 80%. This allows you to tailor the gauge to your specific goals and metrics.
💡 Dynamic Updates
As you enter or update your data, the gauge dynamically updates to reflect the latest status. This ensures that you always have real-time visual feedback, keeping you on top of your performance metrics.
🔢 Perfect for KPIs and Targets
The RYG Dial Gauge Meter is ideal for tracking KPIs, sales progress, project milestones, or any other metrics where a quick visual representation is helpful. It’s particularly effective for performance tracking in dashboards, reports, or presentations.
🚀 User-Friendly Setup
Despite its powerful functionality, the RYG Dial Gauge Meter is easy to use and customize. Whether you’re a beginner or advanced Excel user, you can set up the gauge with just a few simple steps.
📊 Professional and Engaging Design
This tool offers a professional and visually engaging design that enhances your reports, dashboards, and presentations. It’s perfect for business meetings, project reviews, or any setting where you need to communicate data effectively.
⚙ Why You’ll Love the RYG Dial Gauge Meter in MS Excel
✅ Instant Performance Visualization – Quickly see how performance stacks up with color-coded indicators. ✅ Customizable – Tailor the thresholds and colors to match your specific data. ✅ Real-Time Data Updates – The gauge automatically adjusts as data changes. ✅ Perfect for Dashboards – Ideal for adding visual appeal to performance reports and presentations. ✅ Simple Setup – Easy to use with clear instructions for beginners and advanced users alike.
📂 What’s Inside the RYG Dial Gauge Meter in MS Excel?
- Color-Coded Dial Gauge: A dynamic meter with Red, Yellow, and Green to represent different performance levels.
- Customizable Thresholds: Set your own values for when each color should appear.
- Real-Time Updates: The gauge updates automatically as your data changes.
- Step-by-Step Setup Instructions: Clear instructions for setting up and customizing the meter.
🔍 How to Use the RYG Dial Gauge Meter in MS Excel
1️⃣ Download the Template – Instant access to the Excel file upon purchase. 2️⃣ Enter Your Data – Input your performance data into the chart. 3️⃣ Set Your Thresholds – Define the values that trigger Red, Yellow, and Green. 4️⃣ Track Performance – Watch as the gauge updates dynamically as you change your data. 5️⃣ Present and Share – Use the gauge in reports, presentations, or dashboards to visually communicate progress.
🎯 Who Can Benefit from the RYG Dial Gauge Meter in MS Excel? 🔹 Business Analysts
🔹 Sales Managers
🔹 Project Managers
🔹 Marketing Teams
🔹 Financial Analysts
🔹 Anyone who needs to visually track performance against a target or KPI
The RYG Dial Gauge Meter in MS Excel is an excellent tool for visualizing performance metrics and tracking progress toward goals. With its color-coded system and real-time updates, it makes it easier to see how your data is performing at a glance.
Click here to read the Detailed blog post
https://www.pk-anexcelexpert.com/ryg-dial-gauge-meter-in-ms-excel/


Reviews
There are no reviews yet.