


Robotics departments are the backbone of modern automation. From manufacturing floors and warehouses to healthcare labs and research centers, robotics teams manage uptime, maintenance, safety, and project delivery every day. Robotics Departments KPI Dashboard in Excel However, when performance data lives in scattered spreadsheets or manual reports, downtime increases, issues go unnoticed, and improvement slows down.
Robotics Departments KPI Dashboard in ExcelThat is exactly why the Robotics Departments KPI Dashboard in Excel is a powerful performance management solution 🚀.
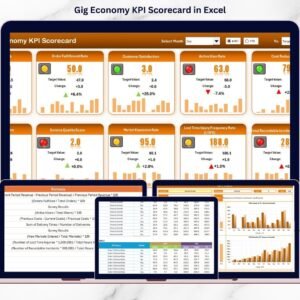
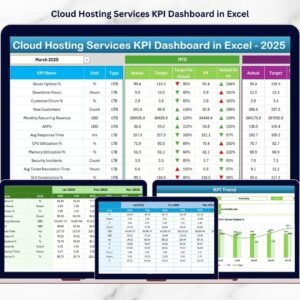
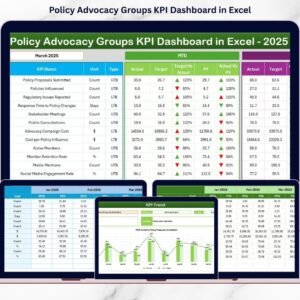
This ready-to-use Excel dashboard transforms complex robotics data into clear KPIs, instant comparisons, and trend-based insights, enabling teams to monitor performance, reduce failures, and improve operational efficiency.
Designed for robotics managers, automation engineers, operations leaders, and executives, this dashboard helps you track MTD and YTD performance, compare targets vs actuals, analyze trends, and maintain KPI governance—all inside Excel, without complex software or BI tools.
🔑 Key Features of Robotics Departments KPI Dashboard in Excel
📊 Centralized Robotics KPI Tracking
Monitor uptime, maintenance, efficiency, safety, and project KPIs in one dashboard.
📅 Dynamic Month Selection
Select any month from a drop-down and instantly refresh all KPIs.
🎯 Target vs Actual Performance Analysis
Identify missed targets and improvement areas at a glance.
📈 MTD & YTD Performance Monitoring
Track short-term execution and long-term robotics performance together.
🔁 Current Year vs Previous Year Comparison
Measure improvement or decline using YoY performance analysis.
📉 KPI-Wise Trend Analysis
Analyze patterns using dedicated MTD and YTD trend charts.
📘 Strong KPI Governance
Built-in KPI groups, units, formulas, and definitions ensure consistency.
⚡ 100% Excel-Based & Easy to Use
No BI tools required—simple, flexible, and business-ready.
What’s Inside the Robotics Departments KPI Dashboard in Excel

🏠 Home Sheet
A clean navigation page with six buttons for one-click access to all worksheets.
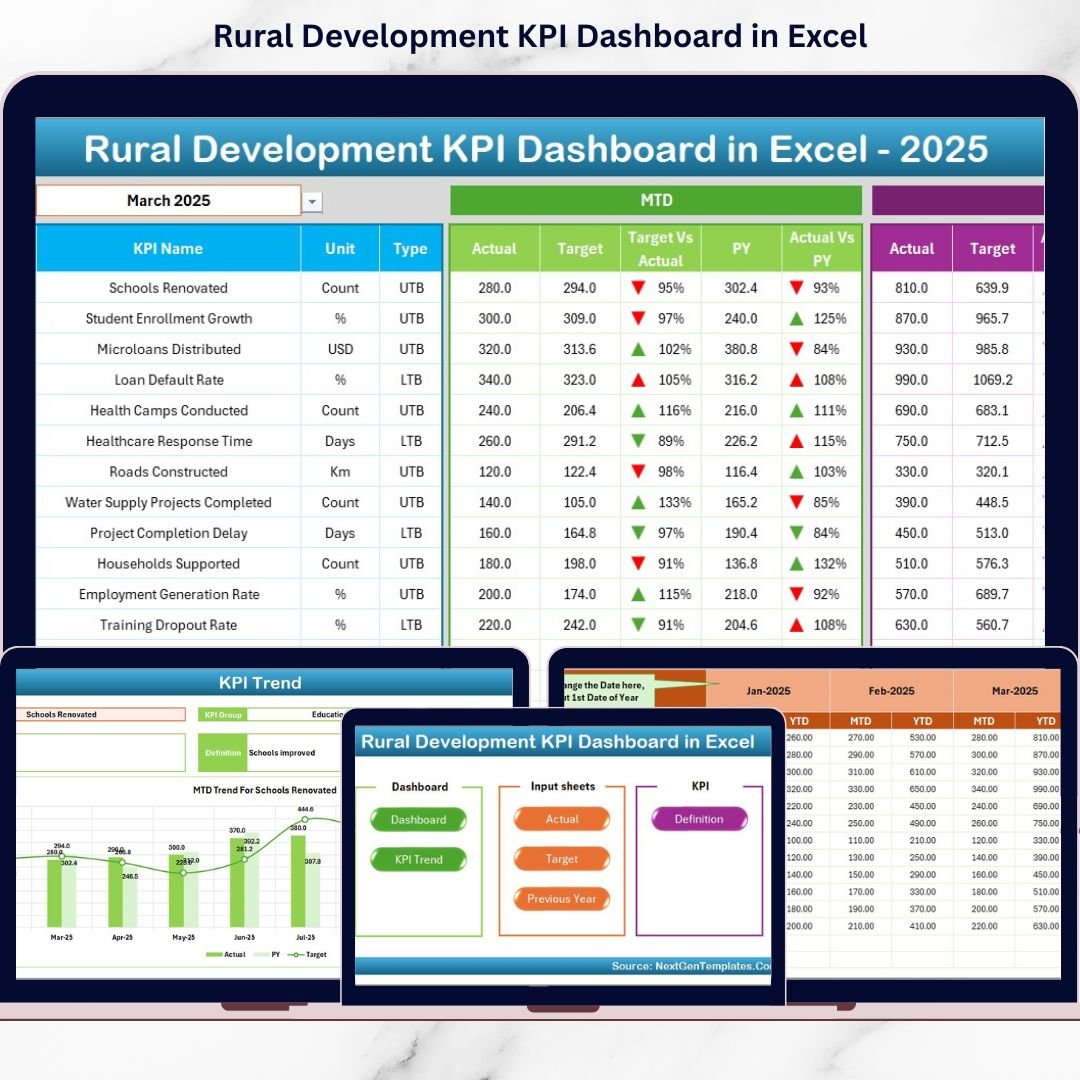
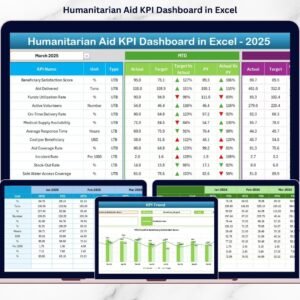
📊 Dashboard Sheet
The main performance overview displaying MTD and YTD actuals, targets, previous year values, achievement percentages, and visual ▲ / ▼ indicators.
📈 KPI Trend Sheet
Select any KPI and instantly view its MTD and YTD trends along with KPI details.
📥 Actual Numbers Input Sheet
Enter real robotics performance data in a structured format.
🎯 Target Sheet
Define monthly and yearly targets aligned with robotics goals.
📅 Previous Year Number Sheet
Store historical data to support meaningful year-over-year comparisons.
📘 KPI Definition Sheet
Maintain KPI name, group, unit, formula, and definition to ensure clarity.
⚙️ How to Use the Robotics Departments KPI Dashboard in Excel
📝 Step 1: Enter Actual Data
Update MTD and YTD values in the Actual Numbers Input Sheet.
📅 Step 2: Select Month
Choose a month from cell D3 to instantly update the dashboard.
📊 Step 3: Review KPI Status
Use arrows, percentages, and comparisons to identify issues quickly.
📈 Step 4: Analyze Trends
Study KPI-wise trend charts to understand long-term performance.
🎯 Step 5: Take Action
Improve uptime, reduce failures, and optimize robotics operations.
👥 Who Can Benefit from This Robotics Departments KPI Dashboard in Excel
🤖 Robotics Managers – Monitor uptime, maintenance, and delivery KPIs
🛠️ Automation Engineers – Analyze efficiency and failure trends
🏭 Operations Leaders – Track productivity and cost control
📊 Quality & Safety Teams – Monitor defects and safety indicators
🏢 Executives & Leadership – Gain instant visibility into robotics performance
🔍 Click here to read the Detailed blog post
📺 Visit our YouTube channel to learn step-by-step video tutorials
👉 Youtube.com/@PKAnExcelExpert


Reviews
There are no reviews yet.