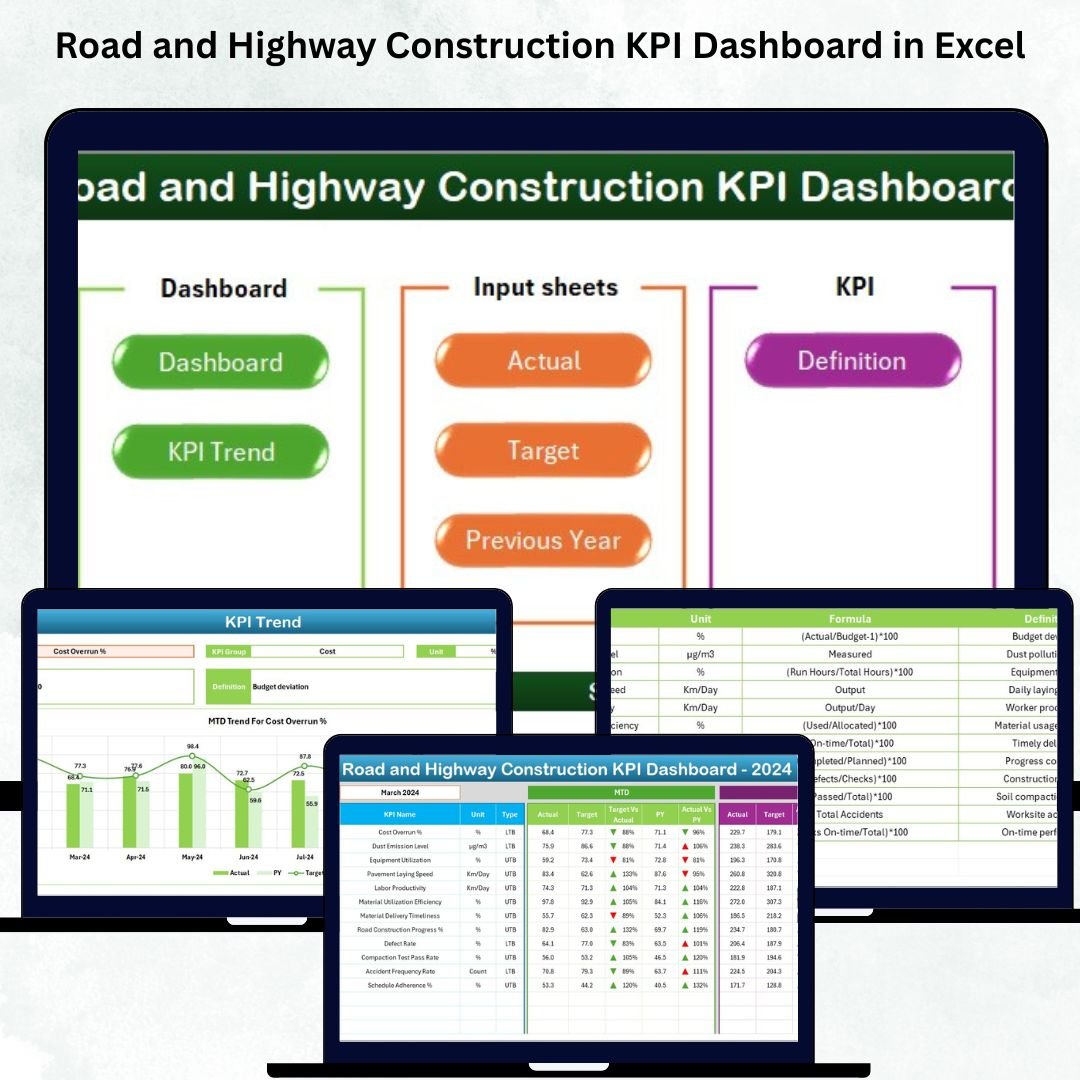
Road and Highway Construction KPI Dashboard in Excel Managing a road or highway construction project requires high visibility, strong coordination, and complete control over performance. Every day, you track hundreds of data points—material usage, safety metrics, project timelines, equipment efficiency, labor productivity, budget utilization, delays, and more. Road and Highway Construction KPI Dashboard in Excel When this information is scattered across Excel files, paper logs, and manual reports, you lose clarity. Delays go unnoticed, decision-making slows down, and project efficiency drops.
The Road and Highway Construction KPI Dashboard in Excel solves these challenges instantly. It brings every important project KPI into one interactive, visual, and easy-to-use dashboard. You can compare Month-to-Date (MTD) and Year-to-Date (YTD) performance, check Actual vs Target results, and analyze Previous Year (PY) trends within seconds. With automated charts, clear indicators, and structured Excel input sheets, this dashboard becomes your complete project monitoring system.
Whether you are a contractor, project manager, government agency, consultant, or engineering team, this dashboard gives you the clarity you need to deliver road projects on time, within budget, and with high quality.
🚀 Key Features of the Road & Highway Construction KPI Dashboard in Excel
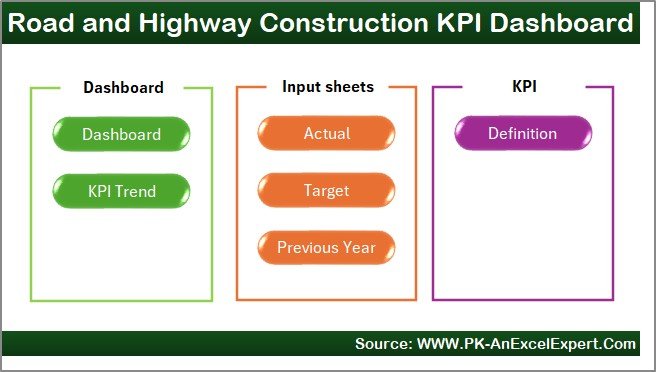
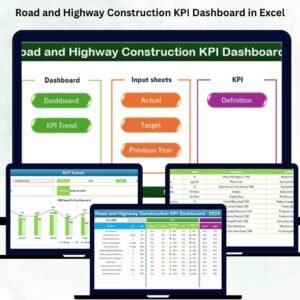
🏠 Home Sheet – Smooth Navigation for All Users
The Home Sheet works as the index page. It includes clickable buttons that take you to:
-
Dashboard
-
KPI Trend
-
Actual Numbers
-
Target Numbers
-
Previous Year Numbers
-
KPI Definition
Even users with basic Excel knowledge can navigate the entire system effortlessly.
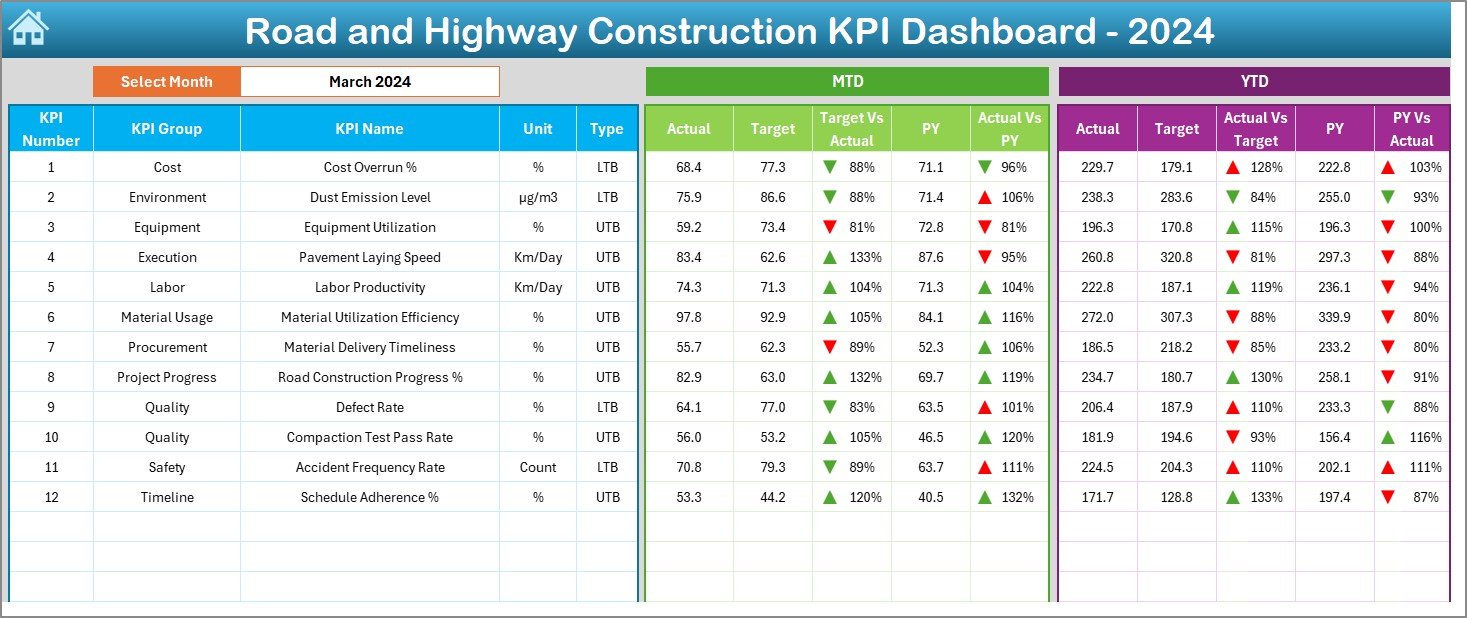
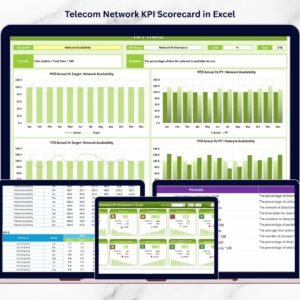
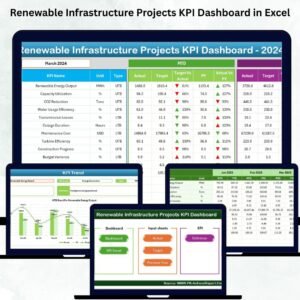
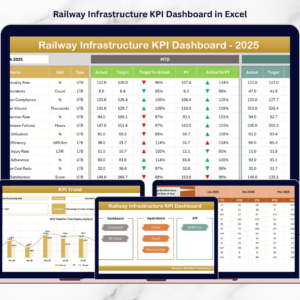
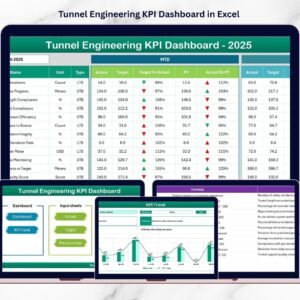
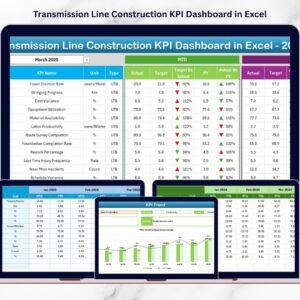
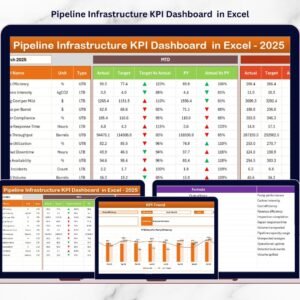
📊 Dashboard Sheet – Complete Construction KPI Overview
This is the main page where all KPI results appear. With a simple month selection (Cell D3), the entire dashboard refreshes instantly.
You get a full breakdown of:
📅 MTD Section (Month-to-Date):
-
Actual MTD Value
-
MTD Target
-
MTD Previous Year
-
Target vs Actual (MTD %)
-
PY vs Actual (MTD %)
-
Performance Icons:
-
🟩 ▲ Up = Good performance
-
🟥 ▼ Down = Needs improvement
-
📆 YTD Section (Year-to-Date):
-
Actual YTD
-
YTD Target
-
YTD Previous Year
-
Target vs Actual (YTD %)
-
PY vs Actual (YTD %)
These insights help project managers and senior engineers see progress instantly across all construction KPIs.
This dashboard becomes the single source of truth for:
-
Project Directors
-
Site Engineers
-
Consultants
-
Contractors
-
Monitoring & Evaluation Teams
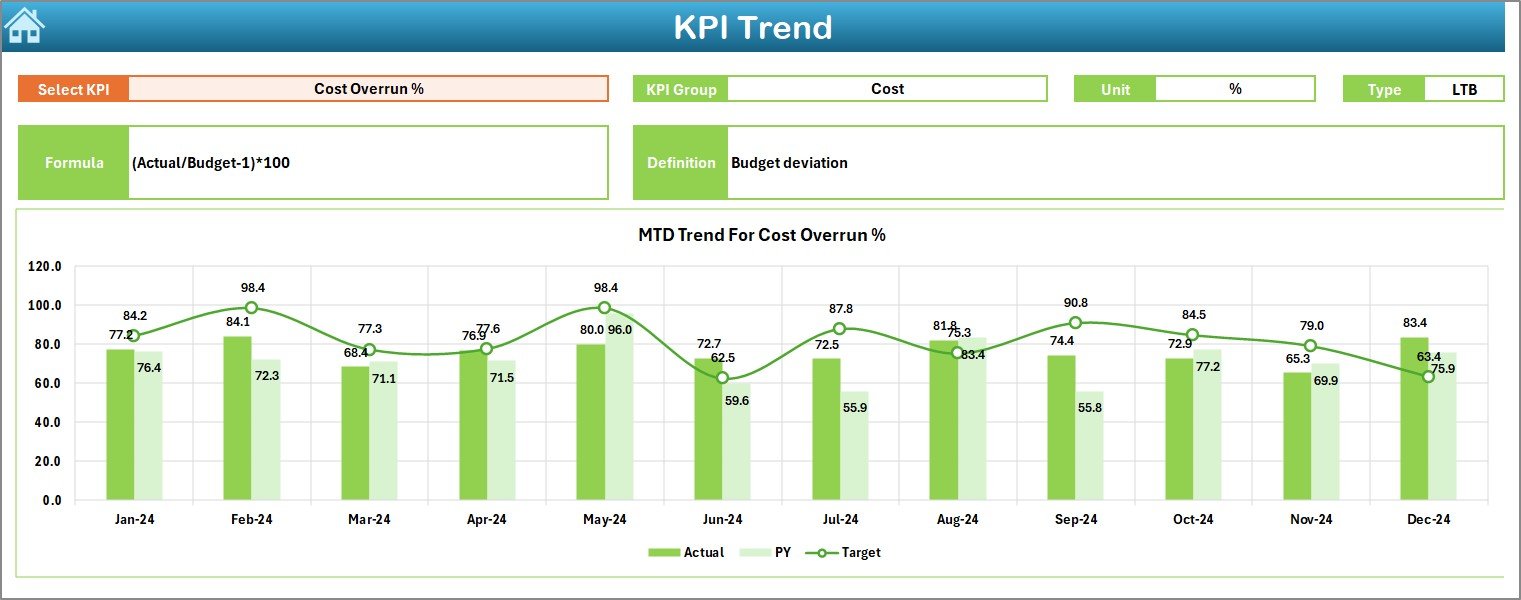
📈 KPI Trend Sheet – Study KPI Movement Over Time
The KPI Trend Sheet helps you understand monthly and yearly patterns.
After selecting a KPI (Cell C3), you get:
-
KPI Group (e.g., Productivity, Safety, Equipment, Material Usage)
-
Unit of Measurement (%, km, m³, hrs, etc.)
-
KPI Type (UTB – Upper the Better / LTB – Lower the Better)
-
Formula
-
KPI Definition
Two powerful charts display:
-
📉 MTD Trend (Actual vs Target vs PY)
-
📈 YTD Trend (Actual vs Target vs PY)
These visuals help you identify:
-
Delays
-
Cost overruns
-
Safety issues
-
Performance slumps
-
Material wastage
This sheet is essential for long-term planning and early warnings.
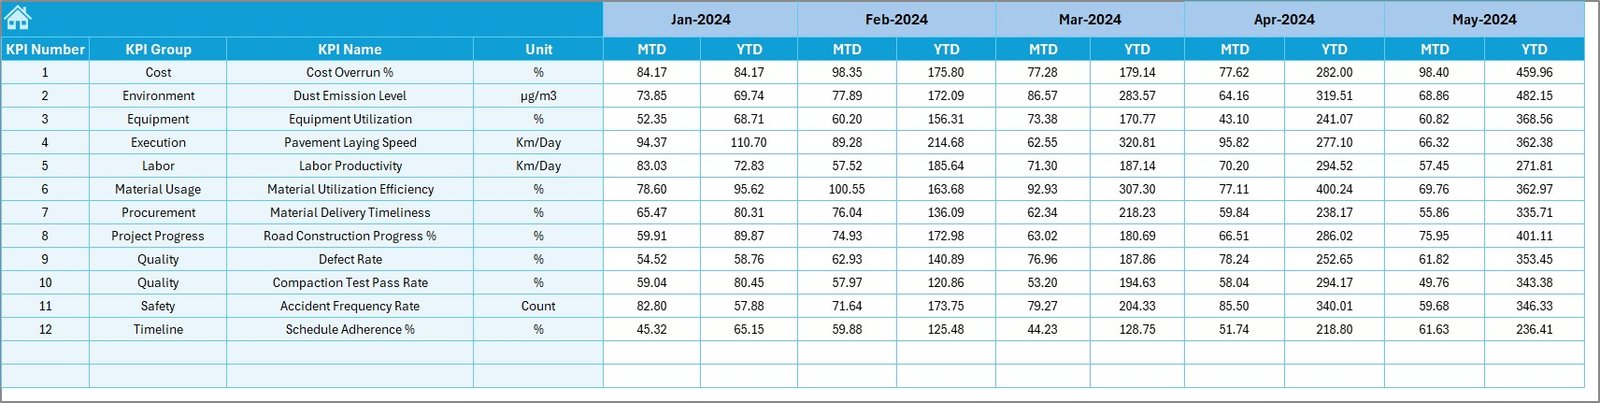
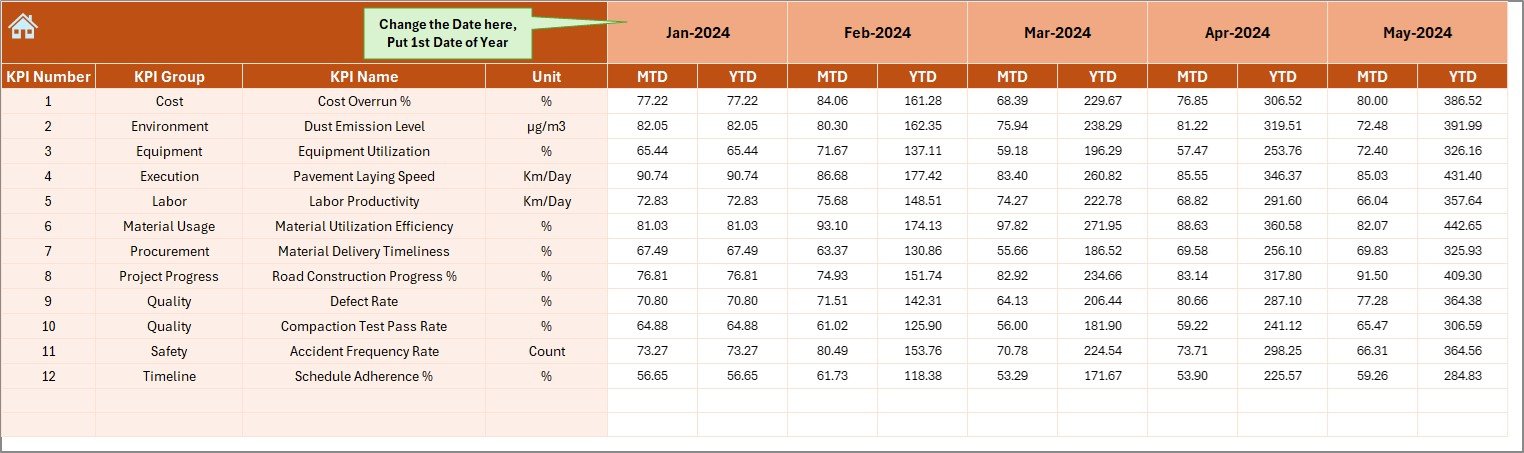
📝 Actual Numbers Input Sheet – Easy Monthly Data Entry
Enter:
-
KPI Name
-
Month
-
MTD Value
-
YTD Value
The Month Selector (Cell E1) adjusts the reporting period automatically.
This sheet ensures clean, structured data for accurate dashboard output.
🎯 Target Sheet – Define Clear Benchmarks
Enter:
-
KPI Target MTD
-
KPI Target YTD
-
KPI Name
-
Month
Targets help you measure whether construction performance meets expectations.
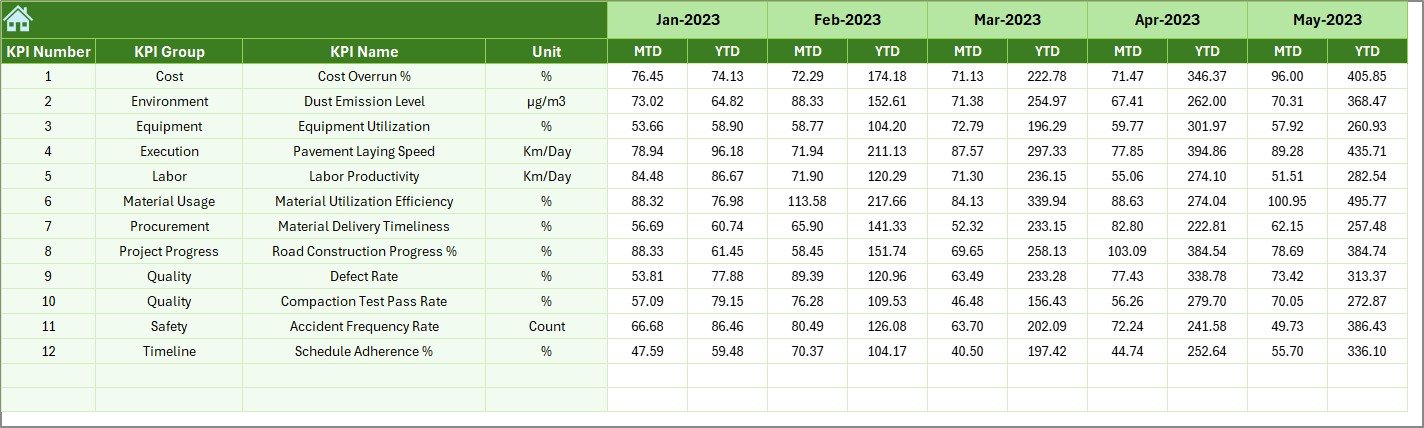
📚 Previous Year Numbers – Compare Year-over-Year Results
Record:
-
Previous Year MTD
-
Previous Year YTD
This helps the dashboard evaluate:
-
CY vs PY (MTD)
-
CY vs PY (YTD)
Year-over-year comparison reveals long-term growth and improvement.
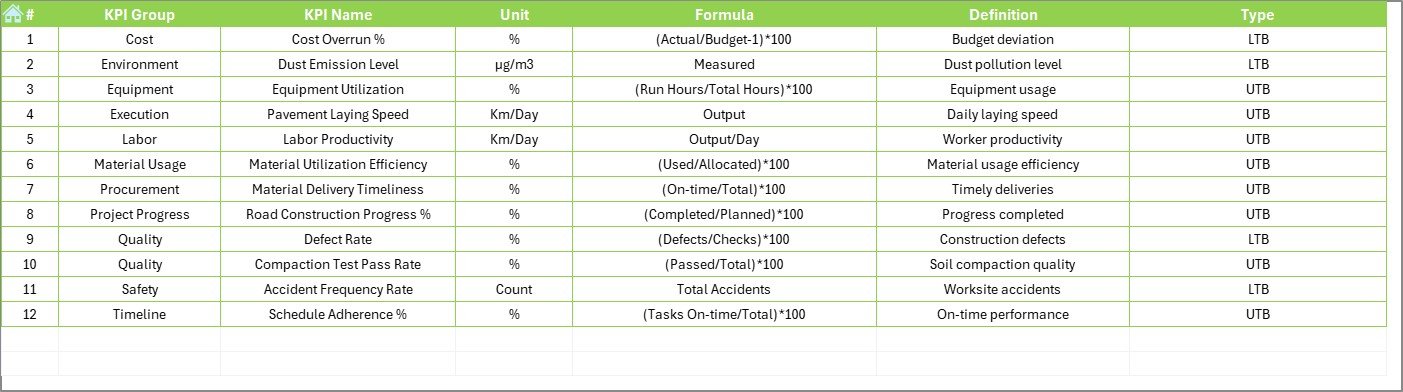
📘 KPI Definition Sheet – Complete KPI Clarity
Enter:
-
KPI Name
-
KPI Group
-
KPI Unit
-
KPI Type (UTB/LTB)
-
KPI Formula
-
KPI Definition
This ensures consistent reporting and avoids confusion among engineers and contractors.
🌟 Who Can Benefit from This Dashboard?
👷 Project Managers
Track progress, productivity, and delays accurately.
🏗️ Construction Contractors
Monitor efficiency, cost, and quality.
🛣️ Road & Highway Authorities
Ensure projects stay on track.
🧑🔧 Engineering Teams
Check material usage, machinery efficiency, and performance.
🧾 Consultants & Monitoring Teams
Analyze trends and identify risks.
💡 Why Your Road Construction Project Needs This Dashboard
-
📈 All KPIs in one dashboard
-
⚡ Instant performance insights
-
📉 Reduce delays & cost overruns
-
🧱 Monitor quality, safety, and efficiency
-
🔍 Compare MTD, YTD & PY performance
-
📊 Trend charts for deeper analysis
-
🧮 Automated calculations
-
🚧 Strong decision-making support
-
🕒 Save hours of manual reporting


Reviews
There are no reviews yet.