Road and highway construction involves heavy capital investment, multiple regions, changing material prices, equipment movement, labor management, and strict deadlines. One wrong estimate or delayed insight can cost millions.
If you are still relying on scattered spreadsheets and delayed reports, you are risking profit every single day.
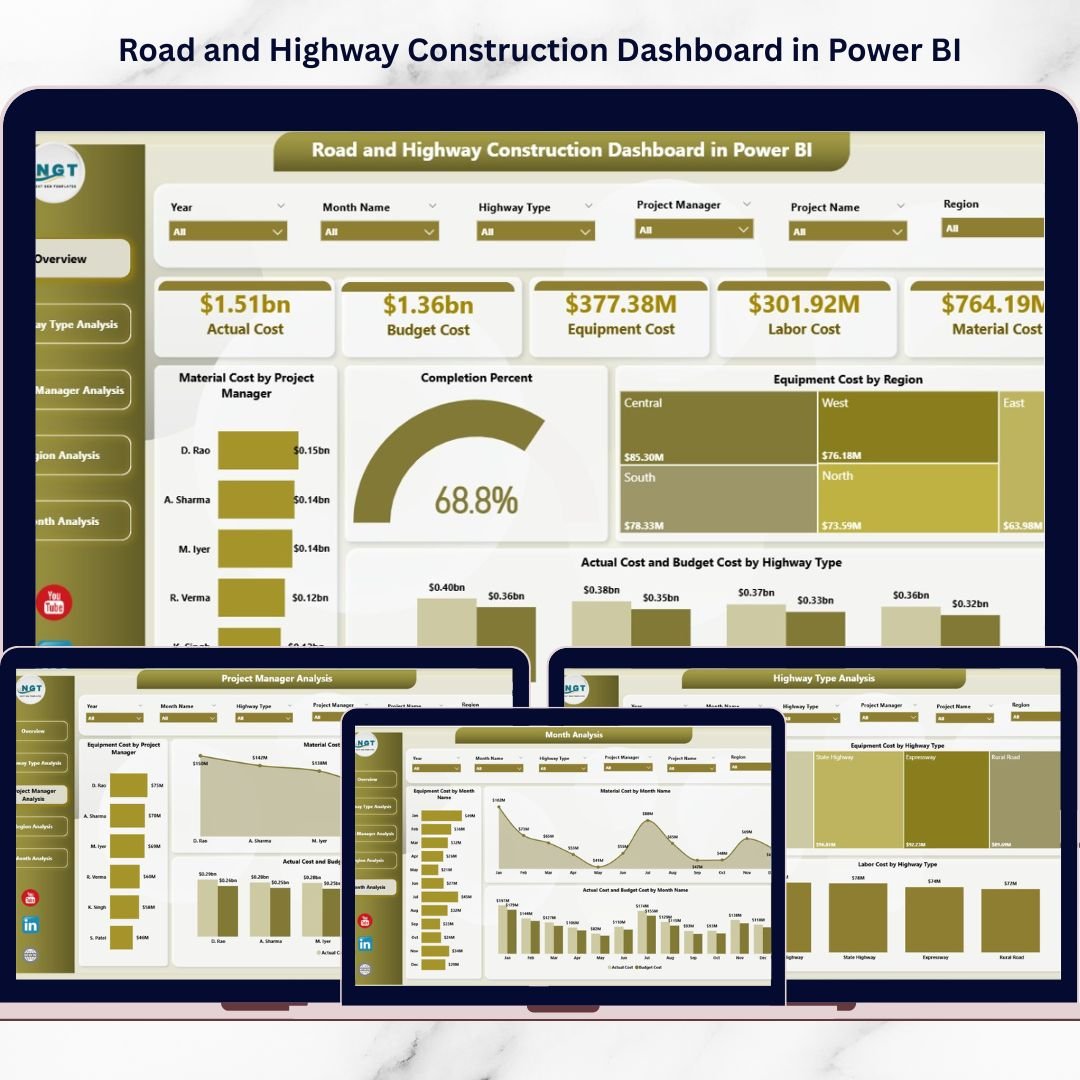
That’s why we created the Road and Highway Construction Dashboard in Power BI — a powerful, ready-to-use solution designed to give you complete cost control, performance clarity, and smarter decision-making.
This dashboard transforms raw construction data into actionable visual insights so you can manage projects with confidence.
🚀 Key Feature of Road and Highway Construction Dashboard in Power BI
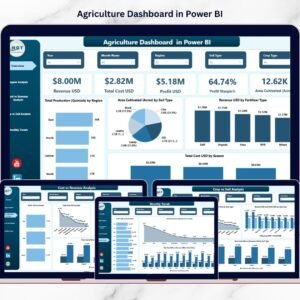
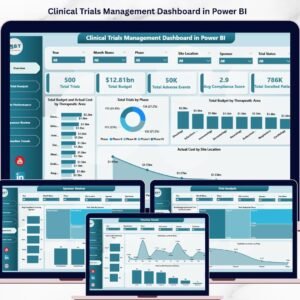
This dashboard is built with 5 powerful analytical pages that cover every critical angle of project performance:
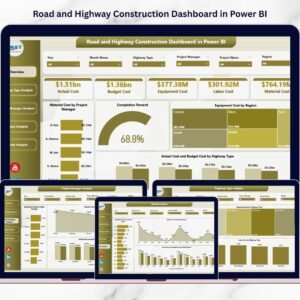
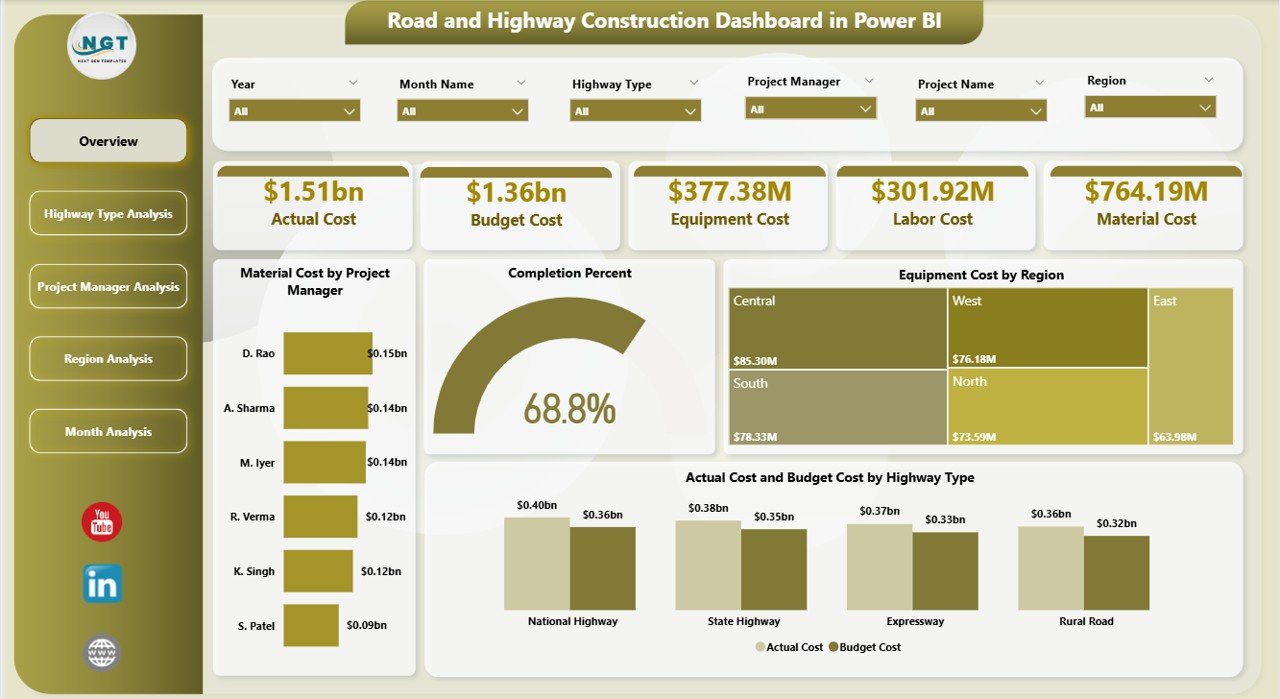
📊 Overview Page (Command Center) – Track material cost, equipment cost, completion %, and actual vs budget instantly.
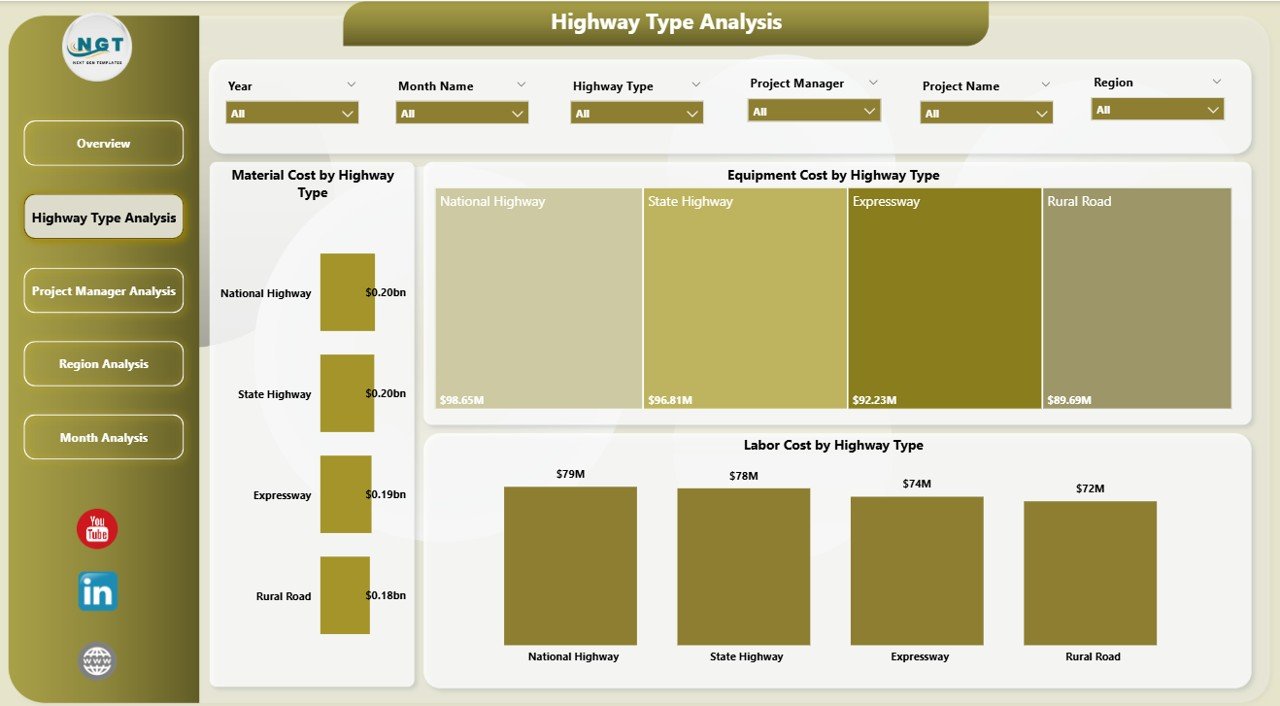
🛣 Highway Type Analysis – Compare material, labor, and equipment costs across highway categories.
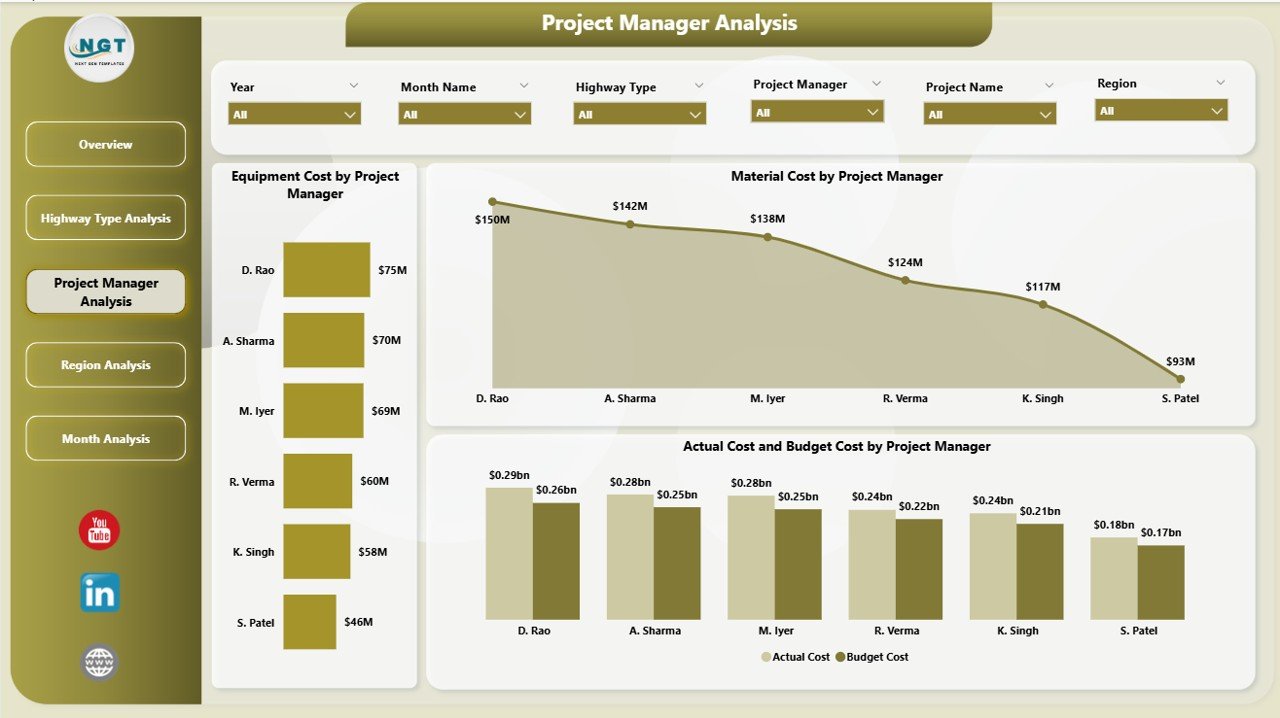
👷 Project Manager Analysis – Evaluate manager performance and detect budget overruns early.
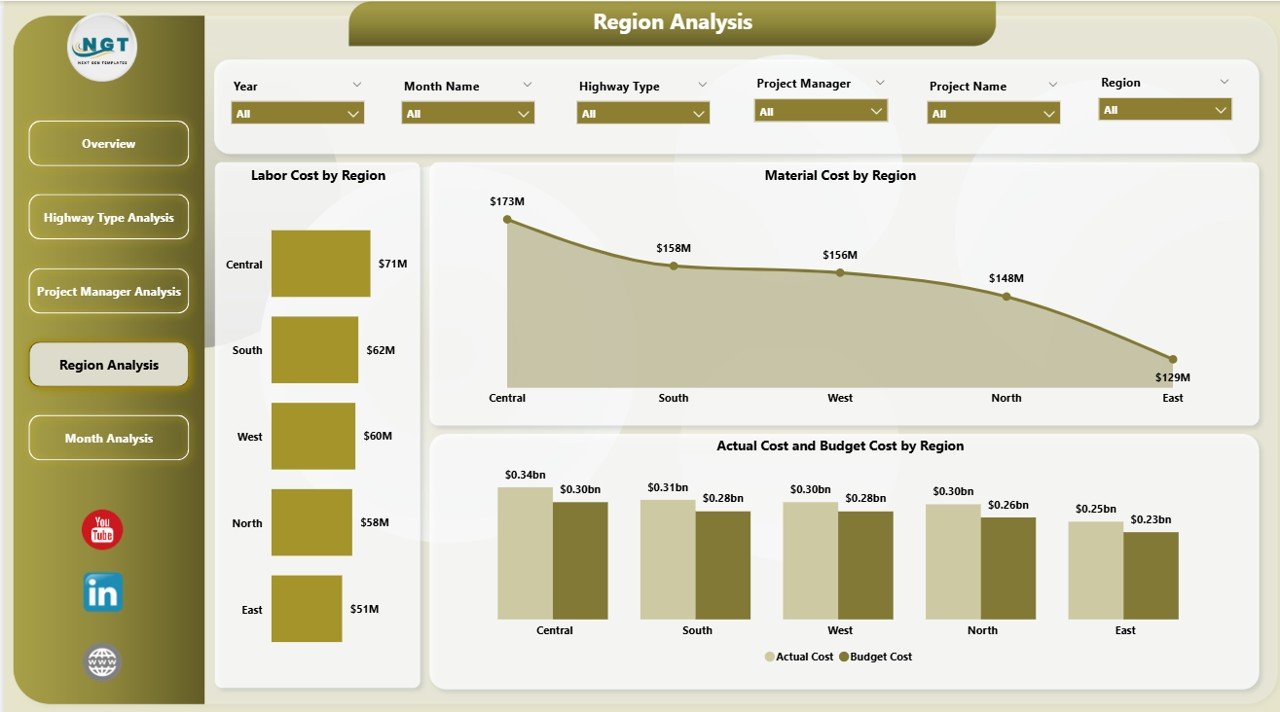
🌍 Region Analysis – Identify high-cost regions and optimize resource allocation.
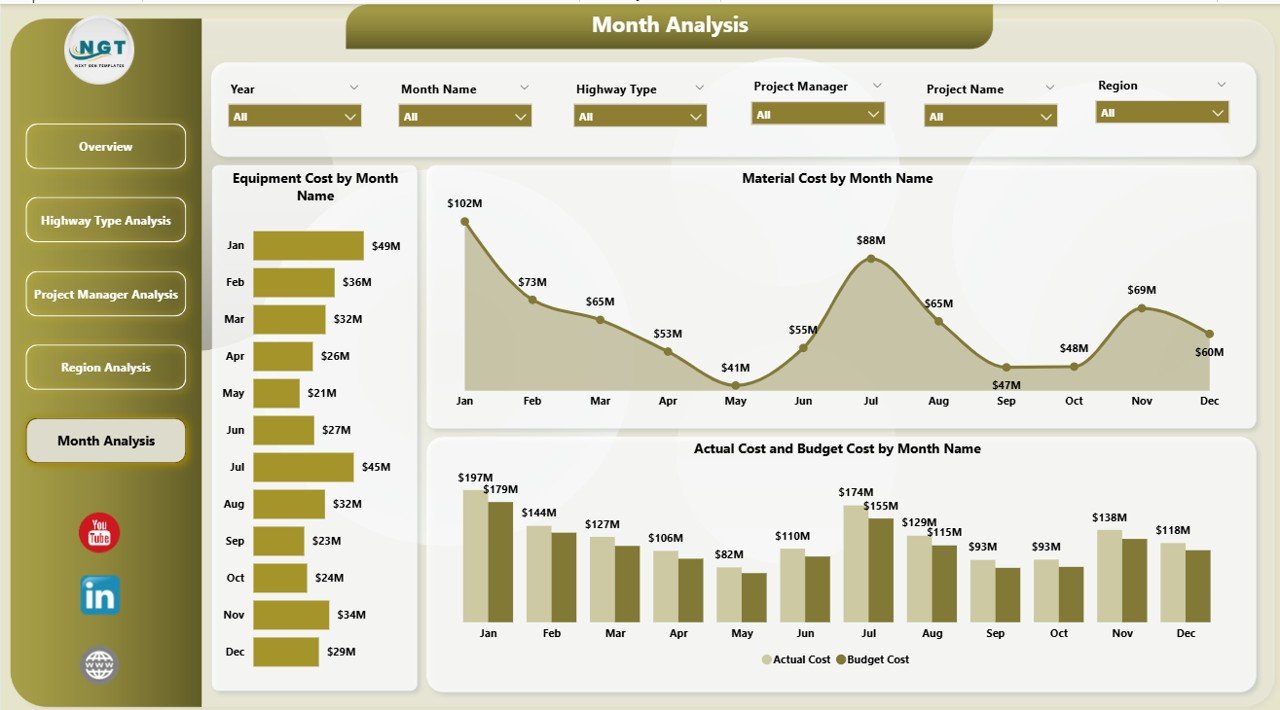
📅 Month Analysis – Monitor cost trends and seasonal variations for better forecasting.
✨ Advanced Power BI capabilities include:
-
Interactive slicers
-
Drill-through functionality
-
Dynamic filtering
-
Real-time data refresh
-
Clear cost comparison visuals
Because of these features, you move from reactive reporting to proactive project control.
📦 What’s Inside the Road and Highway Construction Dashboard in Power BI
This ready-to-use Power BI file includes:
✔ Professionally designed 5-page dashboard
✔ Pre-built KPI visuals and cost comparison charts
✔ Actual vs Budget tracking across managers and regions
✔ Completion percentage monitoring
✔ Material, Labor & Equipment cost analysis
✔ Highway type cost distribution
✔ Monthly trend tracking visuals
✔ Interactive filters for region, manager, month, and project type
You don’t need to design anything from scratch. Just connect your data and start analyzing instantly.
🛠 How to Use the Road and Highway Construction Dashboard in Power BI
Using this dashboard is simple and practical:
1️⃣ Import your construction data into Power BI.
2️⃣ Refresh the dashboard with updated cost and project data.
3️⃣ Use slicers to filter by region, project manager, highway type, or month.
4️⃣ Compare Actual vs Budget instantly.
5️⃣ Identify cost spikes and performance gaps.
For example:
If completion percentage drops below 75%, you can immediately investigate delays.
If one region shows 15% higher labor cost, you can review contracts or resource allocation.
If equipment cost spikes for expressways, you can revise equipment planning.
Because everything updates dynamically, you make decisions faster and with greater accuracy.
👥 Who Can Benefit from This Road and Highway Construction Dashboard in Power BI
This dashboard is designed for:
🏗 Construction Company Owners
👷 Infrastructure Project Managers
💼 Finance & Cost Control Teams
🌍 Regional Managers
🛣 Highway Contractors
🏛 Government Infrastructure Departments
Whether you manage multi-million infrastructure projects or regional road development programs, this dashboard supports both operational monitoring and strategic planning.
It improves:
✔ Budget control
✔ Cost transparency
✔ Project accountability
✔ Resource optimization
✔ Profit margin management
When you centralize project data into one intelligent reporting system, errors reduce and efficiency increases.
💰 Why This Dashboard Boosts Profitability
Profitability in construction depends on early detection of cost overruns and accurate planning.
This dashboard helps you:
-
Detect budget variance early
-
Reduce material waste
-
Optimize equipment usage
-
Track completion progress
-
Forecast expenses using monthly trends
Instead of reacting to financial damage, you prevent it.
And that is where real profitability begins.
Click here to read the Detailed blog post
Visit our YouTube channel to learn step-by-step video tutorials