


In today’s volatile business landscape, managing risk isn’t just about prevention — it’s about preparation, resilience, and data-driven decision-making. ⚙️📊
The Risk Management KPI Scorecard in Excel is a comprehensive, ready-to-use tool that empowers organizations to track, evaluate, and mitigate risks efficiently. Designed for risk managers, auditors, and compliance professionals, this Excel-based dashboard provides real-time insights into how effectively your company manages financial, operational, and strategic risks.
With built-in automation, interactive visuals, and intuitive navigation, this scorecard simplifies complex risk data into clear, actionable metrics. Whether you’re conducting monthly reviews, preparing audit reports, or presenting to executives, this tool ensures your risk insights are always accurate and professional.
⚙️ Key Features of the Risk Management KPI Scorecard
📊 Four Structured Worksheet Tabs:

-
Scorecard Sheet: The central dashboard where you can view and analyze risk KPIs using dropdowns for Month, MTD, and YTD performance.
-
KPI Trend Sheet: Provides historical trend analysis and helps identify long-term risk patterns with dynamic charts.
-
Input Data Sheet: Record and manage actual, target, and previous year data in a clean, structured format that updates visuals automatically.
-
KPI Definition Sheet: Defines every KPI with its formula, unit, and type (LTB or UTB) to maintain accuracy and consistency.
🎯 Dynamic Data Visualization:
-
Automatic comparison of Actual vs Target and Previous Year performance.
-
Color-coded indicators (🟢 for on track, 🔴 for below target) for instant visual insights.
-
Interactive charts for trend and variance analysis.
⚙️ MTD & YTD Tracking:
Switch easily between Month-to-Date and Year-to-Date analysis with dropdown selectors.
🧭 Customizable KPIs:
Add, modify, or remove KPIs to align with your organization’s unique risk framework — from financial and operational to strategic or compliance risks.
💡 Smart Automation:
Built-in formulas update charts, indicators, and scorecards in real-time, minimizing manual work.
📂 What’s Inside the Risk Management KPI Scorecard in Excel
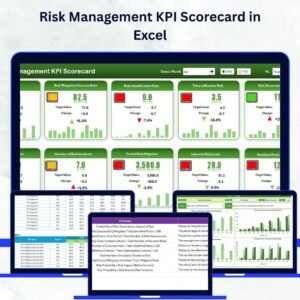
✨ Scorecard Sheet:
Your main dashboard for executive reporting. Visualize key risk metrics such as Risk Exposure, Incident Rate, Control Effectiveness, and Compliance Score — all in one interactive view.
📈 KPI Trend Sheet:
Select any KPI from the dropdown to see historical performance trends. Analyze MTD and YTD progress for Actual, Target, and Previous Year, helping you anticipate risks before they escalate.
🧾 Input Data Sheet:
The foundation of the scorecard. Input your monthly data once, and Excel takes care of the rest — updating charts, scorecards, and trends automatically.
📘 KPI Definition Sheet:
Store all KPI details here — Group, Unit, Formula, and Definition. It ensures consistency and standardization across departments.
💡 How to Use the Risk Management KPI Scorecard
1️⃣ Open the Excel Template and navigate to the Scorecard Sheet for an instant overview.
2️⃣ Define KPIs in the KPI Definition Sheet — add names, formulas, and measurement types.
3️⃣ Enter Data in the Input Data Sheet — Actual, Target, and Previous Year values.
4️⃣ Switch Views between MTD and YTD analysis using the dropdown menu.
5️⃣ Review Trends in the KPI Trend Sheet for monthly or yearly performance tracking.
6️⃣ Take Action based on insights — identify underperforming areas and prioritize corrective measures.
Within minutes, you’ll have a professional, data-backed risk report ready to share with stakeholders. 📈✅
👥 Who Can Benefit from This Scorecard
✅ Risk Managers & Auditors: Gain visibility into organizational risk exposure and mitigation effectiveness.
✅ Finance Teams: Track financial risks, control measures, and compliance performance.
✅ Operations Managers: Monitor operational disruptions and safety metrics.
✅ Executives & Boards: Access clear dashboards for quick decision-making.
✅ Compliance Officers: Ensure all regulatory and internal controls are properly tracked.
🌟 Advantages of the Risk Management KPI Scorecard in Excel
-
📊 Centralized Oversight: Monitor all risk metrics in one dashboard.
-
⚡ Automated Insights: Visuals and calculations update instantly with new data.
-
🧭 Customizable Structure: Adapt KPIs to match your business model.
-
💼 Professional Presentation: Clean visuals suitable for audits and board reviews.
-
💰 Cost-Effective: No software licenses or training required — just Excel.
-
🧠 Data-Driven Clarity: Replace assumptions with precise, evidence-based insights.
-
🔄 Continuous Monitoring: Compare monthly and yearly trends to detect risk escalation early.


Reviews
There are no reviews yet.